Back to Journals » Clinical Ophthalmology » Volume 8
Relative sensitivity and specificity of 10-2 visual fields, multifocal electroretinography, and spectral domain optical coherence tomography in detecting hydroxychloroquine and chloroquine retinopathy
Authors Browning D ![]() , Lee C
, Lee C
Received 19 April 2014
Accepted for publication 13 May 2014
Published 25 July 2014 Volume 2014:8 Pages 1389—1399
DOI https://doi.org/10.2147/OPTH.S66527
Checked for plagiarism Yes
Review by Single anonymous peer review
Peer reviewer comments 2
David J Browning, Chong Lee
Charlotte Eye, Ear, Nose and Throat Associates, Charlotte, NC, USA
Background: The purpose of this study was to determine the relative sensitivity and specificity of 10-2 visual fields (10-2 VFs), multifocal electroretinography (mfERG), and spectral domain optical coherence tomography (SD-OCT) in detecting hydroxychloroquine retinopathy.
Methods: A total of 121 patients taking hydroxychloroquine (n=119) or chloroquine (n=2) with 10-2 VF, mfERG, and SD-OCT tests were retrospectively reviewed. Rates of test abnormality were determined.
Results: Retinopathy was present in 14 and absent in 107. Eleven of 14 (78.6%) patients with retinopathy were overdosed. Twelve (85.7%) had cumulative dosing greater than 1,000 g. The sensitivities of 10-2 VF, mfERG, and SD-OCT in detecting retinopathy were 85.7%, 92.9%, and 78.6%, respectively. The specificities of 10-2 VF, mfERG, and SD-OCT in detecting retinopathy were 92.5%, 86.9%, and 98.1%, respectively. Positive predictive values of 10-2 VF, mfERG, and SD-OCT in detecting retinopathy were less than 30% for all estimates of hydroxychloroquine retinopathy prevalence. Negative predictive values were >99% for all tests.
Conclusion: Based on published estimates of hydroxychloroquine retinopathy prevalence, all three tests are most reliable when negative, allowing confident exclusion of retinopathy in patients taking ≤6.5 mg/kg/day. Each test is less useful in allowing a confident diagnosis of retinopathy when positive, especially in patients taking ≤6.5 mg/kg/day.
Keywords: hydroxychloroquine, chloroquine, retinopathy, multifocal electroretinography, spectral domain optical coherence tomography, ideal body weight, toxicity
Introduction
Individual physicians and national health care policymakers disagree on the need to screen for hydroxychloroquine and chloroquine retinopathy. For hydroxychloroquine, the published consensus in the UK is that screening is unnecessary given the rarity of toxicity in patients prescribed less than 6.5 mg/kg/day based on lean body mass and the absence of a test proven to detect retinopathy at a reversible stage.1–4 In the USA, toxic dosing has been estimated to occur in at least 12% of patients prescribed hydroxychloroquine, and retinopathy to occur in approximately 1% of patients on the drug for more than 5 years.5,6 Therefore, screening for detection and correction of toxic dosing and for detection of retinopathy are considered cost-effective and are the standard of care.7–9
In 2011, revised guidelines for screening hydroxychloroquine retinopathy were published by the American Academy of Ophthalmology that placed emphasis on three ancillary tests, ie, multifocal electroretinography (mfERG), spectral domain optical coherence tomography (SD-OCT), and fundus autofluorescence.8 It was recommended that at least one of these tests be performed, when available, in addition to 10-2 visual field (10-2 VF) testing, which was the standard screening test supplementing ophthalmic examination since previous guidelines of 2002.7,8 In practice, the use of fundus autofluorescence is rare, even when it is available.5 Therefore, mfERG and SD-OCT are the most commonly used tests for hydroxychloroquine screening besides 10-2 VFs.
The revised guidelines influence the behavior of thousands of ophthalmologists in the USA and in other countries where screening for hydroxychloroquine retinopathy is standard, making the performance characteristics of these ancillary tests important. Yet in 2005, there were no such data for mfERG,10 and little subsequently. Fundus autofluorescence and SD-OCT were not used as ancillary tests until 2006 and 2009, respectively.11,12 Since then, scant information addressing their relative performance as screening tests has been published, and what is available has been based on few patients.13 It is the purpose of this article to report on a series of patients taking hydroxychloroquine in whom the relative sensitivity and specificity of 10-2 VF, mfERG, and SD-OCT in the detection of retinopathy have been determined.
Materials and methods
This is a retrospective study of 121 patients screened for hydroxychloroquine and chloroquine retinopathy in a private practice having 26 ophthalmologists and three optometrists. The inclusion criteria were that each patient have good quality 10-2 VF (false-positive and false-negative responses less than 20%), mfERG (no 60 cycle noise or eccentric fixation), and SD-OCT (no artifacts interfering with analysis of retinal layers). The list of patients was obtained by querying the practice’s electronic medical records using the International Classification of Diseases, 9th Revision (ICD-9 code) V58.69. Data extracted from the charts included sex, age, diagnosis, date hydroxychloroquine was started, dose and changes over time, ancillary tests used, height, weight, pre-existing macular abnormalities, and macular description. Patient height and weight were self-reported. Ideal body weight was generally calculated from height by clinicians using the National Heart Lung and Blood Institute table.14 For hydroxychloroquine and chloroquine, doses >6.5 mg/kg/day and >3.0 mg/kg/day, respectively, are referred to as potentially toxic, not because lower doses cannot be associated with maculopathy, but because of the acknowledged higher risk of doses in this range.8–21 In this paper, doses ≤6.5 mg/kg/day and ≤3.0 mg/kg/day for hydroxychloroquine and chloroquine, respectively, are referred to as typically nontoxic, not because doses in this range cannot be associated with maculopathy, but because they typically are not.18,21–23 Thresholds for cumulative dosage at which risk of retinopathy is purported to increase vary in the literature; we have used 1,000 g and 300 g for hydroxychloroquine and chloroquine, respectively.6,24
In studies in which the sensitivity and specificity is to be determined, a gold standard against which the tests will be graded must be defined.25 For the purposes of this work the definition of hydroxychloroquine retinopathy (the gold standard) was that the drug was discontinued by the ophthalmologist and the prescribing physician because retinopathy was considered to be present based on the totality of the clinical evidence. This gold standard has been used before.26,27
To avoid problems of correlated results between eyes, only one eye was included per patient.28 When only one of two eyes had good quality testing, that eye was chosen. When two eyes had good quality testing, a random number generator was used to pick which of the two was included.
To calculate adjusted daily dose, the lesser of the ideal body weight based on height and actual body weight was used as the operative weight and the formula was daily dose (in mg/day)/[operative weight (in pounds)/(2.2 pounds/kg)]. This number has units of mg/kg/day.5 In five cases, only the height (and hence the ideal body weight) was available, and in one case only the actual body weight was available. In these cases, the single available datum was used for the calculation of adjusted daily dose.
VF testing was done with the 10-2 program of the Humphrey visual field analyzer (Carl Zeiss Meditec, Dublin, CA, USA). Visual fields were sometimes performed with a III red test object using a FASTPAC protocol and in other cases with a III white test object using a SITA-FAST protocol. The results for both types were pooled.
Multifocal electroretinograms were performed following International Society for Clinical Electrophysiology of Vision guidelines.29 The mfERGs were performed with the Espion system (Diagnosys LLC, Lowell, MA) running under version 6+ software. DTL fiber electrodes were used. The patients’ eyes were dilated and topical anesthetic was used. The stimulation pattern was dictated by an m-sequence controlling the illumination of 61 contiguous hexagons subtending 30 degrees of VF to either side of fixation. The luminances of the white and black hexagons were 1,000 cd/m2 and 0 cd/m2, respectively. Signals were processed through a 10–100 hertz bandpass filter. The first order kernel response was analyzed. The waveform amplitudes refer to the voltage measured from the trough of the N1 wave to the peak of the P1 wave. The displays are shown in the retinal view (as though looking at a fundus photograph, not as though looking at a VF).
In the interpretation of mfERGs in the context of hydroxychloroquine toxicity screening, various criteria for toxicity have been used, including critical values for amplitude, implicit time, and ring ratios.30–34 In this study, the definition of an abnormal mfERG was that one or more of the following was true: R1, R2, or R3 amplitudes less than the lower limit of normal determined in 32 normal volunteers tested on the same system or an R1/R2 ratio >2.6.5,32
SD-OCTs were obtained with either the Cirrus (Carl Zeiss Meditec) or Spectralis (Heidelberg Engineering, Carlsbad, CA, USA) systems. In interpreting the SD-OCT in the context of screening for hydroxychloroquine toxicity, various criteria have been used including perifoveal loss of the ellipsoid zone, loss of the retinal pigment epithelial layer, and generalized macular thinning.35 In this work, loss of the perifoveal ellipsoid zone and discontinuity of the retinal pigment epithelial layer were used as the definition of an abnormal SD-OCT test. Because only morphologic data were used in the interpretation of the SD-OCTs, the results were pooled from both machines.
Sensitivity, specificity, positive predictive value, and negative predictive value have standard definitions. Sensitivity and specificity can be determined from a case-control study design as was employed here, but positive and negative predictive values depend on prevalence, which can only be determined from a prospective population-based sample. No such study exists, therefore prevalence estimates that have been published in the literature have been used instead in the calculation of positive and negative predictive values. This is consistent with other studies in this field in which positive predictive values and negative predictive values were calculated based on estimated prevalences in the absence of reliable population-based data.36 For ease of reference, the definitions follow:
Sensitivity = (number of true positives)/(number of true positives + number of false negatives) |
Specificity = (number of true negatives)/(number of true negatives + number of false positives) |
Positive predictive value = (sensitivity)(prevalence)/[(sensitivity)(prevalence)+ (1 – specificity)(1 – prevalence)] |
Negative predictive value = (specificity)(1 – prevalence)/[(specificity)(1 – prevalence)+ (1 – sensitivity)(prevalence)] |
Age, weight, and height were non-normally distributed. Therefore, the descriptive statistics presented are nonparametric. Statistical comparisons of were done with the Kruskal–Wallis test or Fisher’s exact test; all tests were two-tailed. JMP 4.0 software (SAS Institute Inc, Cary, NC, USA) was used for statistical calculations and testing. P-values are uncorrected for multiple hypothesis testing. Waiver of informed consent and waiver of Health Insurance Portability and Accountability Act authorization were approved by the Presbyterian Hospital institutional review board (number 12053). This study was conducted in accordance with the Declaration of Helsinki.
Results
Of the 121 patients, 110 (91%) were female. One hundred and nineteen patients were screened for hydroxychloroquine retinopathy. Two patients had been taking chloroquine. Because the pathophysiology, screening methodologies, and clinical issues regarding toxicity are analogous for both drugs, the patients taking chloroquine were included in the analysis. The median age was 63 years (range 21–90; interquartile range [IQR] 50, 72).
Height was determined in 120 patients (99%). The median height was 64 inches (range 59–74; IQR 63, 66). Nineteen percent were 5 feet 3 inches tall or less, the threshold ideal body weight at which the dosage of 400 mg/day of hydroxychloroquine becomes toxic.
Weight was determined in 116 patients (96%). The median weight was 163 pounds (range 135–185; IQR 100, 290). Twenty-two percent weighed 135 pounds or less, a lean body mass threshold below which the hydroxychloroquine dosage of 400 mg/day becomes toxic.
The daily dose of hydroxychloroquine was determined in 114 patients (94%). Sixty-eight (59.6%), 35 (30.7%), and 11 (9.6%) were taking 400 mg/day, 200 mg/day, and 300–399 mg/day, respectively. The patients taking 300–399 mg/day were taking 400 mg/day for most days of the week and skipping the other days’ doses to give the stated average daily dose. Cumulative dosages could be determined in 96 patients (79%). The median dose was 984 g (range 17–3,942; IQR 426, 1,460). Fifty-six (49.4%) patients had taken a cumulative dose of ≥1,000 g, a cumulative dose threshold cited as increasing the risk of retinopathy.6,8,37
Pre-existing maculopathy was present in 27 patients. Twelve had mild age-related retinal pigment epithelial mottling, 12 had drusen, one had a few hemorrhages from a remote macular branch retinal vein occlusion, one had a few microaneurysms attributed to mild nonproliferative diabetic retinopathy, and one had previously undergone vitrectomy for a macular epiretinal membrane.
Of the 121 patients in the study, 107 (88%) did not have hydroxychloroquine retinopathy, were taking the drug, were under active monitoring for toxicity, and were given clearance to continue taking the drug. Fourteen patients (12%; 12 taking hydroxychloroquine and two taking chloroquine) were deemed to have toxic retinopathy and were taken off their medication. All 14 patients with retinopathy were female. Adjusted daily dosages, cumulative dosages, and results of testing are shown in Table 1. Eleven of 14 (78.6%) were overdosed. Twelve (85.7%) had cumulative dosing above thresholds for increased risk.
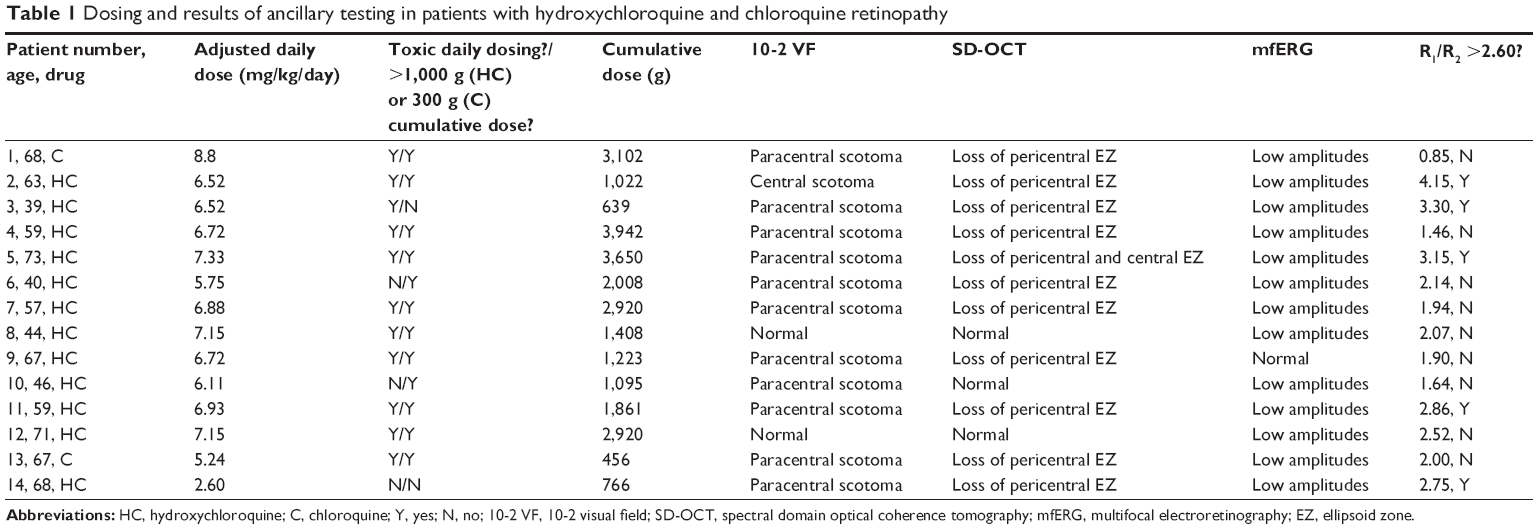 | Table 1 Dosing and results of ancillary testing in patients with hydroxychloroquine and chloroquine retinopathy |
Renal insufficiency was present in one patient (0.8%) and another had had surgery for renal stones, but was not known to have insufficiency; both had hydroxychloroquine retinopathy. Liver disease was present in one patient (0.8%), who did not have hydroxychloroquine retinopathy. Pre-existing maculopathy was present in 2/14 (14.3%) and 25/107 (23.4%) patients with and without hydroxychloroquine retinopathy, respectively (P=0.7332, Fisher’s exact test). The median ages were 61 years (IQR 46, 68) and 63 years (IQR 51, 72) for those with and without hydroxychloroquine retinopathy, respectively (P=0.6942, Kruskal–Wallis test). The proportion of patients aged 60 years or older did not differ between those with or without retinopathy (data not shown).
There were 115 patients taking hydroxychloroquine with data on adjusted daily dose (12 with retinopathy and 103 without retinopathy). The median adjusted daily doses were 6.7 mg/kg/day (IQR 6.2, 7.1) and 5.6 mg/kg/day (IQR 3.6, 6.1) for the patients with and without retinopathy, respectively (P=0.0065, Kruskal–Wallis test). The proportion of these patients taking ≥6.5 mg/kg/day was 9/12 (75.0%) and 17/103 (16.5%) for those with and without retinopathy, respectively (P<0.0001, Fisher’s exact test). The cumulative doses of hydroxychloroquine were known for 96 patients (12 with retinopathy and 84 without retinopathy). The median cumulative doses were 1,635 g (IQR 1,040, 2,920) and 859 g (IQR 365, 1,460) for patients with and without retinopathy, respectively (P=0.0344, Kruskal–Wallis test). The proportion of patients with cumulative doses of hydroxychloroquine 1,000 g or more was 10/12 (83.3%) and 37/84 (44.0%) for those with and without retinopathy, respectively (P=0.0135, Fisher’s exact test).
The mfERG ring averaged amplitudes and the R1/R2 ratio were different between the patients with and without hydroxychloroquine retinopathy (Table 2). The differences with the greatest separation were for rings R2 and R3 followed by R1 and R4. The separation was least for R5 and R1/R2 (Table 2). Of the mfERG variables, a low amplitude of R1, R2, or R3 was more sensitive (13/14, 92.8%) than the R1/R2 ratio (5/14, 35.7%) in detecting retinopathy (Table 2).
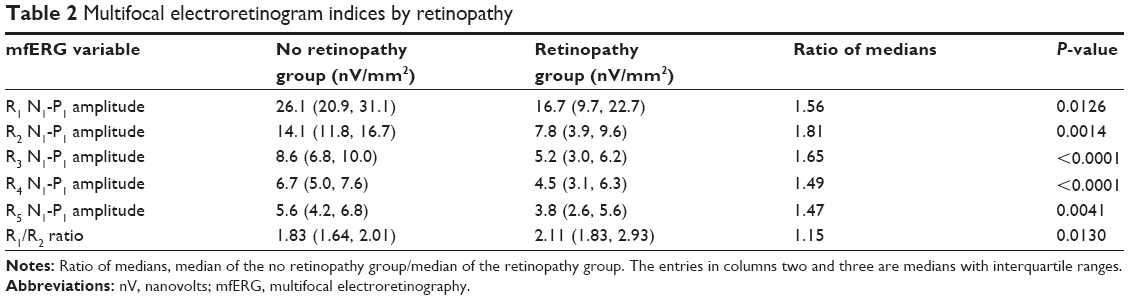 | Table 2 Multifocal electroretinogram indices by retinopathy |
The sensitivity and specificity of the three ancillary tests is shown in Table 3. The order of sensitivity of the tests in detecting hydroxychloroquine retinopathy was mfERG (92.9%) >10-2 VF (85.7%) >SD-OCT (78.6%). The order of specificity was reversed, ie, SD-OCT (98.1%) >10-2 VF (92.5%) >mfERG (86.9%). The combinations of 10-2 VF and mfERG or SD-OCT and mfERG were more sensitive (100%) than either test alone. Table 4 shows the positive and negative predictive values of the three tests for the range of prevalences that have been reported.6,9,38–42 All three tests share the trait of having a high negative predictive value. The 10-2 VF and mfERG have a low positive predictive value for the most probable prevalences (0.1% and 1%). The SD-OCT is distinguished by its higher positive predictive value at these more probable prevalences compared with the other tests.
 | Table 3 Sensitivity and specificity of ancillary tests for hydroxychloroquine retinopathy |
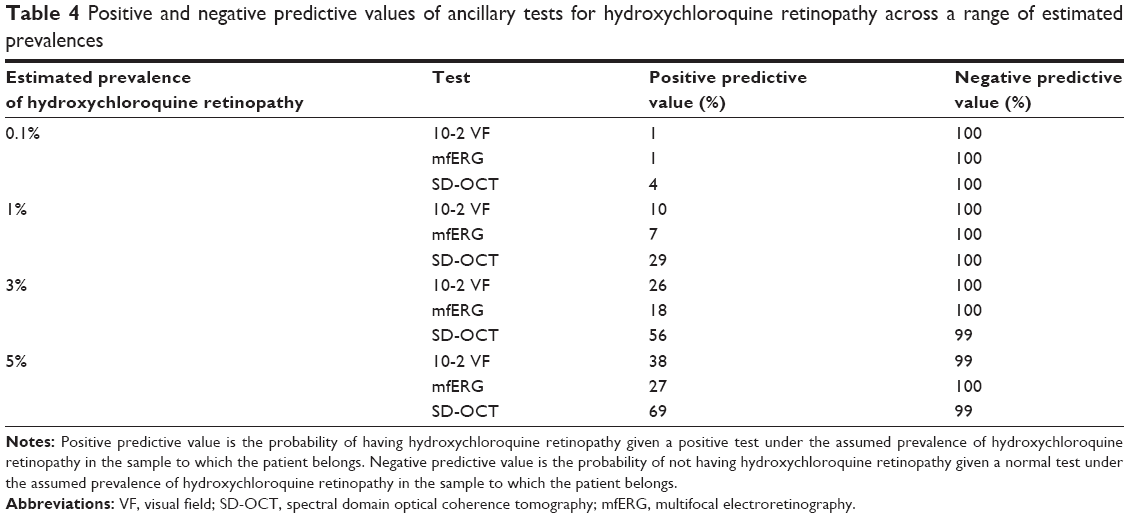 | Table 4 Positive and negative predictive values of ancillary tests for hydroxychloroquine retinopathy across a range of estimated prevalences |
Examples of consistent and discrepant performance of the three screening tests are shown in Figures 1–3. Figure 1 shows a patient with advanced hydroxychloroquine retinopathy in whom all three tests were abnormal and consistent in detecting retinopathy. Figure 2 shows a patient in whom the mfERG detected retinopathy, but the 10-2 VF and SD-OCT were normal (false negatives). Figure 3 shows a patient in whom the 10-2 VF and SD-OCT detected retinopathy, but the mfERG was normal (false negative).
 | Figure 1 Hydroxychloroquine toxicity detected by three ancillary tests. |
 | Figure 2 Hydroxychloroquine retinopathy detected by multifocal electroretinography, but not by 10-2 visual field testing or spectral domain optical coherence tomography. |
 | Figure 3 Hydroxychloroquine toxicity detected by 10-2 visual field and spectral domain optical coherence tomography testing, but not by multifocal electroretinography. |
Discussion
The sample of patients taking hydroxychloroquine in this series was comparable with others reported in the literature. Ninety-one percent of the patients were female, similar to the 77%–94% reported previously.38,43–45 The patients in this series who developed hydroxychloroquine retinopathy were all female, also consistent with the heavy female preponderance noted previously.13,15,42 Adjusted daily dose and cumulative dose were both associated with retinopathy. The association was stronger for adjusted daily dose. Renal disease was a factor in one patient with retinopathy. This patient was taking a toxic dose for a person with normal renal function; the toxicity may have been exacerbated by her renal dysfunction. Age and pre-existing maculopathy were not associated with retinopathy.
Multifocal electroretinography was first shown to be abnormal in advanced hydroxychloroquine retinopathy in 1999.46 In a relatively small number of cases, it was shown subsequently to be able to detect cases of retinopathy before visual acuity, color vision testing, Amsler grid testing, Goldmann perimetry, and full field electroretinographic testing showed abnormalities.30,34,47 It was suggested based on small case series, but not demonstrated in a sample of sufficient size, that it was more sensitive than 10-2 VF testing.30,48 An additional advantage of mfERG according to its proponents is that it is more objective than 10-2 VF testing, inasmuch as it does not depend on the patient’s response of pushing a button, which can be influenced by factors other than seeing the stimulus.8,34
What has not been emphasized, however, is that subjectivity is not absent from mfERG testing, but has only been shifted from acquisition of the data to its interpretation. That is, there is no consensus on the definition of an abnormal multifocal electroretinogram. Some clinicians subjectively compare the waveforms of the patient to a single normal control in a nonstatistical visual comparison,46 others compare waveform amplitudes for each hexagon to control values,48 others compare amplitudes of waveforms averaged over multiple hexagons arranged in rings,30,34,49,50 others use ring ratios,5,34 and others analyze the color difference plot in which patient data are compared with normal unpublished data provided by the machine manufacturer, the details of which are unknown.51 Some examine amplitudes only, but others compare waveform latencies.30,52 Some use internal normal controls for comparisons.30 Others use population norms supplied by instrument manufacturers or taken from published literature.51 Some use patterns of mfERG change, but their classifications of patterns differ.30,34 In some cases it appears that a rough gestalt is obtained after viewing the hexagonal waveforms, without any defined criteria being applied.53
The sensitivity and specificity of mfERG testing will depend on the definition chosen for mfERG abnormality.34 For example, Lyons and Severns state “In order to maximize the specificity of the testing, the 99th percentile one-tailed limits are used”.34 They also excluded the peripheral loss pattern from their calculations of the prevalence of toxicity, because it was not seen in patients taking >1,125 g cumulative dose. As another example, Xiaoyun et al defined an abnormal mfERG as having either a low N1 amplitude or a low P1 amplitude for the R1 or R2 average waveform and found that 70% of patients with rheumatoid arthritis taking chloroquine had an abnormal mfERG.50 Had they required in addition an R1/R2 ratio >2.6, the percentage would probably have been lower. With certain low threshold definitions of mfERG abnormality, 20%–70% of patients taking hydroxychloroquine and chloroquine develop mfERG abnormalities.50,52
There is little published evidence for the relative sensitivity and specificity of mfERG compared with 10-2 VF. Maturi et al reported a series of 15 patients (30 eyes, some with and others without evidence of toxicity by the different testing modalities), in whom both mfERG and Humphrey 30-2 perimetry were both available.30 Even though the 30-2 program is an inferior method of screening compared with the 10-2 program,15,54 there was no clear evidence of greater sensitivity of one test compared with the other.30 Normal mfERG responses and abnormal 30-2 VFs were found in eleven eyes compared with abnormal mfERG responses and normal 30-2 VFs in four eyes. The correlation between eyes of the same patient was not determined in this study. There is even less evidence for the relative sensitivity and specificity of SD-OCT compared with 10-2 VF or mfERG.
When one ancillary test is used as the gold standard and another is compared with it, the reasoning behind the definition of sensitivity and specificity of a test becomes circular.55 Therefore, in this paper, as in others,26,27 the gold standard was chosen to be the physician’s action of stopping hydroxychloroquine based on the totality of the evidence. With this gold standard, it becomes possible to compare with less bias the relative sensitivity and specificity of the three most commonly used ancillary tests used in screening for hydroxychloroquine retinopathy.
Although none of the 10-2 VF, mfERG, or SD-OCT tests has clearly superior performance characteristics as a standalone screening test, there are differences in the reproducibility of the three tests. Retinal thickness measurements with optical coherence tomography are reproducible, with SD-OCT coefficients of variation for macular thickness are <3.5%.56–58 In contrast, neither 10-2 VF testing nor mfERG is highly reproducible. The coefficient of variation for mfERG amplitudes ranges from 10% to 35%.59–62 There are no reproducibility data published for 10-2 VF testing, but the clinical reality of variability and difficulty of interpretation by clinicians is widely cited.13,30,34,54,63 This makes the SD-OCT of particular worth relative to the other two ancillary tests. By combining the three tests, it was possible to achieve 100% sensitivity for detection of hydroxychloroquine retinopathy. One hundred percent sensitivity was achieved for the combinations 10-2 VF + mfERG and SD-OCT + mfERG, but not for 10-2 VF + SD-OCT, which had a sensitivity of 89%.
Reliable data on prevalence of hydroxychloroquine retinopathy among users would need to come from a population-based study with standard examination techniques and definitions of retinopathy. Such a study has not been done, nor is it likely to be done in the future.55 Therefore, published prevalence estimates provide a crude range within which the true prevalence probably lies. However, regardless of the estimate used, the positive predictive values of 10-2 VFs, mfERGs, and SD-OCTs are low and the negative predictive values are high. The clinical message is that these tests rarely misclassify a patient who truly has hydroxychloroquine retinopathy as healthy, but they are subject to misclassifying healthy persons as having hydroxychloroquine retinopathy. The appropriate clinical response is to make sure that the patient’s sole modifiable risk factor, the adjusted daily dose, lies in a range of higher safety, to use more than one test to assess suspicious cases, and to evaluate the patient longitudinally with shortened follow-up intervals in suspicious cases. If the suspicion is insufficient to stop the drug, but higher than responding by simply intensifying monitoring, the daily dose can be reduced. Several have advocated a lower adjusted daily dose threshold of 6.0 mg/kg/day in cases in which risk reduction is important.15,64,65 The risk of retinopathy decreases as dosing is lowered.
The present study has limitations. There were only 14 cases of hydroxychloroquine and chloroquine retinopathy for which all three tests were available. We can assess the marginal error of our sensitivity statistic if we assume that a test with a calculated sensitivity of 92.9% such as the mfERG performed poorly on the next case of retinopathy. In this case, the calculated sensitivity of the test would fall to 86.7%, an undesirably large marginal error of 6.2%. This is not the case for the specificity, for which an analogous calculation in the instance of the 10-2 VF shows a marginal error of 0.8%. It would be helpful to have studies with larger samples of hydroxychloroquine retinopathy for more robust estimation of test sensitivities. Nevertheless, this study provides the largest series in the literature attempting to estimate the sensitivities and specificities of these commonly used tests.
Disclosure
Neither author has any proprietary interest in any product described herein. No grant funding was used in this research. The authors report no conflicts of interest in this work.
References
Bourke B, Jones S, Rajammal AK, Silman A, Smith R. Hydroxychloroquine and ocular toxicity recommendations on screening. 2009. Available from: http://www.rcophth.ac.uk/documents.asp?section=39§ionTitle=Publications&searchterm=hydroxychloroquine&x=11&y=11. Accessed June 13, 2014. | ||
Easterbrook M. An ophthalmological view on the efficacy and safety of chloroquine versus hydroxychloroquine. J Rheumatol. 1999;26:1866–1867. | ||
Morsman CD, Livesey SJ, Richards IM, Jessop JD, Mills PV. Screening for hydroxychloroquine retinal toxicity: is it necessary? Eye. 1990;4:572–576. | ||
Silman A, Shipley M. Ophthalmological monitoring for hydroxychloroquine toxicity: a scientific review of available data. Br J Rheumatol. 1997;36:599–601. | ||
Browning DJ. Impact of the revised American Academy of Ophthalmology Guidelines regarding hydroxychloroquine screening on actual practice. Am J Ophthalmol. 2013;155:418–428. | ||
Wolfe F, Marmor MF. Rates and predictors of hydroxychloroquine retinal toxicity in patients with rheumatoid arthritis and systemic lupus erythematosus. Arthritis Care Res. 2010;62:775–784. | ||
Marmor MF, Carr RE, Easterbrook M, et al. Recommendations on screening for chloroquine and hydroxychloroquine retinopathy. Ophthalmology. 2002;109:1377–1382. | ||
Marmor MF, Kellner U, Lai TYY, Lyons JS, Mieler WF. Revised recommendations on screening for chloroquine and hydroxychloroquine retinopathy. Ophthalmology. 2011;118:415–422. | ||
Tehrani R, Ostrowski RA, Hariman R, Jay WM. Ocular toxicity of hydroxychloroquine. Semin Ophthalmol. 2008;23:201–209. | ||
Marmor MF. The dilemma of hydroxychloroquine screening: new information from the multifocal ERG. Am J Ophthalmol. 2005;140:894–895. | ||
Kellner U, Renner AB, Tillack H. Fundus autofluorescence and mfERG for early detection of retinal alterations in patients using chloroquine/ hydroxychloroquine. Invest Ophthalmol Vis Sci. 2006;47:3531–3538. | ||
Kellner S, Weinitz S, Kellner U. Spectral domain optical coherence tomography detects early stages of chloroquine retinopathy similar to multifocal electroretinography, fundus autofluorescence and near-infrared autofluorescence. Br J Ophthalmol. 2009;93:1444–1447. | ||
Marmor MF. Comparison of screening procedures in hydroxychloroquine toxicity. Arch Ophthalmol. 2012;130:461–469. | ||
Browning DJ. Reply to defining ideal body weight. Am J Ophthalmol. 2002;134:935–936. | ||
Browning DJ. Hydroxychloroquine and chloroquine retinopathy: screening for drug toxicity. Am J Ophthalmol. 2002;133:649–656. | ||
Bernstein HN. Ophthalmologic considerations and testing in patients receiving long-term antimalarial therapy. Am J Med. 1983;75:25–34. | ||
Mackenzie AH. Dose refinements in long-term therapy of rheumatoid arthritis with antimalarials. Am J Med. 1983;75:40–45. | ||
Bernstein HN. Ocular safety of hydroxychloroquine. Ann Ophthalmol. 1991;23:292–296. | ||
Johnson MW, Vine AK. Hydroxychloroquine therapy in massive total doses without retinal toxicity. Am J Ophthalmol. 1987;104:139–144. | ||
Easterbrook M. The ocular safety of hydroxychloroquine. Semin Arthritis Rheum. 1993;23:62–67. | ||
Fung AE, Samy CN, Rosenfeld PJ. Optical coherence tomography findings in hydroxychloroquine and chloroquine-associated maculopathy. Retin Cases Brief Rep. 2007;1:128–130. | ||
Falcone PM, Paolini L, Lou PL. Hydroxychloroquine toxicity despite normal dose therapy. Ann Ophthalmol. 1993;25:385–388. | ||
Weiner A, Sandberg MA, Gaudio AR, Kini MM, Berson EL. Hydroxychloroquine retinopathy. Am J Ophthalmol. 1991;112:528–534. | ||
Nylander U. Ocular damage in chloroquine therapy. Acta Ophthalmol. 1966;44:335–338. | ||
Jekel JF, Elmore JG, Katz DL. Epidemiology, Biostatistics, and Preventive Medicine. Philadelphia, PA, USA: WB Saunders; 1996. | ||
Michaelides M, Stover NB, Francis PJ, Weleber RG. Retinal toxicity associated with hydroxychloroquine and chloroquine: risk factors, screening, and progression despite cessation of therapy. Arch Ophthalmol. 2011;129:30–39. | ||
Kellner U, Kellner S, Weinitz S. Chloroquine retinopathy: lipofuscin- and melanin-related fundus autofluorescence, optical coherence tomography and multifocal electroretinography. Doc Ophthalmol. 2008;116:119–127. | ||
Murdoch IE, Morris SS, Cousens SN. People and eyes: statistical approaches in ophthalmology. Br J Ophthalmol. 1998;82:971–973. | ||
Hood DC, Bach M, Brigell M, et al. ISCEV guidelines for clinical multifocal electroretinography (2007 edition). Doc Ophthalmol. 2007;116:1–11. | ||
Maturi RK, Yu M, Weleber RG. Multifocal electroretinographic evaluation of long-term hydroxychloroquine users. Arch Ophthalmol. 2004;122:973–981. | ||
Farrell DF. Retinal toxicity to antimalarial drugs: chloroquine and hydroxychloroquine: a neurophysiologic study. Clin Ophthalmol. 2012;6:377–383. | ||
Lyons JS, Severns ML. Detection of early hydroxychloroquine retinal toxicity enhanced by ring ratio analysis of multifocal electroretinography. Am J Ophthalmol. 2007;143:801–809. | ||
Missner S, Kellner U. Comparison of different screening methods for chloroquine/hydroxychloroquine retinopathy: multifocal electroretinography, color vision, perimetry, ophthalmoscopy, and fluorescein angiography. Graefes Arch Clin Exp Ophthalmol. 2012;250:319–325. | ||
Lyons JS, Severns ML. Using multifocal ERG ring ratios to detect and follow Plaquenil retinal toxicity: a review. Doc Ophthalmol. 2009;118:29–36. | ||
Chen E, Brown DM, Benz MS, et al. Spectral domain optical coherence tomography as an effective screening test for hydroxychloroquine retinopathy (the “flying saucer” sign). Clin Ophthalmol. 2010;4:1151–1158. | ||
Vu BLL, Easterbrook M, Hovis JK. Detection of color vision defects in chloroquine retinopathy. Ophthalmology. 1999;106:1799–1804. | ||
May K, Metcalf T, Gough A. Screening for hydroxychloroquine retinopathy. BMJ. 1998;317:1388–1389. | ||
Mavrikakis I, Sfikakis PP, Mavrikakis E, et al. The incidence of irreversible retinal toxicity in patients treated with hydroxychloroquine – a reappraisal. Ophthalmology. 2003;110:1321–1326. | ||
Nebbioso M, Grenga R, Karavitas P. Early detection of macular changes with multifocal ERG in patients on antimalarial drug therapy. J Ocul Pharmacol Ther. 2009;25:249–258. | ||
Levy GD, Munz SJ, Paschal J, Cohen HB, Prince KJ, Peterson T. Incidence of hydroxychloroquine retinopathy in 1,207 patients in a large multicenter outpatient practice. Arthritis Rheum. 1997;40:1482–1486. | ||
Easterbrook M. Ocular effects and safety of antimalarial agents.Am J Med. 1988;85:23–29. | ||
Yam JC, Kwok AK. Ocular toxicity of hydroxychloroquine. Hong Kong Med J. 2006;12:294–304. | ||
Elder M, Rahman AM. Early paracentral visual field loss in patients taking hydroxychloroquine. Arch Ophthalmol. 2006;124:1729–1733. | ||
Rynes RI. Ophthalmologic safety of long-term hydroxychloroquine sulfate treatment. Am J Med. 1983;75:35–39. | ||
Almony A, Garg S, Peters RK, et al. Threshold Amsler grid as a screening tool for asymptomatic patients on hydroxychloroquine therapy. Br J Ophthalmol. 2005;89:569–574. | ||
Maturi RK, Folk JC, Nichols B, Oetting TT, Kardon RH. Hydroxychloroquine retinopathy. Arch Ophthalmol. 1999;117:1262–1263. | ||
Kellner U, Kraus H, Foerster MH. Multifocal ERG in chloroquine retinopathy. Graefes Arch Clin Exp Ophthalmol. 2000;238:94–97. | ||
Penrose PJ, Tzekov RT, Sutter EE, et al. Multifocal electroretinography evaluation for early detection of retinal dysfunction in patients taking hydroxychloroquine. Retina. 2003;23:503–512. | ||
Adam MK, Covert DJ, Stepien KE, Han DP. Quantitative assessment of the 103 hexagon multifocal electroretinogram in detection of hydroxychloroquine retinal toxicity. Br J Ophthalmol. 2012;96:723–729. | ||
Xiaoyun MA, Dongyi HE, Linping HE. Assessing chloroquine toxicity in RA patients using retinal nerve fiber layer thickness, multifocal electroretinography and visual field test. Br J Ophthalmol. 2010;94:1632–1636. | ||
Chang WH, Katz BJ, Warner JE, Vitale AT, Creel D, Digre KB. A novel method for screening the multifocal electroretinogram in patients using hydroxychloroquine. Retina. 2008;28:1478–1486. | ||
Lai TY, Chan WM, Li H, Lai RY, Lam DS. Multifocal electroretinographic changes in patients receiving hydroxychloroquine therapy. Am J Ophthalmol. 2005;140:794–807. | ||
Schwartz SG, Mieler WF. Retinal and Choroidal Manifestations of Selected Systemic Diseases. New York, NY, USA: Springer; 2013. | ||
Anderson C, Blaha GR, Marx JL. Humphrey visual field findings in hydroxychloroquine toxicity. Eye. 2011;25:1535–1545. | ||
Albert DA, Debois LK, Lu KF. Antimalarial ocular toxicity, a critical appraisal. J Clin Rheumatol. 1998;4:57–62. | ||
Browning DJ, Fraser CM. Intraobserver variability in optical coherence tomography. Am J Ophthalmol. 2004;138:477–479. | ||
Diabetic Retinopathy Clinical Research Network. Reproducibility of macular thickness and volume using Zeiss optical coherence tomography in patients with diabetic macular edema. Ophthalmology. 2007;114:1520–1525. | ||
Wolf-Schnurrbusch, Ceklic L, Brinkmann CK, et al. Macular thickness measurements in healthy eyes using six different optical coherence tomography instruments. Invest Ophthalmol Vis Sci. 2009;50:3432–3437. | ||
Bearse MA Jr, Adams AJ, Han Y, et al. A multifocal electroretinogram model predicting the development of diabetic retinopathy. Prog Retin Eye Res. 2006;25:425–448. | ||
Kondo M, Miyake T, Horiguchi M, Suzuki S, Ho Y, Tanikawa A. [Normal values of retinal response densities in multifocal electroretinogram]. Nihon Ganka Gakkai Zasshi. 1996;100:810–816. Japanese. | ||
Aoyagi K, Kimura Y, Isono H, Akigawa H, Sugawara T. [Reproducibility and wave analysis of multifocal electroretinography]. Nihon Ganka Gakkai Zasshi. 1998;102:340–347. Japanese. | ||
Seiple W, Clemens CJ, Greenstein GC, Carr RC, Holopigian K. Test-retest reliability of the multifocal electroretinogram and Humphrey visual fields in patients with retinitis pigmentosa. Doc Ophthalmol. 2004;109:255–272. | ||
Lai TY, Ngai JWS, Chan WM, Lam DS. Visual field and multifocal electroretinography and their correlations in patients on hydroxychloroquine therapy. Doc Ophthalmol. 2006;112:177–187. | ||
Scherbel AL. Use of synthetic antimalarial drugs and other agents for rheumatoid arthritis: historic and therapeutic perspectives. Am J Med. 1983;75:1–4. | ||
Ehrenfeld M, Nesher R, Merin S. Delayed-onset chloroquine retinopathy. Br J Ophthalmol. 1986;70:281–283. |
 © 2014 The Author(s). This work is published and licensed by Dove Medical Press Limited. The
full terms of this license are available at https://www.dovepress.com/terms
and incorporate the Creative Commons Attribution
- Non Commercial (unported, 3.0) License.
By accessing the work you hereby accept the Terms. Non-commercial uses of the work are permitted
without any further permission from Dove Medical Press Limited, provided the work is properly
attributed. For permission for commercial use of this work, please see paragraphs 4.2 and 5 of our Terms.
© 2014 The Author(s). This work is published and licensed by Dove Medical Press Limited. The
full terms of this license are available at https://www.dovepress.com/terms
and incorporate the Creative Commons Attribution
- Non Commercial (unported, 3.0) License.
By accessing the work you hereby accept the Terms. Non-commercial uses of the work are permitted
without any further permission from Dove Medical Press Limited, provided the work is properly
attributed. For permission for commercial use of this work, please see paragraphs 4.2 and 5 of our Terms.