
Back to Journals » International Journal of General Medicine » Volume 18
Relative Fat Mass and Physical Indices as Predictors of Gallstone Formation: Insights From Machine Learning and Logistic Regression
Authors Deng L, Wang S, Wan D, Zhang Q, Shen W, Liu X, Zhang Y
Received 21 November 2024
Accepted for publication 23 January 2025
Published 31 January 2025 Volume 2025:18 Pages 509—527
DOI https://doi.org/10.2147/IJGM.S507013
Checked for plagiarism Yes
Review by Single anonymous peer review
Peer reviewer comments 2
Editor who approved publication: Dr Christian Selinger
Laifu Deng,1,* Shuting Wang,1,* Daiwei Wan,1,* Qi Zhang,2 Wei Shen,1 Xiao Liu,1,* Yu Zhang1,*
1Department of General Surgery, Wuxi Medical Center of Nanjing Medical University, Wuxi, People’s Republic of China; 2Department of Oncology, Tengzhou Central People’s Hospital, Jining Medical College, Shandong, People’s Republic of China
*These authors contributed equally to this work
Correspondence: Xiao Liu; Yu Zhang, Department of General Surgery, Wuxi Medical Center of Nanjing Medical University, Wuxi, People’s Republic of China, Tel +8613561164619 ; +8613793706777, Email [email protected]; [email protected]
Purpose: Gallstones (GS), a prevalent disorder of the biliary tract, markedly impair patients’ quality of life. This study aims to construct predictive models employing diverse machine learning algorithms to elucidate risk factors linked to gallstone formation.
Patients and Methods: This study integrated data from the National Health and Nutrition Examination Survey (NHANES) with a cohort of 7868 participants from Wuxi People’s Hospital and Wuxi Second People’s Hospital, including 830 individuals diagnosed with gallstones. To develop our predictive model, we employed four algorithms—Logistic Regression, Gaussian Naive Bayes (GNB), Multi-Layer Perceptron (MLP), and Support Vector Machine (SVM). The models were validated internally through k-fold cross-validation and externally using independent datasets. Furthermore, we substantiated the link between relative fat mass (RFM) and gallstone formation by employing four logistic regression models, conducting subgroup analyses, and applying restricted cubic spline (RCS) curves.
Results: The logistic regression algorithm demonstrated superior predictive capability for all risk factors associated with gallstone occurrence compared to other machine learning models. SHAP analysis identified RFM, weight-to-waist index (WWI), waist circumference (WC), waist-to-height ratio (WHtR), and body mass index (BMI) as prominent predictors of gallstone occurrence, with RFM emerging as the primary determinant. A fully adjusted multivariate logistic regression analysis revealed a robust positive association between RFM and gallstones. Subgroup analysis further indicated that subgroup factors did not alter the positive relationship between RFM and gallstone prevalence.
Conclusion: Among the four algorithmic models, logistic regression proved most effective in predicting gallstone occurrence. The model developed in this study offers clinicians a valuable tool for identifying critical prognostic factors, facilitating personalized patient monitoring and tailored management.
Keywords: gallstones, atherogenic index of plasma, national health and nutrition examination survey, cross-sectional studies, risk factor, machine learning
Introduction
With the accelerated advancement of society and profound shifts in contemporary lifestyles, the incidence of gallstones (GS) has surged annually, evolving into a pressing global health issue.1,2 Research indicates that over 20% of individuals with gallstones suffer from pronounced abdominal symptoms such as nausea, vomiting, and biliary colic, which severely disrupt daily life.3–5 Furthermore, some patients experience compromised immune function due to bile drainage obstruction and bacterial proliferation within the bile ducts, predisposing them to life-threatening complications including gangrenous cholecystitis, biliary infections, and gallbladder perforation. These conditions not only detrimentally affect patients’ quality of life but also impose substantial healthcare costs and long-term health risks. Numerous clinical interventions for gallstones are available, with surgical procedures remaining the cornerstone for definitive removal of gallbladder stones.6 Nevertheless, the absence of effective pharmacologic agents to prevent stone formation has left over 50% of patients vulnerable to recurrence post-surgery, thereby exacerbating the financial burden on patients and their families.7,8 In light of this, an increasing number of clinicians are progressively redirecting research efforts from gallstone treatment toward prevention, aiming to fundamentally reduce the incidence of this condition.
It is well established that unhealthy dietary habits, including the consumption of excessive refined carbohydrates, animal fats, and high-calorie foods, contribute to increased cholesterol saturation in bile, thereby elevating the risk of gallstone formation.9 Consequently, numerous researchers have undertaken comprehensive clinical studies examining the impact of dietary factors on gallstone development. For instance, Du’s research revealed a strong correlation between specific dietary patterns and gallstone risk,10 while Bin investigated the relationship between body mass index (BMI), waist circumference, and other physical parameters with gallstone formation.11 However, studies on the association between emerging physical assessment indicators, such as relative fat mass (RFM), and gallstones remain limited, warranting further exploration to establish a more robust scientific foundation for gallstone prevention and management.
RFM is an index that estimates body fat percentage using simple measurements, primarily height and waist circumference.12,13 Compared to the conventional BMI, RFM offers superior accuracy in reflecting body fat composition, as BMI fails to distinguish between muscle and fat mass, often leading to skewed results. RFM enables rapid assessment of an individual’s body fat status without the need for specialized equipment, thereby facilitating the evaluation of obesity-related health risks, such as hypertension, diabetes, gallstones, and other diseases.14,15 Although the application of RFM in gallstone research remains in an exploratory phase, it holds promise as a novel tool for gallstone prediction and prevention.
In recent years, artificial intelligence (AI) technology has witnessed rapid advancements in the medical field, progressively unveiling its immense potential in disease prediction, diagnostic assistance, and treatment optimization.16–18 Among the diverse branches of Artificial Intelligence, Machine Learning, as a pivotal subset, serves as a powerful tool for uncovering intricate patterns through advanced data analysis.19,20 Its remarkable ability to process vast, multidimensional datasets and discern hidden relationships often eluding traditional statistical methods positions it as a transformative approach in medical research. In disease risk prediction, ML leverages sophisticated algorithms to autonomously capture non-linear interdependencies among variables, thereby significantly enhancing predictive accuracy.21,22 By systematically evaluating the performance of various algorithms, our study endeavors to identify the most effective model, offering clinicians a precise and efficient screening tool to identify high-risk gallstone populations. This approach aims to enable timely interventions, optimize management strategies, and ultimately improve the prevention and treatment of gallstone-associated conditions. Nevertheless, ML’s inherent limitations, particularly its “black box” nature, can obscure the individual contributions of variables to the model’s predictions. To address this, we employed SHAP (Shapley Additive Explanations), a robust interpretative framework that quantifies the influence of each risk factor on gallstone occurrence, thereby enhancing the model’s transparency and providing a solid foundation for informed clinical decision-making.
Materials and Methods
Study Subjects
The National Health and Nutrition Examination Survey (NHANES), administered by the National Center for Health Statistics (NCHS), is a cross-sectional study that offers a representative sample of the US population. Its primary objective is to assess the health and nutritional status of individuals through household interviews and standardized physical examinations conducted at mobile screening sites. NHANES collects a wealth of data on participants’ demographic characteristics, dietary behaviors, physical assessments, questionnaire responses, and relevant health biomarkers obtained through laboratory analyses, making it an invaluable resource for gaining in-depth insights into public health and guiding clinical recommendations. The acquisition and dissemination of NHANES data were conducted in compliance with the Helsinki Declaration and received approval from the NCHS Ethics Committee, with all participants providing written informed consent.
Additionally, clinical data from gallstone patients at Wuxi People’s Hospital of Nanjing Medical University were employed for external validation of the model. The study received ethical approval from the Ethics Committees of Wuxi People’s Hospital and Wuxi Second People’s Hospital under approval number KY22086.
The participant selection criteria for this study involved the exclusion of individuals with incomplete data on gallstone status, pregnant women, and those lacking information on educational level, marital status, or medical comorbidities. Additionally, individuals with missing data on waist circumference, weight, height, or the first 24-hour meal, as well as those with incomplete records on other covariates such as physical measurements and laboratory test results, were also excluded.
Definition of GS
The determination of GS presence relied on participants’ self-reported responses to the question: “Have doctors or other healthcare professionals ever diagnosed you with gallstones?” An affirmative reply was considered indicative of the presence of gallstones. This method is both straightforward and user-friendly, and has been widely utilized in previous research studies.23,24
Calculation of the RFM, WHtR and WWI
Height and waist circumference (WC) were measured using standardized techniques and assessed by trained professionals at the Mobile Health Screening Centre, taking into account the participant’s gender for the calculation of the RFM. Participants were instructed to stand barefoot, in a natural upright posture, on a specialized height-measuring device, wearing only light clothing. Weight was recorded at the mid-axillary line, just above the iliac crest, at the end of normal exhalation, with measurements precise to within 0.1 cm. Height and abdominal circumference were documented in centimeters. The RFM was calculated using the formula: 64 − (20 × height/WC) + (12 × sex), where sex is coded as 1 for female and 0 for male. The Waist-to-Height Ratio (WHtR) was obtained by dividing WC (in centimeters) by height. The formula for calculating the Weight-to-Waist Index (WWI) is as follows: WWI = Waist circumference (cm) / √weight (kg).
Ascertainment of Covariates
To enhance the precision and comprehensiveness of the analysis, the covariates selected for consideration were determined based on clinical expertise and previous research. The primary demographic covariates included in this study were age, gender, race, educational level, and marital status. Marital status was categorized as married or cohabiting, divorced, widowed, separated, or never married. Indicators from physical examinations, laboratory tests, and dietary nutrient intake—particularly carbohydrate, protein, fiber, total fat, and water—were also identified as significant potential confounders. Furthermore, information on lifestyle habits and a history of medical comorbidities, including hypertension, coronary heart disease, liver disease, and cancer, was collected. Data on medical comorbidities were obtained through questionnaires or confirmed clinical diagnoses. Lifestyle habits were primarily characterized by smoking status (never smoker, former smoker, or current smoker) and alcohol consumption. Participants were classified as alcohol drinkers if they reported consuming at least 12 alcoholic beverages per year or had an alcohol intake exceeding 0 grams during a 24-hour dietary recall.
Research Design
(1) Data Preprocessing: Gallstone patients from the NHANES database, spanning January 2017 to March 2020, were designated as the internal validation set, while gallstone patients from Wuxi People’s Hospital during the same period served as the external validation set. In this study, we employed a random sampling method to partition the internal validation set into two subsets: the training set (comprising 70% of the total data) and the test set (comprising 30%). This stratified division aims to construct a predictive model from the training set and assess its performance using the test set. To ensure the reproducibility of the dataset division, we introduced a “random seed” (random_state=42), which provides a fixed starting point for each random partition. By setting the same random seed, we mitigate the variability introduced by random processes, ensuring consistency in dataset partitioning across all experimental iterations. (2) Feature Selection and Importance Scoring: The data from the internal validation set were subjected to univariate analysis to assess the significance of individual variables, followed by feature importance scoring to identify variables of meaningful relevance. Four models—Logistic Regression, Gaussian Naive Bayes (GNB), Multi-Layer Perceptron (MLP), and Support Vector Machine (SVM)—were employed to assess the importance of each independent factor and rank them according to their respective weights. The top ten variables from each model’s ranking were selected for further analysis. Logistic Regression, a foundational linear model, estimates feature weights to predict outcomes, with the absolute values of these weights reflecting the relative significance of each feature. Support Vector Machine (SVM), renowned for its robust performance in supervised learning, excels in both classification and regression tasks. Its strength lies in its exceptional generalization capability and adaptability to high-dimensional datasets, particularly when sample sizes are modest yet feature dimensions are high. Gaussian Naive Bayes (GNB), a probabilistic algorithm grounded in Bayes’ theorem, is celebrated for its computational efficiency and simplicity. Despite its reliance on limited data, GNB delivers reliable performance, making it an ideal choice for applications demanding swift processing and high interpretability. Multi-Layer Perceptron (MLP), a seminal feed-forward artificial neural network, effectively captures nonlinear patterns in data and is extensively applied to classification, regression, and predictive modeling. To mitigate overfitting and ensure optimal performance, MLP typically necessitates substantial data and computational resources. (3) Building and Evaluating Predictive Models: The selected feature variables were incorporated into four models: Logistic Regression, GNB, MLP, and SVM. To evaluate the model performance, we used a K-fold cross-validation method and an external validation approach. K-fold cross-validation, a widely recognized method for its simplicity and ability to minimize bias, is particularly suited for model comparison and selection. The core concept of K-fold cross-validation involves partitioning the original dataset into K subsets, using one as the test set while the remaining K-1 subsets form the training set. This approach ensures efficient data utilization and enhances the reliability of model evaluation. To optimize the performance of the four models, we utilized grid search to fine-tune the hyperparameters. We then conducted K-fold cross-validation (with K=10) using the resampling method to determine the optimal parameters for each model. The implementation steps were as follows: initially, the original dataset was randomly partitioned into 10 non-overlapping groups. In each iteration, one group was designated as the test set, while the remaining nine groups were utilized for training. After fitting the model to the training set and optimizing its parameters, the model’s performance was evaluated using the test set. This process was repeated K times, ensuring that each group was used once as the test set. The evaluation metrics—area under the curve (AUC), accuracy, sensitivity, and specificity—were collected after each iteration. The average of these metrics provides the most accurate estimate of the model’s predictive performance. Moreover, the models were assessed across three dimensions—discrimination, calibration, and clinical utility—allowing for the selection of the most effective model for predictive analysis. ROC curves were plotted to compute the AUC values, thereby assessing the predictive efficacy of the models. Calibration curves were generated to evaluate the agreement between the predicted and actual outcomes. Decision Curve Analysis (DCA) was employed to determine whether model-based decisions would benefit patients. The calibration curve visually illustrates the deviation between predicted and actual results by grouping predictions and calculating the relationship between the mean of actual and predicted values for each group. In the DCA, the intersection of the red curve with the “All” curve marks the starting point, while the intersection with the “None” curve identifies the node, indicating the patient range that benefits from the model’s predictions. The best-performing model was externally validated using an independent external validation set, with ROC plots generated to assess the model’s generalizability and predictive efficacy. (4) Model Interpretation: The contribution of each feature to the model’s prediction, quantified through Shapley values, was analyzed using SHAP (Shapley Additive Explanations). Additionally, a SHAP summary plot was constructed based on these values to rank the relative importance of each risk factor. (5) Comprehensive Analysis of RFM and GS: To thoroughly explore the relationship between RFM and GS, both univariate and multivariate logistic regression analyses were performed to develop four distinct models. Model 1 was a basic unadjusted univariate model. In Model 2, demographic factors—such as gender, age, and ethnicity—were incorporated as adjustments. Model 3 expanded upon Model 2 by including additional covariates, such as education level, marital status, and medical comorbidity history. Finally, Model 4 was a fully adjusted, comprehensive model, which incorporated lifestyle habits (eg, smoking and alcohol consumption) and dietary nutrient intake as additional covariates. (6) Evaluation of Variations Based on RFM Quartiles: To bolster the reliability and validity of this study, variations among participants stratified by RFM quartiles were assessed using multifactorial logistic regression analysis, with the first quartile (Q1) serving as the reference group. As part of sensitivity analysis, subgroup analysis was conducted to explore potential variations in the relationship between RFM and GS within specific populations. Additionally, the dose-response association between RFM and GS was thoroughly examined through the application of the restricted cubic spline (RCS) method, determining whether the relationship was linear or non-linear.
Statistical Analysis
Depending on the distribution of the data, baseline characteristics of continuous variables are presented either parametrically (mean ± standard deviation) or non-parametrically (median), while categorical variables are expressed in terms of their absolute values (n) and percentages (%). To mitigate collinearity, multicollinearity between covariates was assessed using the variance inflation factor (VIF) and tolerance. Cointegration was considered present when the VIF exceeded 5.25 Notably, the VIF values for all covariates included in the four logistic regression models of this study were below 5cal analyses were conducted using SPSS, R, and Python software.
Results
Basic Clinical Information of the Patient
A total of 7868 participants were included in the study, among which 830 (10.55%) had gallstones. Of these, 771 (10.56%) patients with gallstones were in the internal validation set, and 59 (10.39%) patients were included in the external validation set (Figure 1). Table 1 compares the clinical attributes of the subjects, stratified by gallstone status. The median age of the participants was 52 years, with 49.81% males and 50.19% females. Regarding medical history, 44.32% of the total cohort had hypertension, 5.78% had coronary artery disease, and 18.66% were diabetic. The prevalence of gallstones was higher among females, the elderly, and non-Hispanic whites compared to the general population. Notably, the median BMI, WC, WHtR, WWI, and RFM were all higher in patients with gallstones than in those without (all P values were less than 0.01). Table 2 illustrates the baseline feature differences between the internal and external validation sets, while Table S1 provides the original data used in the study.
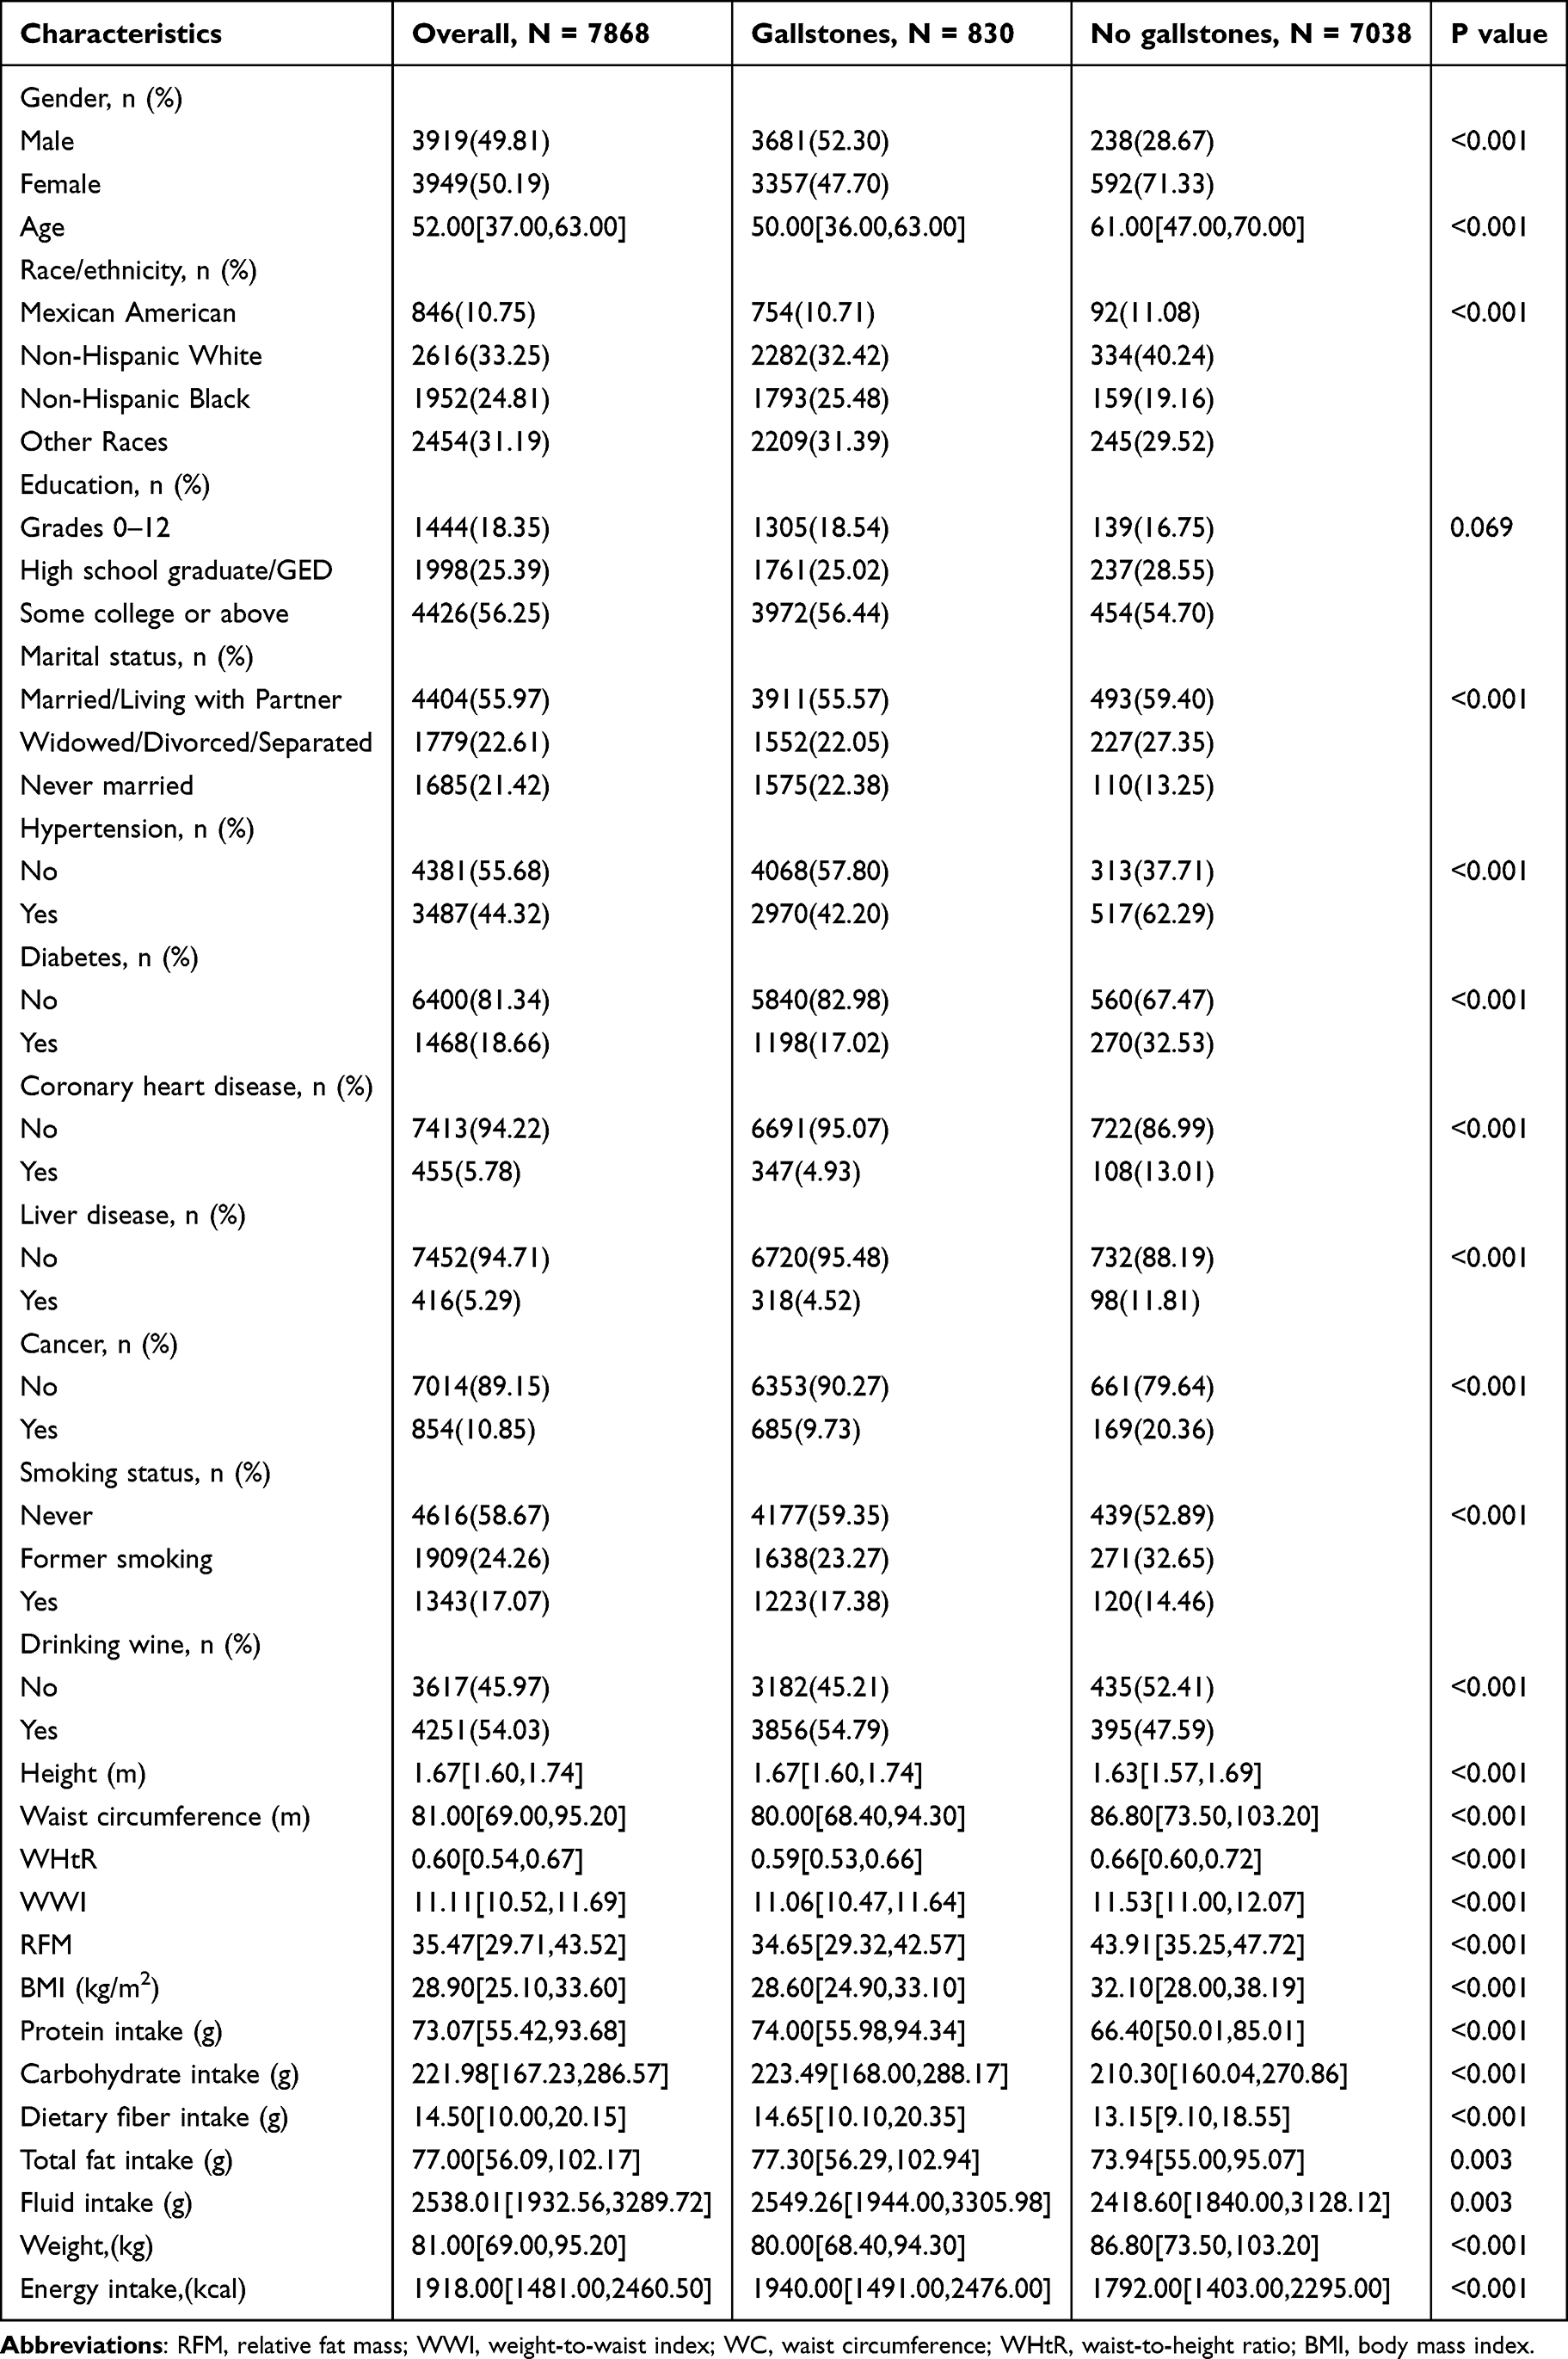 |
Table 1 Baseline Characteristics of the Gallstones Group Versus the Non-Gallstones Group |
 |
Table 2 Baseline Characteristics of the Internal Validation Sets Versus the External Validation Sets |
 |
Figure 1 Model-making process and flowchart of the study. |
Screening for Risk Factors for Gallstones
The results of the univariate analysis revealed that gender, age, marital status, hypertension, diabetes, BMI, WC, RFM, WHtR, and WWI were significant influencing factors for the occurrence of gallstones (P<0.05) (Table 1). Logistic regression, GNB, MLP, and SVM models were employed to screen for risk factors associated with the occurrence of gallstones, with the variables BMI, WC, RFM, WHtR, and WWI identified as key predictors (Figure 2A–E). The final predictive model incorporated these five variables: BMI, WC, RFM, WHtR, and WWI.
 |
Figure 2 The variable influence factor ranking plots of the four models. (A) Variable importance ranking diagram of the logistic regression model. (B) Variable importance ranking diagram of the GNB model. (C) Variable importance ranking diagram of the MLP model. (D) Variable importance ranking diagram of the SVM model. (E) Venn diagrams depicting genes identified through logistic regression, GNB, MLP, and SVM algorithms. |
Evaluation and Comparison of Models of High-Risk Factors for the Occurrence of Gallstones
The results of the ROC curve analysis demonstrated that the logistic regression model exhibited the best performance among the four models. In the training set, the logistic regression model achieved an AUC of 0.699, and in the validation set, it improved to 0.727, marking the highest performance across the models (Table 3). Calibration curves for all four models closely matched the ideal curves, indicating a high degree of consistency between predicted and actual outcomes. DCA confirmed that all four models provided a net clinical benefit relative to both all-treatment and no-treatment strategies (Figure 3A–D). In the k-fold cross-validation process, the models were evaluated on a test set consisting of 5110 cases (70% of the total), with the remaining samples used for training. The logistic regression model achieved an AUC of 0.6947±0.0537 in the validation set and 0.7057 in the test set, with an accuracy of 0.6141. The GNB model showed an AUC of 0.6810±0.0609 in the validation set and 0.6947 in the test set, with an accuracy of 0.5763. The MLP model had an AUC of 0.6401±0.0663 in the validation set and 0.6611 in the test set, with an accuracy of 0.5939. The KNN model exhibited an AUC of 0.5898±0.0741 in the validation set and 0.5548 in the test set, with an accuracy of 0.5432. After a comprehensive comparison, the logistic regression model was selected as the final model for this study. To assess the generalizability of the model, the ROC curve was generated for the external validation set, where the model demonstrated a robust AUC value of 0.71, indicating high accuracy in disease prediction (Figure 4A–D). Additionally, SHAP analysis was employed to interpret the output of the machine learning model. This method measures the contribution of each feature to the model’s predicted value by calculating the Shapley value, which represents the marginal contribution of each feature across various combinations. Using the Shapley values, we constructed summary plots to visualize the global impact of features on predictions. In these plots, the horizontal axis indicates the magnitude of each feature’s contribution to the predicted value, while the color represents the value of the feature itself. The analysis revealed that the primary risk factors for gallstone occurrence, ranked by their impact, were RFM, WWI, WC, WHtR, and BMI (Figure 5).
 |
Table 3 Evaluation of the Performance of the Four Models |
 |
Figure 3 Evaluation of the four models for predicting recurrence of gastric cancer. (A) ROC curves for the training set of the four models. (B) ROC curves for the validation set of the four models. (C) Calibration plots of the four models. The 45° dotted line on each graph represents the perfect match between the observed (y-axis) and predicted (x-axis) complication probabilities. A closer distance between two curves indicates greater accuracy. (D) DCA curves of the four models. The intersection of the red curve and the All curve is the starting point, and the intersection of the red curve and the None curve is the node within which the corresponding patients can benefit. |
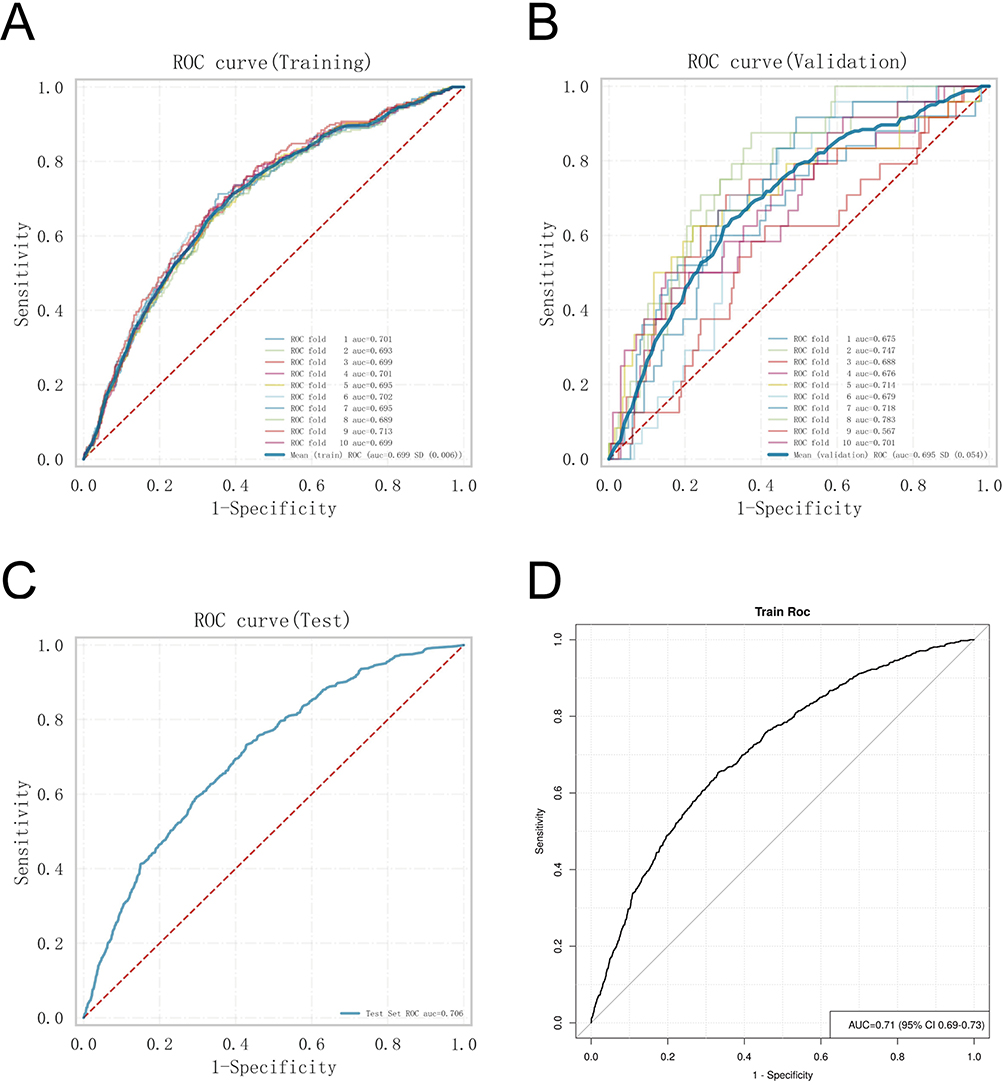 |
Figure 4 Internal validation of the logistic regression model. (A) ROC curve of the logistic regression model for the training set. (B) ROC curve of the logistic regression model for the validation set. (C) ROC curve of the logistic regression model for the test set. (D) External validation of the logistic regression model. |
 |
Figure 5 SHAP summary plot. Risk factors are arranged along the y-axis based on their importance, which is given by the mean of their absolute Shapley values. The higher the risk factor is positioned in the plot, the more important it is for the model. |
Correlation Between Risk Factors and Gallstone Occurrence Under Four Logistic Regression Models
Table 4 presents the results of four logistic regression models, each adjusted to include progressively more confounding variables. Model 1, based on univariate analysis, demonstrated a statistically significant association between elevated RFM levels and the increased prevalence of gallstones (GS) (OR = 1.09; 95% CI: 1.08–1.10). In Model 2, which adjusted for key demographic factors such as sex, age, and race, the association between RFM and GS became even more pronounced (OR = 1.11; 95% CI: 1.09–1.13). Notably, in Model 4, which accounted for all potential confounders, the positive correlation remained stable, indicating that for each 1-unit increase in RFM, the prevalence of GS increased by 9%. Sensitivity analyses, using RFM as a categorical variable (quartiles), further corroborated these findings. In Model 4, after adjusting for all covariates, individuals in the third and fourth quartiles of RFM exhibited a 86% and 309% higher prevalence of GS, respectively, compared to those in the lowest quartile of RFM (both P < 0.01), with a significant trend across all quartiles (P for trend < 0.01).
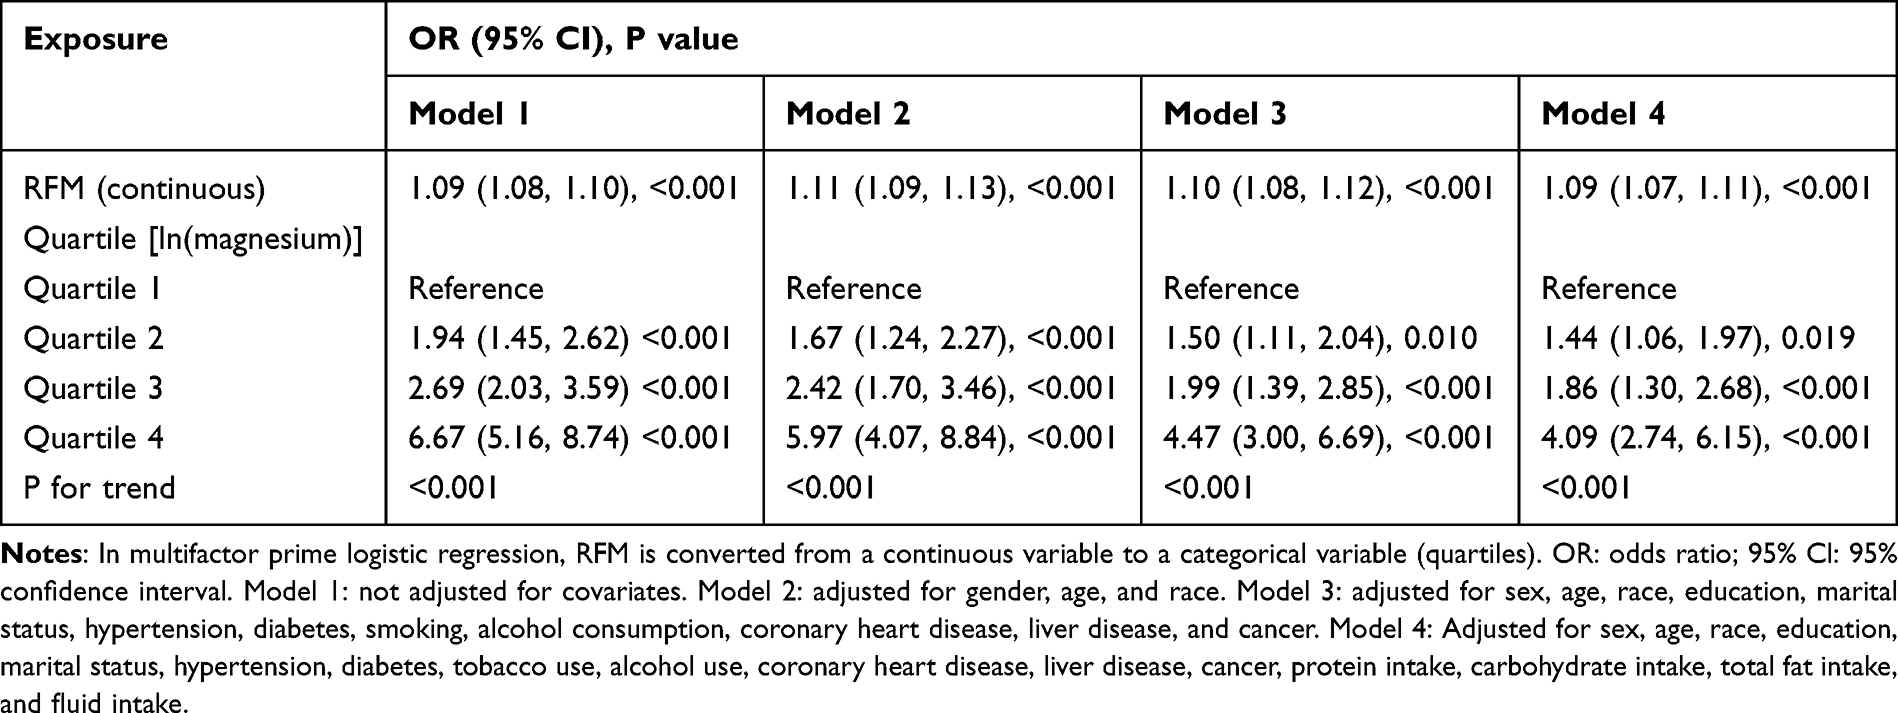 |
Table 4 Odds Ratios and 95% Confidence Intervals for GS According to RFM |
Subgroup Analysis
To evaluate whether the associations between RFM, WC, BMI, WHtR, WWI, and GS varied across different subgroups, we conducted subgroup analyses and interaction tests (Figures 6 and S1-S4). Notably, individuals under 60 years of age, women, and those with tertiary or higher education levels exhibited an increased risk of GS when they had high RFM values (all P-values < 0.05). However, the results from the interaction test revealed an “interaction P” > 0.05, suggesting that these subgroup factors did not significantly influence the positive association between RFM and the prevalence of GS.
 |
Figure 6 Subgroup analyses and interaction tests of the relationship between RFM and GS. Notes: Adjusted for all covariates except effect modifier. |
RCS Curve Fitting for RFM and Prevalence of GS
The multivariate-adjusted RCS smoothing curve provides an intuitive representation of the flexible relationship between changes in RFM, WC, BMI, WHtR, WWI, and GS prevalence (Figure 7A–E). After adjusting for all confounding variables, the curves illustrate either linear or nonlinear positive correlations. To further explore the nonlinear relationship, we employed the Akaike Information Criterion (AIC) method to determine the optimal number of nodes and identify the inflection point of the curve, minimizing the risk of overfitting. The results revealed a significant nonlinear positive correlation between RFM and GS (P-nonlinear < 0.01).
 |
Figure 7 RCS curve fitting between Indicators and GS. (A) RCS curve fitting between RFM and GS. (B) RCS curve fitting between WC and GS. (C) RCS curve fitting between BMI and GS. (D) RCS curve fitting between WHtR and GS. (E) RCS curve fitting between WWI and GS. |
Discussion
In this study, four algorithms were employed to construct a predictive model for gallstone risk factors. Gaussian Naive Bayes (GNB), known for its explicit independence assumptions on data distributions, offers computational simplicity and speed, enabling efficient training and prediction across large datasets. GNB excels at handling discrete features, allowing rapid estimation of probability distributions for diverse feature types.26,27 In contrast, multilayer perceptrons (MLPs) capture complex nonlinear relationships through multiple neuron layers, making them adept at managing intricate structural features. By adjusting layer and node counts, MLPs can be tailored to various data patterns, theoretically approximating any function to an infinite degree of precision.28 Support Vector Machines (SVMs), similarly proficient with complex datasets, perform particularly well in high-dimensional spaces. Through kernel functions, SVMs effectively capture nonlinear relationships, identify decision boundaries with maximal margins, and enhance the model’s generalization capability.29,30 Conversely, logistic regression, a linear model, aptly fits linear relationships within the data and efficiently finds optimal solutions when variables are nearly linearly correlated with gallstone risk. Furthermore, logistic regression provides regression coefficients for each variable, facilitating the interpretation of each variable’s effect on gallstone risk—an advantage especially valuable in studies focused on understanding the contribution of individual characteristics.
The study results revealed that logistic regression achieved AUCs of 0.699 and 0.727 in the training and validation sets, respectively, surpassing the other models and underscoring its robust discriminative capacity for predicting gallstone risk. Moreover, logistic regression demonstrated minimal AUC fluctuation across 10-fold cross-validation (AUC=0.6947±0.0537 in the validation set), signifying superior generalization and applicability to novel datasets. In this study, we observed that the SVM and MLP models exhibited relatively weaker performance. We attribute this to several factors. Firstly, SVM and MLP models are prone to overfitting, particularly in high-dimensional data with a relatively small sample size. To mitigate this risk, we employed regularization techniques such as L2 regularization for the SVM and early stopping for the MLP model to limit the model’s complexity. However, in certain cases, overfitting still impacted the model’s generalization ability, leading to suboptimal performance on the validation and test sets. Secondly, the performance of both the SVM and MLP models is highly sensitive to hyperparameter settings. In our study, we employed grid search for hyperparameter tuning; however, due to computational resource limitations, we may not have fully explored the entire hyperparameter space. The selection of hyperparameters is crucial to the performance of these models, and future studies could further refine these settings to enhance model performance.31–33 Furthermore, MLP and SVM are more sensitive to sample size and feature dimensions, typically requiring larger datasets to effectively capture intricate patterns, while logistic regression remains stable even with limited samples.34,35 Overall, the logistic regression model not only demonstrates high concordance between predicted and observed outcomes but also offers outstanding interpretability, enabling clinicians to readily grasp the influence of each variable on gallstone risk—a quality of immense value in clinical practice. Thus, logistic regression was selected as the predictive model for gallstone risk factors in this study.
Gallstone formation is influenced by numerous factors, encompassing physiological, lifestyle, and pathological elements.36,37 Regarding dietary factors, high-fat and high-cholesterol diets significantly elevate cholesterol saturation within bile, emerging as primary contributors to gallstone formation.3,38 Intake of saturated fats and cholesterol directly impacts systemic cholesterol levels; as cholesterol concentrations rise, surplus cholesterol is transported to the liver and subsequently secreted into bile. Under normal conditions, bile salts and lecithin facilitate the maintenance of cholesterol solubility within bile. However, when cholesterol levels escalate beyond a critical threshold, the cholesterol in bile reaches or exceeds its saturation point, preventing complete dissolution. This oversaturation predisposes cholesterol to crystallize within the gallbladder, a process that gradually leads to gallstone development.24 The present study employed SHAP analysis to visualize and interpret the model, revealing that the RFM emerged as the most significant predictor of gallstone occurrence. As an indicator of body fat content, RFM reflects the presence of excessive body fat, particularly abdominal fat. An increase in body fat, especially the accumulation of visceral fat, leads to elevated cholesterol levels. The hormones and metabolites secreted by adipocytes directly influence cholesterol synthesis and secretion in the liver, the central organ in cholesterol metabolism. When excess body fat is present, the liver produces more cholesterol, contributing to its oversaturation in bile. Furthermore, adipose tissue, not only serving as an energy reservoir, secretes various bioactive substances, such as leptin and lipocalin, which play crucial roles in lipid and glucose metabolism. Elevated body fat levels often coincide with metabolic disruptions, manifesting as increased low-density lipoprotein (LDL) and decreased high-density lipoprotein (HDL) levels. LDL facilitates the transport of cholesterol to peripheral tissues, including the gallbladder, while HDL assists in the removal of excess cholesterol. As HDL levels decline, the capacity to remove excess cholesterol is impaired, leading to a further increase in cholesterol concentrations within bile. Additionally, individuals with elevated RFM possess a greater number of adipocytes, which secrete higher amounts of inflammatory cytokines, such as tumor necrosis factor-α and interleukin-6, thereby inducing a state of low-grade chronic inflammation.39–41 This persistent inflammation disrupts cholesterol metabolism, resulting in aberrant cholesterol distribution and transport, as well as sustained interference with hepatic function. The chronic inflammatory milieu may alter bile composition, slowing its flow and causing prolonged retention within the gallbladder. Such bile stagnation creates an environment conducive to the formation of cholesterol crystals, thereby elevating the risk of gallstone formation.
Among the factors that predispose individuals to gallstones, metabolic diseases, particularly diabetes, exert a profound influence on gallstone formation.42 RFM values provide a more accurate reflection of body fat percentage by integrating measures such as waist circumference and height through specific mathematical formulas. Elevated RFM values are frequently linked to insulin resistance and metabolic syndrome.43,44 Insulin resistance refers to a reduced sensitivity of the body’s cells to insulin, impairing its ability to facilitate glucose uptake, thereby leading to elevated blood glucose levels. As insulin resistance intensifies, the pancreas compensates by secreting more insulin to maintain stable glucose levels. However, this compensatory response often fails over time, culminating in hyperinsulinemia, which further disrupts metabolic equilibrium.
The development of insulin resistance is intricately linked to adipose tissue dysfunction.45–47 Elevated insulin levels stimulate hepatic cholesterol synthesis, resulting in an increased accumulation of cholesterol in bile. Moreover, insulin resistance disrupts adipose tissue metabolism, leading to heightened release of free fatty acids. Upon entering the liver, these free fatty acids are converted to triacylglycerols, thereby exacerbating cholesterol production and further taxing cholesterol metabolism. In individuals with high RFM values, disruptions in adipose tissue metabolism lead to the release of more free fatty acids, which enter the bloodstream and are transported to the liver, amplifying the liver’s fat burden and contributing to the onset of non-alcoholic fatty liver disease (NAFLD). The accumulation of fat within the liver reduces the sensitivity of hepatic cells to insulin, thereby worsening insulin resistance. Additionally, pro-inflammatory cytokines secreted by adipose tissue directly impair the insulin signaling pathway, further attenuating insulin’s effectiveness. Consequently, a vicious cycle ensues between insulin resistance and high RFM values, with both factors collectively destabilizing glycemic control and enhancing the risk of gallstone formation.
Over the long term, individuals with elevated RFM values not only face an increased risk of biliary diseases, such as gallstones, but also experience a detrimental impact on both quality of life and life expectancy.48,49 The heightened cholesterol and fat accumulation associated with high RFM values substantially raises the risk of cardiovascular disease, diabetes, and kidney disease—conditions that are often chronic, progressive, and difficult to fully treat. Furthermore, obesity has been linked to an elevated risk of certain cancers, including colorectal and breast cancer, potentially due to the pro-inflammatory properties of adipose tissue and hormonal imbalances.50 High RFM values also impose strain on the musculoskeletal system, contributing to disorders such as osteoarthritis and muscle fatigue, which further impair mobility and perpetuate a cycle of declining quality of life. Moreover, metabolic syndrome and insulin resistance themselves may drive the onset and accelerate the progression of chronic diseases. Therefore, individuals with elevated RFM values should proactively engage in lifestyle interventions aimed at improving body fat composition, thereby preventing or delaying the onset and progression of metabolic diseases.
The present study constructs models based on multiple machine learning algorithms, effectively addressing the practical needs of clinical decision-making while significantly enhancing the accuracy of disease prediction. Gallstones, along with other biliary tract diseases, have progressively become a significant public health challenge globally, imposing a substantial burden on healthcare systems across nations. The rising incidence of these conditions not only compromises patients’ quality of life but also escalates the consumption of healthcare resources. In this context, the predictive model developed in this study holds considerable clinical value. By leveraging advanced machine learning algorithms, this research successfully establishes a model capable of identifying patients at high risk for gallstones, without relying on traditional imaging techniques (eg, abdominal ultrasound or enhanced CT scans). This innovation reduces the reliance on costly imaging methods, thereby substantially lowering hospital healthcare expenses. Moreover, the model’s ability to promptly identify high-risk patients provides clinicians with a reliable foundation for more detailed monitoring and the formulation of personalized treatment plans. This not only enhances the efficiency of patient management but also fosters conditions for improved patient outcomes. With this tailored approach, patients are poised to receive timely interventions, consequently reducing the risk of complications associated with gallstones.
Our GS risk prediction model offers versatile applications across various stages of clinical management, encompassing preoperative decision-making, intraoperative guidance, and postoperative monitoring, tailored to the demands of the clinical context. During the physical examination or initial outpatient screening, the model facilitates the identification of high-risk individuals, prompting recommendations for advanced imaging modalities such as ultrasound. At the preoperative risk assessment stage, the model aids in evaluating gallstone risk while planning procedures like laparoscopic cholecystectomy or related surgeries. For high-risk patients, detailed surgical strategies can be formulated in advance, including preoperative optimization of anticoagulant therapy or metabolic management. For asymptomatic patients diagnosed with gallstones, the model predicts the likelihood of recurrence or complications, guiding clinicians in deciding whether preventive surgical intervention is warranted. Furthermore, for patients with obesity and elevated RFM, the model informs preoperative optimization strategies, such as intensive nutritional counseling or targeted weight management. In the intraoperative phase, the model empowers surgeons to adjust their approach for high-risk patients, including expanding the surgical scope or increasing the frequency of biliary exploration and choledochoscopy, thereby minimizing the risk of residual stones postoperatively. Postoperatively, the model enables the design of personalized surveillance protocols, incorporating routine imaging and biochemical marker monitoring for patients at heightened risk of stone recurrence or bile duct stones following cholecystectomy. For specific high-risk populations, such as those with elevated WWI and RFM, the model advocates for targeted postoperative interventions, including dietary adjustments to increase fiber intake, along with tailored exercise regimens to mitigate recurrence risks effectively.
Limitations
This study has its limitations. While an extensive array of potential risk factors was examined, unmeasured variables with significant influence on gallstone development and progression may have been overlooked, introducing potential bias to the findings. Furthermore, the external validation relied on data from a single center with a relatively limited sample size, raising concerns regarding distributional bias. Future validations incorporating larger, more heterogeneous datasets—encompassing patients of varied ethnic backgrounds and healthcare systems—would enable a more thorough evaluation of the model’s generalizability and mitigate the risk of overfitting.Future studies will address these limitations by employing repeated sampling techniques such as bootstrapping to rigorously assess the stability of the model’s predictive performance. Despite the strong performance of the machine learning algorithms employed, logistic regression emerged as the most effective model, likely reflecting the primarily linear relationships within the dataset. To unlock the full potential of machine learning models, future research will leverage larger, more diverse datasets characterized by higher dimensionality and intricate nonlinear relationships, thereby providing a more conducive environment for advanced algorithms to demonstrate their advantages. Conversely, this study incorporated self-reported data, including gallstone diagnoses, and we fully acknowledge the inherent challenges such as recall bias and misclassification stemming from the subjectivity of respondents. Future research will aim to integrate imaging or surgical confirmation data to enhance the model’s accuracy and generalizability. Additionally, sensitivity analyses will be conducted to quantitatively assess the potential influence of self-reported data on model performance.
Conclusion
By developing a machine learning-based prediction model for gallstones, this study underscores the critical roles of BMI, WC, WHtR, WWI, and RFM in forecasting the onset and progression of gallstones. This approach not only enhances the accuracy of disease prediction and reduces healthcare costs but also provides a solid scientific foundation for clinical practice, advancing the development of personalized treatment strategies. The model holds significant potential for broad applications and clinical impact, with far-reaching benefits for patient care.
Data Sharing Statement
The original data presented in the study are included in the Raw Data/Table S1, and further inquiries can be directed to the corresponding author ([email protected]).
Ethics Statement
This study was conducted in accordance with the Declaration of Helsinki and was approved by the Ethics Committee of Wuxi People’s Hospital, with approval number KY22086. The review committee waived the requirement for written informed consent because of the retrospective nature of the study. Prior to analysis, confidential patient information was deleted from the entire data set.
Funding
This work was supported by the Nanjing Medical University Wuxi Medical Center Normal Project (WXKY202304050) and the Wuxi Double Hundred Top Talents Program (BJ20232012).
Disclosure
The authors report no conflicts of interest in this work.
References
1. Mulliri A, Menahem B, Alves A, Dupont B. Ursodeoxycholic acid for the prevention of gallstones and subsequent cholecystectomy after bariatric surgery: a meta-analysis of randomized controlled trials. J Gastroenterol. 2022;57(8):529–539. doi:10.1007/s00535-022-01886-4
2. Johna S. Gallstones and bariatric surgery: to treat or not to treat? World J Surg. 2016;40(12):2911–2912. doi:10.1007/s00268-016-3672-1
3. Colvin HS, Kimura T, Iso H, Ikehara S, Sawada N, Tsugane S. Risk factors for gallstones and cholecystectomy: a large-scale population-based prospective cohort study in Japan. Dig Dis. 2022;40(3):385–393. doi:10.1159/000517270
4. Ricci C, Pagano N, Taffurelli G, et al. Comparison of efficacy and safety of 4 combinations of laparoscopic and intraoperative techniques for management of gallstone disease with biliary duct calculi: a systematic review and network meta-analysis. JAMA Surg. 2018;153(7):e181167. doi:10.1001/jamasurg.2018.1167
5. Sharma A, Shanti H, Nageswaran H, Best LMJ, Patel AG. Role of ursodeoxycholic acid in the prevention of gallstones formation in bariatric patients-a systematic review and meta-analysis of randomised trials. Obes Surg. 2023;33(12):4115–4124. doi:10.1007/s11695-023-06893-9
6. Xia C, Wang M, Lv H, et al. The safety and necessity of concomitant cholecystectomy during bariatric surgery in patients with obesity: a systematic review and meta-analysis. Obes Surg. 2021;31(12):5418–5426. doi:10.1007/s11695-021-05713-2
7. Portincasa P, Di Ciaula A, de Bari O, Garruti G, Palmieri VO, Wang DQ. Management of gallstones and its related complications. Expert Rev Gastroenterol Hepatol. 2016;10(1):93–112. doi:10.1586/17474124.2016.1109445
8. Muñoz Abraham AS, Osei H, Bajinting A, et al. Index admission cholecystectomy and recurrence of pediatric gallstone pancreatitis: multicenter cohort analysis. J Am Coll Surg. 2022;234(3):352–358. doi:10.1097/XCS.0000000000000062
9. Li H, Zhang C. Association between triglyceride-glucose index and gallstones: a cross-sectional study. Sci Rep. 2024;14(1):17778. doi:10.1038/s41598-024-68841-6
10. Du W, Yan C, Wang Y, et al. Association between dietary magnesium intake and gallstones: the mediating role of atherogenic index of plasma. Lipids Health Dis. 2024;23(1):82. doi:10.1186/s12944-024-02074-4
11. Ke B, Sun Y, Dai X, Gui Y, Chen S. Relationship between weight-adjusted waist circumference index and prevalence of gallstones in U.S. adults: a study based on the NHANES 2017-2020. Front Endocrinol. 2023;14:1276465. doi:10.3389/fendo.2023.1276465
12. Lee DH, Keum N, Hu FB, et al. Predicted lean body mass, fat mass, and all cause and cause specific mortality in men: prospective US cohort study. BMJ. 2018;362(k2575). doi:10.1136/bmj.k2575.
13. Kim SH, Moon JY, Sasano H, Choi MH, Park MJ. Body fat mass is associated with ratio of steroid metabolites reflecting 17,20-lyase activity in prepubertal girls. J Clin Endocrinol Metab. 2016;101(12):4653–4660. doi:10.1210/jc.2016-2515
14. Wang D, Chen Z, Wu Y, et al. Association between two novel anthropometric measures and type 2 diabetes in a Chinese population. Diabetes Obes Metab. 2024;26(8):3238–3247. doi:10.1111/dom.15651
15. Lokpo SY, Ametefe CY, Osei-Yeboah J, et al. Performance of body adiposity index and relative fat mass in predicting bioelectric impedance analysis-derived body fat percentage: a cross-sectional study among patients with type 2 diabetes in the Ho Municipality, Ghana. Biomed Res Int. 2023;2023(1):1500905. doi:10.1155/2023/1500905
16. Trebeschi S, Drago SG, Birkbak NJ, et al. Predicting response to cancer immunotherapy using noninvasive radiomic biomarkers. Ann Oncol. 2019;30(6):998–1004. doi:10.1093/annonc/mdz108
17. Yang S, Kar S. Applicability Domain for Trustable Predictions. Methods mol Biol. 2025;2834:131–149.
18. Ravindranath R, Stein JD, Hernandez-Boussard T, Fisher AC, Wang SY. The Impact of Race, Ethnicity, and Sex on Fairness in Artificial Intelligence for Glaucoma Prediction Models. Ophthalmol Sci. 2025;5(1):100596. doi:10.1016/j.xops.2024.100596
19. Silva GFS, Fagundes TP, Teixeira BC, Chiavegatto Filho ADP. Machine Learning for Hypertension Prediction: a Systematic Review. Curr Hypertens Rep. 2022;24(11):523–533. doi:10.1007/s11906-022-01212-6
20. Dong J, Feng T, Thapa-Chhetry B, et al. Machine learning model for early prediction of acute kidney injury (AKI) in pediatric critical care. Crit Care. 2021;25(1):288. doi:10.1186/s13054-021-03724-0
21. Lee YW, Choi JW, Shin EH. Machine learning model for predicting malaria using clinical information. Comput Biol Med. 2021;129:104151. doi:10.1016/j.compbiomed.2020.104151
22. Heo J, Yoon JG, Park H, Kim YD, Nam HS, Heo JH. Machine learning-based model for prediction of outcomes in acute stroke. Stroke. 2019;50(5):1263–1265. doi:10.1161/STROKEAHA.118.024293
23. Cheng J, Zhuang Q, Wang W, et al. Association of pro-inflammatory diet with increased risk of gallstone disease: a cross-sectional study of NHANES January 2017-March 2020. Front Nutr. 2024;11:1344699. doi:10.3389/fnut.2024.1344699
24. Wen SH, Tang X, Tang T, Ye ZR. Association between weight-adjusted-waist index and gallstones: an analysis of the National Health and Nutrition Examination Survey. BMC Gastroenterol. 2024;24(1):40. doi:10.1186/s12876-024-03127-9
25. Liu M, Zhang Z, Zhou C, et al. Predicted fat mass and lean mass in relation to all-cause and cause-specific mortality. J Cachexia, Sarcopenia Muscle. 2022;13(2):1064–1075. doi:10.1002/jcsm.12921
26. Giacobbe DR, Mora S, Giacomini M, Bassetti M. Machine learning and multidrug-resistant gram-negative bacteria: an interesting combination for current and future research. Antibiotics (Basel). 2020;9(2):54.
27. Xie W, Ji M, Zhao M, Lam KY, Chow CY, Hao T. Developing machine learning and statistical tools to evaluate the accessibility of public health advice on infectious diseases among vulnerable people. Comput Intell Neurosci. 2021;2021(1):1916690. doi:10.1155/2021/1916690
28. Boudreault J, Campagna C, Chebana F. Machine and deep learning for modelling heat-health relationships. Sci Total Environ. 2023;892:164660. doi:10.1016/j.scitotenv.2023.164660
29. Alkhathlan L, Saudagar AKJ. Predicting and classifying breast cancer using machine learning. J Comput Biol. 2022;29(6):497–514. doi:10.1089/cmb.2021.0236
30. Shi X, Hsieh SJ, Romero RAF. FEA and machine learning techniques for hidden structure analysis. Sensors (Basel). 2021;21(15):5159. doi:10.3390/s21155159
31. Christodoulou E, Ma J, Collins GS, Steyerberg EW, Verbakel JY, Van Calster B. A systematic review shows no performance benefit of machine learning over logistic regression for clinical prediction models. J Clin Epidemiol. 2019;110:12–22. doi:10.1016/j.jclinepi.2019.02.004
32. Deng Y, Ma Y, Fu J, et al. Combinatorial use of machine learning and logistic regression for predicting carotid plaque risk among 5.4 million adults with fatty liver disease receiving health check-ups: population-based cross-sectional study. JMIR Pub Health Surveill. 2023;9(e47095):e47095. doi:10.2196/47095
33. Dezem FS, Marção M, Ben-Cheikh B, et al. A machine learning one-class logistic regression model to predict stemness for single cell transcriptomics and spatial omics. BMC Genomics. 2023;24(1):717. doi:10.1186/s12864-023-09722-6
34. Song X, Liu X, Liu F, Wang C. Comparison of machine learning and logistic regression models in predicting acute kidney injury: a systematic review and meta-analysis. Int J Med Inform. 2021;151:104484. doi:10.1016/j.ijmedinf.2021.104484
35. Joshi RD, Dhakal CK. Predicting type 2 diabetes using logistic regression and machine learning approaches. Int J Environ Res Public Health. 2021;18(14):7346. doi:10.3390/ijerph18147346
36. Kharazmi E, Scherer D, Boekstegers F, et al. Gallstones, cholecystectomy, and kidney cancer: observational and Mendelian randomization results based on large cohorts. Gastroenterology. 2023;165(1):218–27.e8. doi:10.1053/j.gastro.2023.03.227
37. Abraham S, Rivero HG, Erlikh IV, Griffith LF, Kondamudi VK. Surgical and nonsurgical management of gallstones. Am Fam Physician. 2014;89(10):795–802.
38. Di Ciaula A, Garruti G, Frühbeck G, et al. The role of diet in the pathogenesis of cholesterol gallstones. Curr Med Chem. 2019;26(19):3620–3638. doi:10.2174/0929867324666170530080636
39. Seravalle G, Grassi G. Obesity and hypertension. Pharmacol Res. 2017;122:1–7. doi:10.1016/j.phrs.2017.05.013
40. Wang T, He C. Pro-inflammatory cytokines: the link between obesity and osteoarthritis. Cytokine Growth Factor Rev. 2018;44:38–50. doi:10.1016/j.cytogfr.2018.10.002
41. Iyengar NM, Gucalp A, Dannenberg AJ, Hudis CA. Obesity and cancer mechanisms: tumor microenvironment and inflammation. J Clin Oncol. 2016;34(35):4270–4276. doi:10.1200/JCO.2016.67.4283
42. Dinda B, Dinda M, Roy A, Dinda S. Dietary plant flavonoids in prevention of obesity and diabetes. Adv Protein Chem Struct Biol. 2020;120:159–235.
43. Hayón-Ponce M, García-Fontana B, Avilés-Pérez MD, et al. Lower trabecular bone score in type 2 diabetes mellitus: a role for fat mass and insulin resistance beyond hyperglycaemia. Diabetes Metab. 2021;47(6):101276. doi:10.1016/j.diabet.2021.101276
44. Xiao B, Cao C, Han Y, Hu H, He Y. Non-linear relationship between relative fat mass and diabetes risk in Japanese adults: a retrospective cohort study. Sci Rep. 2024;14(1):23496. doi:10.1038/s41598-024-74635-7
45. Pulgaron ER, Delamater AM. Obesity and type 2 diabetes in children: epidemiology and treatment. Curr Diab Rep. 2014;14(8):508. doi:10.1007/s11892-014-0508-y
46. Li H, Ren J, Li Y, Wu Q, Wei J. Oxidative stress: the nexus of obesity and cognitive dysfunction in diabetes. Front Endocrinol. 2023;14:1134025. doi:10.3389/fendo.2023.1134025
47. Glatz JFC, Dyck JRB, Des Rosiers C. Cardiac adaptations to obesity, diabetes and insulin resistance. Biochim Biophys Acta Mol Basis Dis. 2018;1864(5 Pt B):1905–1907. doi:10.1016/j.bbadis.2018.01.024
48. Piché ME, Tchernof A, Després JP. Obesity phenotypes, diabetes, and cardiovascular diseases. Circ Res. 2020;126(11):1477–1500. doi:10.1161/CIRCRESAHA.120.316101
49. Shi C, Liu X, Xie Z, et al. Lifestyle factors and the risk of gallstones: results from the national health and nutrition examination survey 2018-2020 and Mendelian randomization analysis. Scand J Gastroenterol. 2023;58(9):1021–1029. doi:10.1080/00365521.2023.2197093
50. Miller B, Chalfant H, Thomas A, et al. Diabetes, Obesity, and Inflammation: impact on Clinical and Radiographic Features of Breast Cancer. Int J mol Sci. 2021;22(5):2757. doi:10.3390/ijms22052757
 © 2025 The Author(s). This work is published and licensed by Dove Medical Press Limited. The
full terms of this license are available at https://www.dovepress.com/terms
and incorporate the Creative Commons Attribution
- Non Commercial (unported, 3.0) License.
By accessing the work you hereby accept the Terms. Non-commercial uses of the work are permitted
without any further permission from Dove Medical Press Limited, provided the work is properly
attributed. For permission for commercial use of this work, please see paragraphs 4.2 and 5 of our Terms.
© 2025 The Author(s). This work is published and licensed by Dove Medical Press Limited. The
full terms of this license are available at https://www.dovepress.com/terms
and incorporate the Creative Commons Attribution
- Non Commercial (unported, 3.0) License.
By accessing the work you hereby accept the Terms. Non-commercial uses of the work are permitted
without any further permission from Dove Medical Press Limited, provided the work is properly
attributed. For permission for commercial use of this work, please see paragraphs 4.2 and 5 of our Terms.