Back to Journals » Journal of Inflammation Research » Volume 13
Relationships Between Vitamin D Status and Cytokine: Results from Interferon-Based Therapy in Non-Cirrhotic, Treatment-Naïve Patients with Chronic Hepatitis C Infection
Authors Chen HW, Chiu YL ![]() , Hsieh TY, Chen PJ, Huang TY, Lin HH, Shih YL, Lin JC
, Hsieh TY, Chen PJ, Huang TY, Lin HH, Shih YL, Lin JC ![]()
Received 24 September 2020
Accepted for publication 11 December 2020
Published 29 December 2020 Volume 2020:13 Pages 1207—1218
DOI https://doi.org/10.2147/JIR.S283768
Checked for plagiarism Yes
Review by Single anonymous peer review
Peer reviewer comments 3
Editor who approved publication: Professor Ning Quan
Hsuan-Wei Chen,1 Yi-Lin Chiu,2 Tsai-Yuan Hsieh,1 Peng-Jen Chen,1 Tien-Yu Huang,1 Hsuan-Hwai Lin,1 Yu-Lueng Shih,1 Jung-Chun Lin1
1Division of Gastroenterology, Department of Internal Medicine, Tri-Service General Hospital, National Defense Medical Center, Taipei, Taiwan; 2Department of Biochemistry, National Defense Medical Center, Taipei, Taiwan
Correspondence: Jung-Chun Lin
Division of Gastroenterology, Department of Internal Medicine, Tri-Service General Hospital, National Defense Medical Center, 325, Sec 2, Cheng-Kung Road, Neihu 114, Taipei, Taiwan
Tel +886-2- 87927409
Fax +886-2- 87927139
Email [email protected]
Background: Vitamin D contributes to bone health and extra-skeletal effects. The mechanisms underlying vitamin D metabolism have not been extensively evaluated. The relationships between vitamin D and inflammatory cytokines are debated. Our objective was to investigate whether supplemental interferons are associated with longitudinal change of vitamin D status in humans.
Methods: A total of 48 patients with 24 or 48 weeks of pegylated interferon-α plus ribavirin therapy were examined for serum 25-hydroxyvitamin D (25[OH]D) level before treatment, at the end of treatment, and 24 weeks after treatment. In addition, we analyzed publicly available RNA sequencing data from accession GSE42697 and GSE7123 in the Gene Expression Omnibus.
Findings: The overall sustained virologic response (SVR) rate was 62.5%. There was no statistically significant association between baseline 25(OH)D concentrations and liver fibrosis. In patients with SVR, serum 25(OH)D increased markedly at end-of-treatment and decreased markedly by the end of the 24-week follow-up period. In the non-SVR group, this treatment-dependent change was lost. In gene expression analysis, the vitamin D biosynthesis process was activated in subjects with SVR, but not in patients without SVR. Furthermore, vitamin D receptor (VDR) signaling in peripheral blood mononuclear cells (PBMCs) was triggered in marked responders but not in poor responders.
Conclusion: In the aggregate, these data suggest that interferons have a regulatory influence on vitamin D status that can contribute to VDR signaling in PBMCs.
Keywords: cytokines, interferon-α, PBMCs, VDR signaling, vitamin D
Introduction
Vitamin D is of crucial importance for bone health, and it appears to have extra-skeletal influences.1,2 Vitamin D can be procured from solar ultraviolet B radiation (wavelength 290–315 nm), the diet, or dietary supplements.3 The two major varieties of vitamin D (calciferol) are the plant form referred to as vitamin D2 (ergocalciferol) and the animal form known as vitamin D3 (cholecalciferol). The 25-hydroxylation of both forms of vitamin D happens in the liver via the major enzyme cytochrome P-450 family 2, subfamily R, polypeptide 1 (CYP2R1) to 25-hydroxyvitamin D (25[OH]D) that can be stored.4 The serum level of 25(OH)D reflects the adequacy of nutritional vitamin D status. The 25(OH)D is then transported into the blood stream to the proximal tubule of the kidney where it is 1α-hydroxylated to 1,25-dihydroxyvitamin D3 (1,25(OH)2D3 or calcitriol), which is its only active form.5
A low level of 25(OH)D is associated with a number of skeletal6,7 and extra-skeletal complications, including cardiovascular diseases,8,9 cancers,10 decreased muscle strength,11,12 and autoimmune disorders such as type 1 diabetes,13 rheumatoid arthritis,14,15 systemic lupus erythematosus16 and ulcerative colitis.9,17,18 This is because vitamin D is an essential micronutrient that regulates inflammatory events, skeletal muscle size and function, and collagen metabolism.9 Serum 25(OH)D concentrations are influenced by a number of factors. Evidence is emerging about dietary, environmental, and body compositional factors. The mechanisms by which these factors may influence vitamin D metabolism are not well understood.2
Vitamin D is thought to be a strong immuno-modulator and that reciprocally, inflammation modulates vitamin D metabolism because systemic inflammation contributes to the reduction in serum 25(OH)D concentrations.9,19,20 However, previous studies exploring the relationships between vitamin D and inflammatory cytokines only focused on interferon-γ, interleukin (IL)-4, IL-6, IL-8, IL-10, tumor necrosis factor (TNF)-α, and leptin and have yielded inconsistent results.21–27 The regulatory influence of supplemental cytokines on vitamin D is still not clear.
Before the launch of interferon-free treatments in 2013, the mainstay of hepatitis C virus (HCV) therapy in Taiwan was different treatment durations of peginterferon/ribavirin based on “response‐guided therapy”.28 The potential impact of ribavirin on the observations of vitamin D status is not obvious because serum concentrations of total 25(OH)D were not affected by ribavirin in one animal study.29 In addition to treatment of hepatitis B and C, interferon-α is an approved therapy to treat more than 14 types of cancer, including hairy cell leukemia, melanoma and renal cell carcinoma.30 The relationship between vitamin D and inflammatory cytokines remains controversial, and the assessment of vitamin D status and treatment response may be a potential indicator that parallels the different cancers. To date, no intervention study has determined whether an association exists between supplemental interferons and longitudinal change of 25(OH)D concentrations in humans. The primary aim of this study was to investigate whether interferon supplementation is associated with longitudinal changes in vitamin D status in humans, and we therefore performed a secondary analysis of a subset of hepatitis C subjects enrolled in our observational study.31
Materials and Methods
Subjects
This study was performed in Taipei City (latitude: 25.1°N), Taiwan, where sunshine was sufficient all year.31 Since studies from Asia provide evidence supporting the response-guided treatment strategy for Asian patients,28 treatment-naïve patients with chronic HCV infection without cirrhosis received response-guided pegylated interferon α-based therapy, which was reimbursed by the Bureau of National Health Insurance in Taiwan and involved a 24-week treatment for patients with a rapid viral response (RVR) and a 48-week treatment for patients without an RVR.32 Chronic HCV infection was diagnosed based on the presence of anti-HCV antibodies and detectable serum HCV RNA. Subjects with hepatitis B, cirrhosis (Child–Pugh score ≥6), hepatocellular carcinoma, co-infection with human immunodeficiency virus, and autoimmune hepatitis were excluded. All patients offered a written informed consent form in order to engage in the study, which was approved by the Institutional Review Board of Tri-Service General Hospital, National Defense Medical Center, Taipei, Taiwan (protocol no. 098–05-068) and was performed in accordance with the revised Helsinki Declaration.
Data and Sample Collection
Variables, including age, gender, and body mass index (BMI), were recorded. During the study course, blood samples were obtained at the time of pre-treatment evaluation, the day after treatment (end of treatment), and at a scheduled clinic visit 24 weeks after treatment (post-treatment week 24). Complete blood count, HCV viral load, HCV genotype, aspartate aminotransferase (AST), alanine aminotransferase (ALT), intact parathyroid hormone (iPTH), calcium, bone alkaline phosphatase (BAP), creatinine, and phosphorus were measured using previously reported methods.31 Serum total 25(OH)D is the best reflection of vitamin D status and is very stable. Thus, levels of 25(OH)D were assessed using chemiluminescence immunoassays (Liaison® XL Analyzer; Diasorin, USA). The time from the sampling of serum stored at 2–8 °C to measurement was less than 5 days.
Definition of Terms
The sustained virologic response (SVR) was defined as undetectable serum HCV RNA determined by polymerase chain reaction at 24 weeks after treatment cessation. Non-SVRs were considered patients in whom HCV RNA titers dropped < 2 log10 from baseline at week 12, those whose viral loads dropped >2 log10 at week 12 compared baseline, and who still had positive HCV RNA at week 24, as well as those who experienced HCV RNA reappearance after negativization before or at the end of treatment.33 Fibrosis staging was assessed based on the noninvasive index FIB-4, calculated using the formula: age (years) × AST [U/L]/(platelets [109/L] ×ALT [U/L])1/2, computed from laboratory results in all patients. Low (<1.45, no or minimal fibrosis), intermediate (1.45–3.25), and high (>3.25, significant fibrosis) FIB-4 indexes were defined as previously established.34
Gene Expression Profiling
The microarray array data of GSE42697 published by Tsubota et al35 and GSE7123 published by Taylor et al36 were downloaded from the National Center for Biotechnology Information Gene Expression Omnibus (GEO) database (http://www.ncbi.nlm.nih.gov/geo/). Both datasets analyzed the response of CHC patients to interferon treatment by using whole gene expression profiling.
In Tsubota’s study, the patients infected with HCV genotype 1b who were treated with 48- or 72-week duration of pegylated interferon α-2b at Jikei University Kashiwa-affiliated hospitals, Japan, were enrolled.35 Liver specimens of those patients were obtained before treatment to perform global mRNA expression analysis. GSE42697 collected liver tissue samples from 12 CHC patients for analysis, which included 5 patients with SVR and 7 non-responders. In Taylor’s study, African-American and Caucasian American patients treated for up to 48 weeks with pegylated interferon α-2a were recruited to collect peripheral mononuclear blood cells (PBMCs) during the first 28 days of therapy. Global gene expression in PBMCs was analysed.36 GSE7123 collected peripheral blood from 25 CHC patients with poor viral response (<1.5 log10 IU/mL decrease at 28 days) and 44 responders (>1.5 log10 IU/mL) for analysis before and during antiviral therapy. The maximum expression values of multiple probe IDs that corresponded to one official gene symbol were computed, and these values were used to represent the expression level of the related gene symbol.
Pathway Enrichment Analysis
Gene Set Variation Analysis (GSVA) is a widely used approach for computing enrichment scores of given gene sets in single samples.37 We compared the results produced by the GSVA using “The Process of Vitamin D Biosynthesis (GO: 0042368)” and “Vitamin D receptor (VDR) signaling pathway (GO: 0070561)” gene signatures proposed by the Gene Ontology resource.38 The scores were computed in the R Bioconductor package gsva (v 1.34.0) with default parameters.
Statistical Analysis
Continuous variables were presented as means ± SEM. The results for categorical variables were expressed as percentages. Comparisons amid groups were made by use of the unpaired Student’s t-test or Kruskal–Wallis test. To analyze the p-value of VDR’s GSVA scores overtime with multiple testing, Bonferroni correction was used.
Results
Demographics and Baseline Features
A total of 48 patients, 27 (56.3%) women and 21 men (43.7%), were consecutively enrolled (Figure 1). The average age was 53.3 ± 1.9 years old (range: 22–79). Fifteen patients (31.3%) had vitamin D insufficiency (11–20 ng/mL) and 2 patients (4.16%) had vitamin D deficiency (≦ 10 ng/mL). None of these got any vitamin D supplements. The mean pretreatment 25(OH)D was 21.51 ± 0.7 ng/mL. The baseline demographic features of the patient cohort are summarized in Table 1 according to patients’ SVR status. Eighteen patients (37.5%) completed 24 weeks of therapy, while 30 patients (62.5%) were treated for 48 weeks. Overall, 30 patients achieved an SVR (62.5%). The SVR rate among the subset of patients who completed 24 weeks of therapy was 100% (18 of 18 patients). A lower SVR rate (40%, 12 of 30 patients) was observed among the subset of patients who completed 48 weeks of therapy. Non-SVR was detected in 18 patients (37.5%). There was no association between gender, BMI, hemoglobin, white blood cells, platelet count, AST, ALT, iPTH, calcium, BAP, phosphorus, creatinine, HCV genotype, HCV RNA viral load, or FIB-4 index and in relation to SVR.
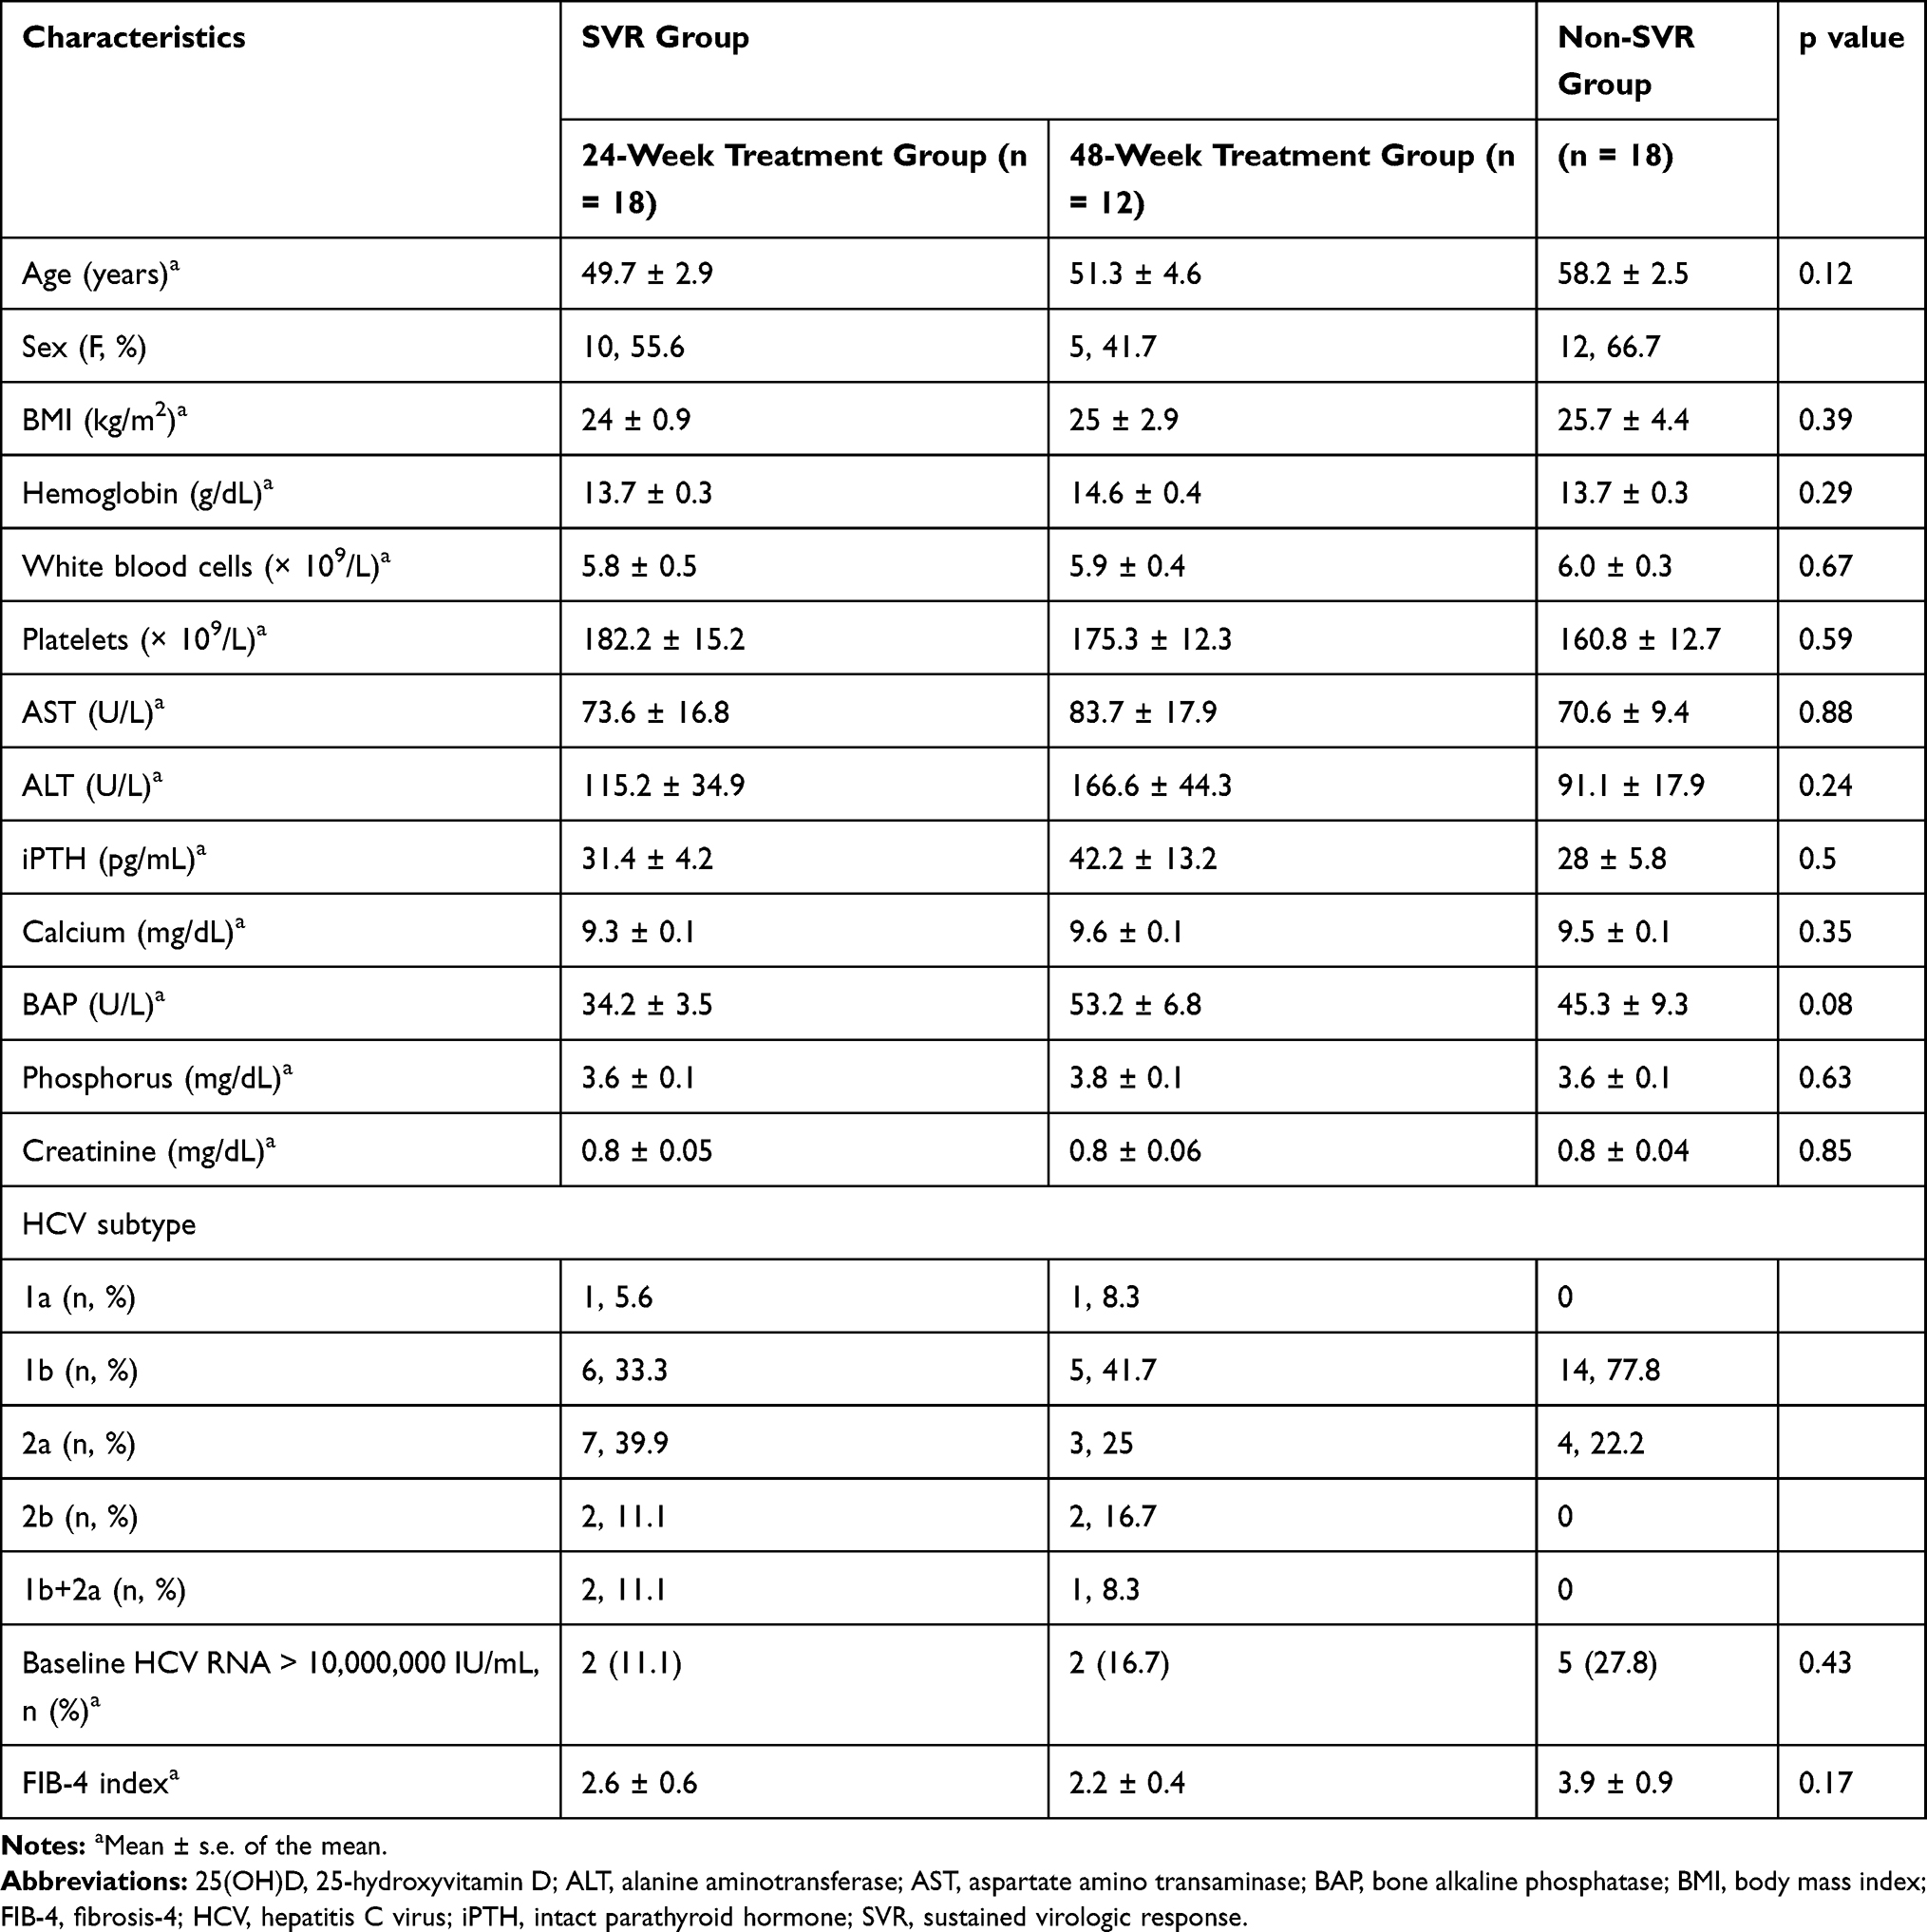 |
Table 1 Demographic and Baseline Characteristics of Patients |
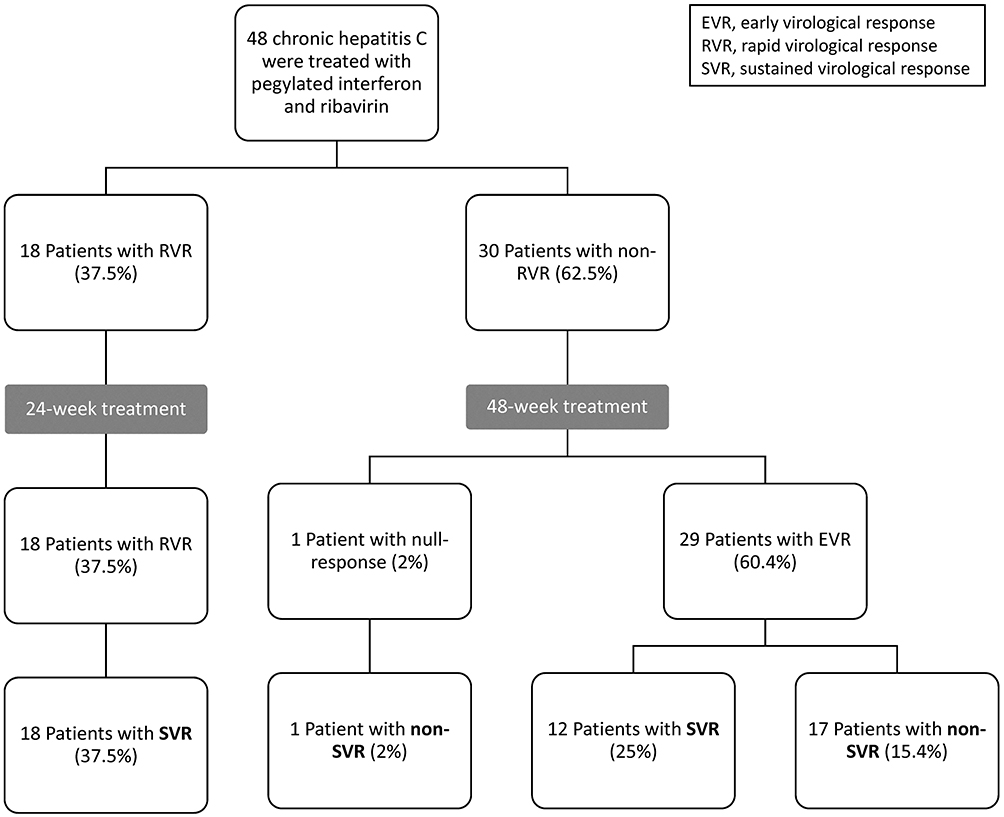 |
Figure 1 Participant flow chart. |
Vitamin D Status and Hepatic Fibrosis
The mean FIB-4 index at baseline showed 2.89 ± 0.4. FIB-4 index prevalence was: low in 33.3% (n = 16), intermediate in 35.4% (n = 17), and high in 31.2% of the patients (n = 15), as shown in Figure 2A. Mean 25(OH)D level did not significantly differ amid fibrosis stage (no or minimal fibrosis: 21.35 ± 1.5 ng/mL, intermediate FIB-4 index: 21.61 ± 1.4 ng/mL, significant fibrosis: 21.56 ± 0.7 ng/mL; P = 0.98), as illustrated in Figure 2B. There was no significant relationship amid 25(OH)D concentrations and liver fibrosis (r = −0.016, P = 0.91) as illustrated in Figure 2C.
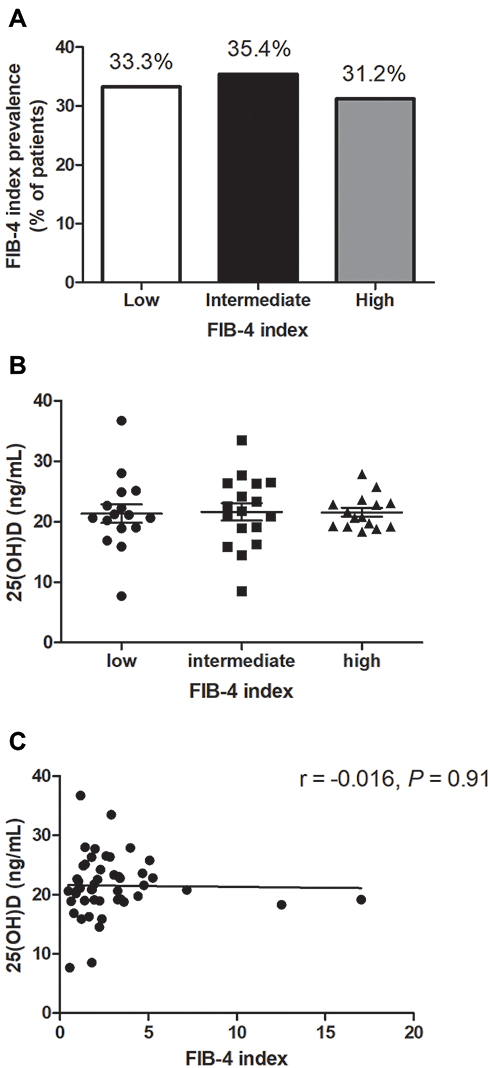 |
Figure 2 FIB-4 index and 25(OH)D level. (A) The proportion among patients with different scores of FIB-4 index showed an equal distribution. (B) Mean 25(OH)D concentrations did not vary amid high, intermediate, and low FIB-4 index. (C) Mean 25(OH)D levels did not vary amid stages of fibrosis according to FIB-4 index. |
Vitamin D and Viral Response
Antiviral therapy led to a significant increase in the baseline 25(OH)D by the end of treatment in patients completing 24 weeks of therapy with SVR (18.90 ± 0.99 ng/mL vs 23.74 ± 1.19 ng/mL; P = 0.0084, Figure 3A). Likewise, 25(OH)D raised significantly by the end of treatment in comparison to baseline levels in the patients completing 48 weeks of therapy with SVR (21.74 ± 1.40 ng/mL vs 27.42 ± 2.29 ng/mL; P = 0.0487, Figure 3B).
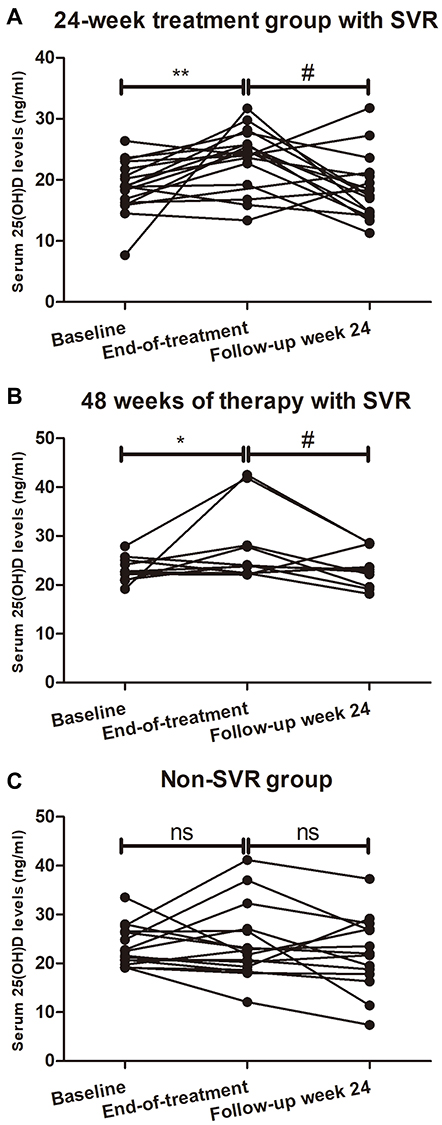 |
Figure 3 25(OH)D serum concentrations of 48 HCV patients are shown at baseline, end of treatment, and 24 weeks after treatment completion. In patients completing 24 (A) or 48 (B) weeks of therapy with SVR, an increase in the mean 25(OH)D level (ng/mL) was observed with significant difference at the end of treatment compared with at baseline. A decrease in the mean 25(OH)D level (ng/mL) was also observed with significant difference at 24 weeks after end of therapy compared with at the end of treatment. (C) Patients without SVR had no significant changes of vitamin D concentrations at the end of treatment or 24 weeks after cessation of treatment. *p < 0.05 compared with baseline, **p < 0.01 compared with baseline, #p < 0.05 compared with end-of-treatment. Abbreviations: ns, not significant; SVR, sustained virologic response. |
All 48 patients underwent additional 25(OH)D measurements by the end of the 24-week follow-up period. In comparison with end-of-treatment values, 25(OH)D tended to diminish in the majority of patients with SVR after completing 24 weeks of therapy (23.74 ± 1.19 ng/mL vs 18.53 ± 1.28 ng/mL; P = 0.0102, Figure 3A). Similarly, a significant portion of the patients with SVR after completing 48 weeks of therapy had lower 25(OH)D by the end of the 24-week follow-up period as compared with end-of-treatment values (27.42 ± 2.29 ng/mL vs 22.92 ± 1.24 ng/mL; P = 0.0320, Figure 3B).
In contrast, patients with non-SVR had no on-treatment change of 25(OH)D during antiviral therapy or thereafter by the end of the 24-week follow-up period (Figure 3C).
Vitamin D Biosynthetic Process and Viral Response
To ascertain the influences of interferons on vitamin D synthesis and metabolism, we analyzed the metadata of the GEO. “The Process of Vitamin D Biosynthesis (GO: 0042368)” was used to assess the effect of interferon therapy on the ability of the liver to synthesize vitamin D in CHC patients with or without SVR. The vitamin D synthesis ability in the liver of each CHC patient in GSE42697 was quantified using the GSVA method. Patients with SVR had significantly higher GSVA scores of the vitamin D biosynthesis process as compared to those with non-SVR (Figure 4).
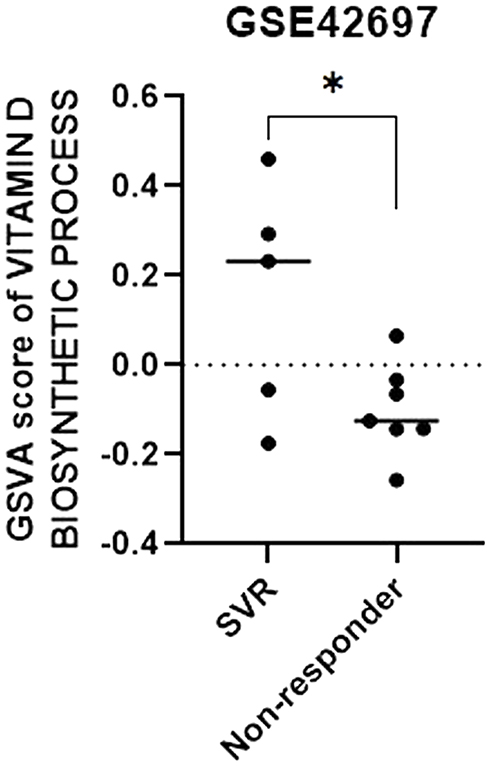 |
Figure 4 Gene expression profiles reveal an association between vitamin D biosynthesis process and the viral response to interferon-based treatment. The gene set variation analysis (GSVA) score of the vitamin D biosynthesis process was significantly greater in patients with SVR in comparison with those with no response. *p < 0.05. Abbreviation: SVR, sustained virologic response. |
Vitamin D Biosynthetic Process and Vitamin D Receptor (VDR) Signaling in Peripheral Blood Mononuclear Cells (PBMCs)
Vitamin D status contributes to VDR protein levels in PBMCs, which respond to interferon-based therapy.39,40 To investigate the association between the interferon-induced vitamin D biosynthesis and activation of VDR signaling in PBMCs, “VDR signaling pathway (GO: 0070561)” was applied and quantified by GSVA in HCV patients in GSE7123 with distinct treatment response. Interestingly, when changes in scores of VDR signaling pathway in PBMCs were compared, the increase in GSVA score was statistically significant in the marked responder group on days 7 (p = 0.03), 14 (p <0.001), and 28 (p <0.001) but not in the poor responder group (Figure 5).
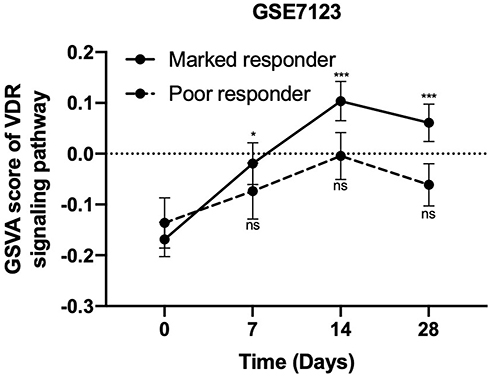 |
Figure 5 Gene expression profiles reveal an association between vitamin D receptor (VDR) signaling in peripheral blood mononuclear cells (PBMCs) and the viral response to interferon-based treatment. The gene set variation analysis (GSVA) scores of VDR signaling pathway in PBMCs from patients who have marked viral response to interferon-based treatment were significantly elevated on days 7, 14, and 28, but this was not the case for poor responders.*p < 0.05 in comparison to baseline, ***p < 0.001 in comparison to baseline. Abbreviation: ns, not significant. |
Discussion
In this study, there was a relatively low prevalence of serum 25(OH)D deficiency, which was compared with the results of other studies that have mainly focused on naïve genotype 1 HCV-infected patients.41,42 Furthermore, we demonstrate for the first time that an association between supplemental interferons and changes in 25(OH)D concentrations occurs in response to the interferon-based therapy in HCV-positive patients. Activations of VDR signaling in PBMCs were connected with increased 25(OH)D circulating levels (Figure 6).
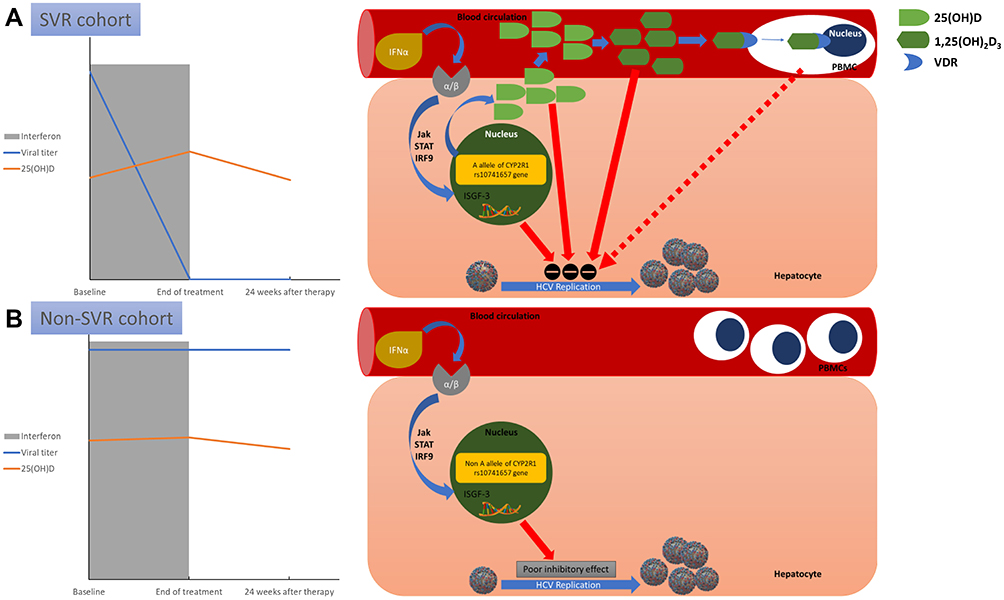 |
Figure 6 A schematic model proposed for the association between vitamin D and interferon-α in chronic hepatitis C patients without cirrhosis. Dynamic changes of 25-hydroxyvitamin D (25[OH]D) concentrations during pegylated interferon-α based therapy in patients are stratified by sustained viral response (SVR) and non-SVR. (A) In the SVR cohort, pegylated interferon-α engages receptors on the hepatocyte cell-surface membrane, activating Janus-activated and tyrosine kinases (JAK) that phosphorylate the cytoplasmic signal transducers and activators of transcription (STAT) proteins. Then, STAT binds interferon regulatory factor 9 (IRF9), creating interferon-stimulated gene factor 3 (ISGF3), which is translocated into the nucleus where it attaches interferon-stimulated response elements to DNA. This engagement instigates transcription of multiple (>100) interferon-stimulated gene mRNAs to inhibit hepatitis C virus (HCV) replication. Moreover, carriers of the “A” allele of CYP2R1 rs10741657 have upsurges of 25(OH)D concentrations following interferon-α therapies. In addition to 25(OH)D suppressing HCV replication, the biologically active vitamin D metabolite 1,25‐dihydroxyvitamin D3 (1,25[OH]2D3) directly suppresses HCV-RNA replication. Furthermore, antiviral vitamin D–vitamin D receptor (VDR) signaling in peripheral blood mononuclear cells (PBMCs) is activated to improve the response to interferon-based therapy. (B) In the non-SVR cohort, pegylated interferon-α has a poor inhibitory effect on HCV replication through transient Jak/STAT activation alone in non-“A” allele carriers. Furthermore, VDR signaling in PBMCs is not activated, and PBMC proliferation is not inhibited. |
Liver biopsy has been used as the “gold standard” for assessment of hepatic fibrosis in patients with CHC, one of the limitations of biopsy is diagnostic inaccuracy secondary to sampling error, observer variation, and specimen size.43 Non-invasive assessment of liver fibrosis by elastography techniques has mostly been validated in the context of CHC. However, elastography is also unable to reliably differentiate between adjacent fibrosis stages, and there is considerable overlap in liver stiffness measure for intermediate stage disease. Moreover, different elastography devices may provide discordant results for defining liver fibrosis staging in CHC.43 Furthermore, FIB-4 scores may have good diagnostic performances for fibrotic stage assessment compared with elastography, especially for cirrhosis.44 FIB‐4 scores are recommended by World Health Organization to assess hepatic fibrosis in resource‐limited setting rather than elastography.45 On the other hand, the clinical literature concerning the relationship between serum vitamin D and the severity of liver fibrosis is more controversial. Subjects with vitamin D deficiency were reported to be associated with more advanced fibrosis stage and higher necro-inflammatory grade.42,46 In contrast, it has been demonstrated that there was no independent relationship between vitamin D status and fibrosis stage.47,48 Given the limitations and variability of tests for assessment of liver fibrosis, our results did not find a possible existence of association between vitamin D status and hepatic fibrosis, and they further pointed toward a weak relationship between dynamic changes of vitamin D status and hepatic fibrosis.
The relation between baseline vitamin D status and response to antiviral therapy is still a matter of debate. Some studies indicated that baseline 25(OH)D concentration was related to SVR,41,42,46 whereas other investigators discovered no relationship between vitamin D concentration and achievement of SVR.47,49 In this study, we found that baseline 25(OH)D concentration was not independently connected with attainment of SVR. The discrepancy between these studies can probably be accounted for by the use of different measurement techniques, vitamin D cut-off values, and varied genotypes. On the other hand, the directionality of the association between viral response and dynamic changes of 25(OH)D levels can be measured with validity from our experimental design. Three scenarios could be proposed: (1) supplemental interferons modulate 25(OH)D concentrations with the disappearance of HCV; (2) supplemental interferons cannot modulate 25(OH)D levels with the existence of HCV; and (3) 25(OH)D levels are decreased after stopping supplemental interferons with the disappearance of HCV.
IL-28B single nucleotide polymorphisms (SNPs) may play an important role in the management of HCV infection. However, the predictive role of IL-28B genotype is limited for HCV genotype 2 and 3 patients and for HCV patients with response-guided therapy.50 Moreover, SNPs in the IL-10 do not predict the treatment outcome of patients with HCV infection who are treated with pegylated interferon plus ribavirin.51 Furthermore, genetic polymorphisms in the inosine triphosphatase (ITPA) gene are associated with protection from ribavirin-associated anemia in patients; however, ITPA variants are not associated with the SVR.52 Accordingly, the association of SNPs with HCV infection is still ambiguous. On the other hand, circulating 25(OH)D levels mirror not only vitamin D stores but also hepatic hydroxylation. Since the vitamin D metabolizing enzyme CYP2R1 encodes vitamin D 25-hydroxylase that transforms cholecalciferol to 25(OH)D, genetic variation in CYP2R1 is known to affect 25(OH)D concentrations.53 Indeed, carriers of the “A” allele of CYP2R1 rs10741657 have statistically significantly greater serum 25(OH)D concentrations.54–57 Moreover, the treatment response following an interferon-based regimen has been previously reported to be associated with the carrier state of the “A” allele of CYP2R1 rs10741657 and SVR.58 In addition, our findings indicate that interferon antiviral response, but not the existence of HCV and hepatic injury, is involved in altered 25(OH)D circulating levels. It is therefore tempting to suggest a genetic link between vitamin D biosynthetic process and interferon antiviral response.
Our finding that vitamin D status is associated with an interferon modulation could be interpreted in several ways. In addition to the fact that pegylated interferon-α regulates hepatic gene expression through transient Janus-activated and tyrosine kinases (JAK)/signal transducers and activators of transcription (STAT) activation,59 one explanation is that the inhibitory role of interferon-α on HCV is mediated through the antiviral effect of 25(OH)D, which is in agreement with experimental in vitro models.60,61 Moreover, previous interventional and clinical studies62,63 provide evidence that vitamin D3 supplementation raises rates of EVR or SVR following treatment with pegylated interferon-α-based therapy for CHC, although our study was observational and cannot directly prove causality. Another explanation is that the biologically active vitamin D metabolite, 1,25(OH)2D3, represses HCV-RNA reproduction in a dose-dependent way in cell culture, and interferons have a synergistic effect on reduced HCV secretion,64 which is in line with the in vitro study that indicates that synthetic calcitriol analogs inhibit HCV replication. This concept appears to be consistent with a role for 1(OH) vitamin D3, which becomes 1,25(OH)2D3 in the liver and has been found to have an effect on improving the sensitivity of interferon-based therapy on HCV-infected hepatocytes.40
Another major finding in our study was that there exists a more antiviral form of vitamin D-VDR signaling in PBMCs in CHC patients undergoing interferon-based treatment. VDR signaling in PBMCs may represent a novel predictor of the effectiveness of antiviral therapy in naïve HCV-infected patients. Indeed, it is reported that administration of vitamin D3 reduces PBMC proliferation and the cytokine (TNF-α, interferon-γ, and interferon γ-induced protein 10) production in PBMCs.39,40 Based on our findings, we speculate that vitamin D3 may act directly on the VDR in PBMCs to inhibit PBMCs’ activation and affect the production of cytokines from PBMCs to improve the response to interferon-based therapy.
The concept of the personal vitamin D response index (VDRI) portrays the efficacy of the molecular response to supplementation with vitamin D. Individuals can be classified as high, intermediate, and low responders to vitamin D. Variations in the VDRI may be partially on the basis of genetic variations in vitamin D metabolizing enzymes and genomic VDR binding and chromatin opening in PBMCs.65 Thus, changes in vitamin D sensitive molecular parameters, including the epigenetic condition and the corresponding transcription of genes of PBMCs during pegylated interferon-based therapy for CHC, may distinguish responders from non-responders to antiviral therapy.
Our study has some major strengths. First, our study demonstrates for the first time that 25(OH)D levels positively correlate with supplemental interferons in humans, rather than over-relying on in vitro or animal models, although ours is not a randomized controlled trial. Second, our study was prospective and clearly established a homogenous cohort of patients with non-cirrhotic chronic HCV infections. Third, our study was physician- and researcher-blinded; physicians evaluating for viral response during our treatment periods were blinded to baseline serum vitamin D. Researchers assessing serum vitamin D levels were also blinded to clinical consequences. The de-identified serum samples were not matched to their corresponding clinical results until after the study period had closed. Fourth, our study recruited two independent cohorts to investigate pathway enrichment analysis, which allowed us to gain mechanistic insight into gene lists generated from genome-scale (omics) experiments.
This study has many limitations that are worth attention. First, our sample size was small and only included CHC patients. This restrains the generalizability of our findings to only CHC patients rather than a chronic hepatitis B cohort. Second, we did not assess 1,25(OH)2D3 levels, which may have clarified whether there are variances in the physiologically active form and dynamic changes in patients with CHC. Third, our study is observational and restrained by the incapability to explain possible unmeasured confounders. For example, physical activity and sunscreen use were not to be taken into consideration.
Conclusions
In conclusion, several parameters influence vitamin D levels. As well as these factors, we posit that there is an interferon-α–vitamin D axis, at least in men. Extra studies will be required to investigate the mechanisms accountable to this interferon-α–vitamin D association. Therefore, a new project by the same team on a cohort of patients treated with direct-acting antiviral drugs is now in progress to further clarify the influence of interferons and liver inflammation on vitamin D levels in humans. In the meantime, results of the present study emphasize the relevance of interferon-α, circulating vitamin D levels, and VDR signaling in the circumstance of innate immunity concentrated in PBMCs.
Abbreviations
1,25(OH)2D3, 1,25‐dihydroxyvitamin D3; 25(OH)D, 25-hydroxyvitamin D; ALT, alanine aminotransferase; AST, aspartate aminotransferase; BAP, bone alkaline phosphatase; BMI, body mass index; CHC, chronic hepatitis C; CYP2R1, cytochrome P-450 family 2, subfamily R, polypeptide 1; GEO, Gene Expression Omnibus; GSVA, Gene Set Variation Analysis; HCV, hepatitis C virus; IL, interleukin; iPTH, intact parathyroid hormone; PBMC, peripheral blood mononuclear cell; SVR, sustained virologic response; TNF, tumor necrosis factor; VDR, vitamin D receptor.
Acknowledgments
We thank the patients who participated in this study, Dr. Tung-Hung Chueh for his technical assistance in performing statistical analysis, Dr. Daniel Steve Villarreal for English-language editing, and Ms. Yu-Ting Hsu for help in picture editing.
Author Contributions
All authors made a significant contribution to the work reported, whether that is in the conception, study design, execution, acquisition of data, analysis and interpretation, or in all these areas; took part in drafting, revising or critically reviewing the article; gave final approval of the version to be published; have agreed on the journal to which the article has been submitted; and agree to be accountable for all aspects of the work.
Funding
This study was supported in part by grants from the Foundation for Medical Research of Tri-Service General Hospital, Taiwan (R.O.C.) (TSGH-C99-167, TSGH-C-108-074, and TSGH-E-109220 to J.-C. LIN) Medical Affairs Bureau, Ministry of National Defense, Taiwan (R.O.C.) (MAB-104-089 and MAB-108-074 to J.-C. LIN) and the Ministry of Science and Technology, Taiwan (R.O.C.) (MOST 107-2314-B-016-001- to J.-C. LIN; MOST108-2311-B-016-001- to Y.-L. CHIU).
Disclosure
The authors declare no conflict of interest.
References
1. Sami A, Abrahamsen B. The latest evidence from vitamin D intervention trials for skeletal and non-skeletal outcomes. Calcif Tissue Int. 2020;106(1):88–93. doi:10.1007/s00223-019-00616-y
2. Rosen CJ. Clinical practice. Vitamin D insufficiency. N Engl J Med. 2011;364(3):248–254. doi:10.1056/NEJMcp1009570
3. Glass D, Lens M, Swaminathan R, Spector TD, Bataille V, Gagnier J. Pigmentation and vitamin D metabolism in Caucasians: low vitamin D serum levels in fair skin types in the UK. PLoS One. 2009;4(8):e6477. doi:10.1371/journal.pone.0006477
4. Zhu JG, Ochalek JT, Kaufmann M, Jones G, Deluca HF. CYP2R1 is a major, but not exclusive, contributor to 25-hydroxyvitamin D production in vivo. Proc Natl Acad Sci USA. 2013;110(39):15650–15655. doi:10.1073/pnas.1315006110
5. Balasuriya CND, Larose TL, Mosti MP, et al. Maternal serum retinol, 25(OH)D and 1,25(OH)2D concentrations during pregnancy and peak bone mass and trabecular bone score in adult offspring at 26-year follow-up. PLoS One. 2019;14(9):e0222712. doi:10.1371/journal.pone.0222712
6. Miller SC, Halloran BP, DeLuca HF, Jee WS. Studies on the role of vitamin D in early skeletal development, mineralization, and growth in rats. Calcif Tissue Int. 1983;35(4–5):455–460. doi:10.1007/bf02405076
7. Prasad GC, Udupa KN. Role of vitamin D in the osteogenesis of bone in tissue culture. Calcif Tissue Res. 1970;158. doi:10.1007/bf02152406.
8. Wang T, Sun H, Ge H, et al. Association between vitamin D and risk of cardiovascular disease in Chinese rural population. PLoS One. 2019;14(5):e0217311. doi:10.1371/journal.pone.0217311
9. Yin K, Agrawal DK. Vitamin D and inflammatory diseases. J Inflam Res. 2014;7:69–87. doi:10.2147/jir.S63898
10. Shamsi U, Khan S, Azam I, et al. A multicenter case control study of association of vitamin D with breast cancer among women in Karachi, Pakistan. PLoS One. 2020;15(1):e0225402. doi:10.1371/journal.pone.0225402
11. Dzik KP, Skrobot W, Kaczor KB, et al. Vitamin D deficiency is associated with muscle atrophy and reduced mitochondrial function in patients with chronic low back pain. Oxid Med Cell Longev. 2019;2019:6835341. doi:10.1155/2019/6835341
12. Dougherty KA, Dilisio MF, Agrawal DK. Vitamin D and the immunomodulation of rotator cuff injury. J Inflam Res. 2016;9:123–131. doi:10.2147/jir.S106206
13. Napoli N, Strollo R, Pitocco D, et al. Effect of calcitriol on bone turnover and osteocalcin in recent-onset type 1 diabetes. PLoS One. 2013;8(2):e56488. doi:10.1371/journal.pone.0056488
14. Lo Gullo A, Mandraffino G, Bagnato G, et al. Vitamin D status in rheumatoid arthritis: inflammation, arterial stiffness and circulating progenitor cell number. PLoS One. 2015;10(8):e0134602. doi:10.1371/journal.pone.0134602
15. Lin J, Liu J, Davies ML, Chen W, Jiang Y. Serum vitamin D level and rheumatoid arthritis disease activity: review and meta-analysis. PLoS One. 2016;11(1):e0146351–e0146351. doi:10.1371/journal.pone.0146351
16. Sakthiswary R, Raymond AA, Proost P. The clinical significance of vitamin D in systemic lupus erythematosus: a systematic review. PLoS One. 2013;8(1):e55275. doi:10.1371/journal.pone.0055275
17. Guzman-Prado Y, Samson O, Segal JP, Limdi JK, Hayee BH. Vitamin D therapy in adults with inflammatory bowel disease: a systematic review and meta-analysis. Inflamm Bowel Dis. 2020;26:1819–1830. doi:10.1093/ibd/izaa087
18. Gubatan J, Mehigan GA, Villegas F, et al. Cathelicidin mediates a protective role of vitamin D in ulcerative colitis and human colonic epithelial cells. Inflamm Bowel Dis. 2020;26(6):885–897. doi:10.1093/ibd/izz330
19. Reid D, Toole BJ, Knox S, et al. The relation between acute changes in the systemic inflammatory response and plasma 25-hydroxyvitamin D concentrations after elective knee arthroplasty. Am J Clin Nutr. 2011;93(5):1006–1011. doi:10.3945/ajcn.110.008490
20. Ghashut RA, Talwar D, Kinsella J, Duncan A, McMillan DC, Smith B. The effect of the systemic inflammatory response on plasma vitamin 25 (OH) D concentrations adjusted for albumin. PLoS One. 2014;9(3):e92614–e92614. doi:10.1371/journal.pone.0092614
21. Azizieh F, Alyahya KO, Raghupathy R. Association between levels of vitamin D and inflammatory markers in healthy women. J Inflamm Res. 2016;9:51–57. doi:10.2147/JIR.S103298
22. Zhang M, Gao Y, Tian L, et al. Association of serum 25-hydroxyvitamin D3 with adipokines and inflammatory marker in persons with prediabetes mellitus. Clin Chim Acta. 2017;468:152–158. doi:10.1016/j.cca.2017.02.022
23. Gangloff A, Bergeron J, Lemieux I, et al. Relationships between circulating 25(OH) vitamin D, leptin levels and visceral adipose tissue volume: results from a 1-year lifestyle intervention program in men with visceral obesity. Int J Obes (Lond). 2020;44(2):280–288. doi:10.1038/s41366-019-0347-7
24. Willis KS, Smith DT, Broughton KS, Larson-Meyer DE. Vitamin D status and biomarkers of inflammation in runners. Open Access J Sports Med. 2012;3:35–42. doi:10.2147/OAJSM.S31022
25. Schleithoff SS, Zittermann A, Tenderich G, Berthold HK, Stehle P, Koerfer R. Vitamin D supplementation improves cytokine profiles in patients with congestive heart failure: a double-blind, randomized, placebo-controlled trial. Am J Clin Nutr. 2006;83(4):754–759. doi:10.1093/ajcn/83.4.754
26. Sun X, Cao ZB, Zhang Y, Ishimi Y, Tabata I, Higuchi M. Association between serum 25-hydroxyvitamin D and inflammatory cytokines in healthy adults. Nutrients. 2014;6(1):221–230. doi:10.3390/nu6010221
27. Azizieh FY, Alyahya KO, Dingle K. Association of self-reported symptoms with serum levels of vitamin D and multivariate cytokine profile in healthy women. J Inflamm Res. 2017;10:19–28. doi:10.2147/jir.S127892
28. Yu ML, Chuang WL. Treatment of chronic hepatitis C in Asia: when East meets West. J Gastroenterol Hepatol. 2009;24(3):336–345. doi:10.1111/j.1440-1746.2009.05789.x
29. Refaat B, Ashour TH, El-Shemi AG. Ribavirin induced anaemia: the effect of vitamin D supplementation on erythropoietin and erythrocyte indices in normal Wistar rat. Int J Clin Exp Med. 2014;7(9):2667–2676.
30. Belardelli F, Ferrantini M, Proietti E, Kirkwood JM. Interferon-alpha in tumor immunity and immunotherapy. Cytokine Growth Factor Rev. 2002;13(2):119–134. doi:10.1016/s1359-6101(01)00022-3
31. Lin JC, Hsieh TY, Wu CC, et al. Association between chronic hepatitis C virus infection and bone mineral density. Calcif Tissue Int. 2012;91(6):423–429. doi:10.1007/s00223-012-9653-y
32. Chen T-M, Huang P-T, Show B-C, Wen C-F, Chen Y-P. Impact of interleukin-28B polymorphism on HCV-1 infected patients treated with response-guided therapy. Adv Digest Med. 2015;2(1):25–32. doi:10.1016/j.aidm.2014.11.001
33. Ghany MG, Strader DB, Thomas DL, Seeff LB; American Association for the Study of Liver D. Diagnosis, management, and treatment of hepatitis C: an update. Hepatology (Baltimore, Md). 2009;49(4):1335–1374. doi:10.1002/hep.22759
34. Vallet-Pichard A, Mallet V, Nalpas B, et al. FIB-4: an inexpensive and accurate marker of fibrosis in HCV infection. comparison with liver biopsy and fibrotest. Hepatology (Baltimore, Md). 2007;46(1):32–36. doi:10.1002/hep.21669
35. Tsubota A, Mogushi K, Aizaki H, et al. Involvement of MAP3K8 and miR-17-5p in poor virologic response to interferon-based combination therapy for chronic hepatitis C. PLoS One. 2014;9(5):e97078. doi:10.1371/journal.pone.0097078
36. Taylor MW, Tsukahara T, Brodsky L, et al. Changes in gene expression during pegylated interferon and ribavirin therapy of chronic hepatitis C virus distinguish responders from nonresponders to antiviral therapy. J Virol. 2007;81(7):3391–3401. doi:10.1128/JVI.02640-06
37. Hanzelmann S, Castelo R, Guinney J. GSVA: gene set variation analysis for microarray and RNA-seq data. BMC Bioinform. 2013;14:7. doi:10.1186/1471-2105-14-7
38. Ashburner M, Ball CA, Blake JA, et al. Gene ontology: tool for the unification of biology. The Gene Ontology Consortium. Nat Genet. 2000;25(1):25–29. doi:10.1038/75556
39. Almerighi C, Bergamini A, Lionetti R, et al. Vitamin D3 modulates T lymphocyte responses in hepatitis C virus-infected liver transplant recipients. Dig Liver Dis. 2012;44(1):67–73. doi:10.1016/j.dld.2011.08.010
40. Kondo Y, Kato T, Kimura O, et al. 1(OH) vitamin D3 supplementation improves the sensitivity of the immune-response during Peg-IFN/RBV therapy in chronic hepatitis C patients-case controlled trial. PLoS One. 2013;8(5):e63672. doi:10.1371/journal.pone.0063672
41. Bitetto D, Fattovich G, Fabris C, et al. Complementary role of vitamin D deficiency and the interleukin-28B rs12979860 C/T polymorphism in predicting antiviral response in chronic hepatitis C. Hepatology (Baltimore, Md). 2011;53(4):1118–1126. doi:10.1002/hep.24201
42. Lange CM, Bojunga J, Ramos-Lopez E, et al. Vitamin D deficiency and a CYP27B1-1260 promoter polymorphism are associated with chronic hepatitis C and poor response to interferon-alfa based therapy. J Hepatol. 2011;54(5):887–893. doi:10.1016/j.jhep.2010.08.036
43. Regev A, Berho M, Jeffers LJ, et al. Sampling error and intraobserver variation in liver biopsy in patients with chronic HCV infection. Am J Gastroenterol. 2002;97(10):2614–2618. doi:10.1111/j.1572-0241.2002.06038.x
44. Papadopoulos N, Vasileiadi S, Papavdi M, et al. Liver fibrosis staging with combination of APRI and FIB-4 scoring systems in chronic hepatitis C as an alternative to transient elastography. Ann Gastroenterol. 2019;32(5):498–503. doi:10.20524/aog.2019.0406
45. Guidelines for the care and treatment of persons diagnosed with chronic hepatitis C virus infection. WHO Guidelines Approved by the Guidelines Review Committee. 2018.
46. Petta S, Camma C, Scazzone C, et al. Low vitamin D serum level is related to severe fibrosis and low responsiveness to interferon-based therapy in genotype 1 chronic hepatitis C. Hepatology (Baltimore, Md). 2010;51(4):1158–1167. doi:10.1002/hep.23489
47. Kitson MT, Dore GJ, George J, et al. Vitamin D status does not predict sustained virologic response or fibrosis stage in chronic hepatitis C genotype 1 infection. J Hepatol. 2013;58(3):467–472. doi:10.1016/j.jhep.2012.11.017
48. Belle A, Gizard E, Conroy G, et al. 25-OH vitamin D level has no impact on the efficacy of antiviral therapy in naive genotype 1 HCV-infected patients. United European Gastroenterol J. 2017;5(1):69–75. doi:10.1177/2050640616640157
49. Terrier B, Carrat F, Geri G, et al. Low 25-OH vitamin D serum levels correlate with severe fibrosis in HIV-HCV co-infected patients with chronic hepatitis. J Hepatol. 2011;55(4):756–761. doi:10.1016/j.jhep.2011.01.041
50. Schreiber J, Moreno C, Garcia BG, et al. Meta-analysis: the impact of IL28B polymorphisms on rapid and sustained virological response in HCV-2 and −3 patients. Aliment Pharmacol Ther. 2012;36(4):353–362. doi:10.1111/j.1365-2036.2012.05197.x
51. Swiątek BJ. Is interleukin-10 gene polymorphism a predictive marker in HCV infection? Cytokine Growth Factor Rev. 2012;23(1–2):47–59. doi:10.1016/j.cytogfr.2012.01.005
52. Thompson AJ, Santoro R, Piazzolla V, et al. Inosine triphosphatase genetic variants are protective against anemia during antiviral therapy for HCV2/3 but do not decrease dose reductions of RBV or increase SVR. Hepatology (Baltimore, Md). 2011;53(2):389–395. doi:10.1002/hep.24068
53. Cheng JB, Levine MA, Bell NH, Mangelsdorf DJ, Russell DW. Genetic evidence that the human CYP2R1 enzyme is a key vitamin D 25-hydroxylase. Proc Natl Acad Sci USA. 2004;101(20):7711–7715. doi:10.1073/pnas.0402490101
54. Simon KC, Munger KL, Kraft P, Hunter DJ, De Jager PL, Ascherio A. Genetic predictors of 25-hydroxyvitamin D levels and risk of multiple sclerosis. J Neurol. 2011;258(9):1676–1682. doi:10.1007/s00415-011-6001-5
55. Hassanein SI, Abu El Maaty MA, Sleem HM, Gad MZ. Triangular relationship between single nucleotide polymorphisms in the CYP2R1 gene (rs10741657 and rs12794714), 25-hydroxyvitamin d levels, and coronary artery disease incidence. Biomarkers. 2014;19(6):488–492. doi:10.3109/1354750X.2014.939226
56. Nissen J, Vogel U, Ravn-Haren G, et al. Common variants in CYP2R1 and GC genes are both determinants of serum 25-hydroxyvitamin D concentrations after UVB irradiation and after consumption of vitamin D(3)-fortified bread and milk during winter in Denmark. Am J Clin Nutr. 2015;101(1):218–227. doi:10.3945/ajcn.114.092148
57. Duan L, Xue Z, Ji H, Zhang D, Wang Y. Effects of CYP2R1 gene variants on vitamin D levels and status: a systematic review and meta-analysis. Gene. 2018;678:361–369. doi:10.1016/j.gene.2018.08.056
58. El-Derany MO, Hamdy NM, Al-Ansari NL, El-Mesallamy HO. Integrative role of vitamin D related and Interleukin-28B genes polymorphism in predicting treatment outcomes of Chronic Hepatitis C. BMC Gastroenterol. 2016;16:19. doi:10.1186/s12876-016-0440-5
59. Dill MT, Makowska Z, Trincucci G, et al. Pegylated IFN-alpha regulates hepatic gene expression through transient Jak/STAT activation. J Clin Invest. 2014;124(4):1568–1581. doi:10.1172/JCI70408
60. Matsumura T, Kato T, Sugiyama N, et al. 25-hydroxyvitamin D3 suppresses hepatitis C virus production. Hepatology (Baltimore, Md). 2012;56(4):1231–1239. doi:10.1002/hep.25763
61. Murayama A, Saitoh H, Takeuchi A, et al. Vitamin D derivatives inhibit hepatitis C virus production through the suppression of apolipoprotein. Antiviral Res. 2018;160:55–63. doi:10.1016/j.antiviral.2018.10.014
62. Abu-Mouch S, Fireman Z, Jarchovsky J, Zeina AR, Assy N. Vitamin D supplementation improves sustained virologic response in chronic hepatitis C (genotype 1)-naive patients. World J Gastroenterol. 2011;17(47):5184–5190. doi:10.3748/wjg.v17.i47.5184
63. Yokoyama S, Takahashi S, Kawakami Y, et al. Effect of vitamin D supplementation on pegylated interferon/ribavirin therapy for chronic hepatitis C genotype 1b: a randomized controlled trial. J Viral Hepat. 2014;21(5):348–356. doi:10.1111/jvh.12146
64. Gal-Tanamy M, Bachmetov L, Ravid A, et al. Vitamin D: an innate antiviral agent suppressing hepatitis C virus in human hepatocytes. Hepatology (Baltimore, Md). 2011;54(5):1570–1579. doi:10.1002/hep.24575
65. Carlberg C, Haq A. The concept of the personal vitamin D response index. J Steroid Biochem Mol Biol. 2018;175:12–17. doi:10.1016/j.jsbmb.2016.12.011
 © 2020 The Author(s). This work is published and licensed by Dove Medical Press Limited. The
full terms of this license are available at https://www.dovepress.com/terms
and incorporate the Creative Commons Attribution
- Non Commercial (unported, 3.0) License.
By accessing the work you hereby accept the Terms. Non-commercial uses of the work are permitted
without any further permission from Dove Medical Press Limited, provided the work is properly
attributed. For permission for commercial use of this work, please see paragraphs 4.2 and 5 of our Terms.
© 2020 The Author(s). This work is published and licensed by Dove Medical Press Limited. The
full terms of this license are available at https://www.dovepress.com/terms
and incorporate the Creative Commons Attribution
- Non Commercial (unported, 3.0) License.
By accessing the work you hereby accept the Terms. Non-commercial uses of the work are permitted
without any further permission from Dove Medical Press Limited, provided the work is properly
attributed. For permission for commercial use of this work, please see paragraphs 4.2 and 5 of our Terms.