Back to Journals » Diabetes, Metabolic Syndrome and Obesity » Volume 13
Relationship of Two-Hour Plasma Glucose and Abdominal Visceral Fat with Bone Mineral Density and Bone Mineral Content in Women with Different Glucose Metabolism Status
Authors Jia X, Liu L, Wang R, Liu X, Liu B, Ma N, Lu Q
Received 7 January 2020
Accepted for publication 25 February 2020
Published 20 March 2020 Volume 2020:13 Pages 851—858
DOI https://doi.org/10.2147/DMSO.S245096
Checked for plagiarism Yes
Review by Single anonymous peer review
Peer reviewer comments 3
Editor who approved publication: Prof. Dr. Antonio Brunetti
Xiaojiao Jia, Lanxiang Liu, Rui Wang, Xiaoli Liu, Binbin Liu, Ning Ma, Qiang Lu
Department of Endocrinology, The First Hospital of Qinhuangdao, Qinhuangdao 066000, Hebei Province, People’s Republic of China
Correspondence: Qiang Lu
Department of Endocrinology, The First Hospital of Qinhuangdao, No. 258 Wenhua Road, Qinhuangdao 066000, Hebei Province, People’s Republic of China
Tel +86-335-5908368
Fax +86-335-3032042
Email [email protected]
Background: Several studies have reported the relationship of diabetes mellitus (DM) and obesity with bone mineral density (BMD), but the conclusions remain unclear. This study aimed to provide more information for the relationship of plasma glucose and abdominal visceral fat (AVF) with BMD and bone mineral content (BMC) in women with different glucose metabolism status.
Methods: Patients were screened by oral glucose tolerance test (OGTT) and were divided into three groups: normal glucose tolerance (NGT, n=132), pre-diabetes mellitus (pre-DM, n=28) and newly diagnosed type 2 DM (T2DM, n=27) groups. Plasma glucose concentrations, anthropometric measurements, body composition, and BMD were measured. Analysis of variance (ANOVA), pearson correlation, and multiple linear regression models were used to evaluate the relationship between BMD, plasma glucose, AVF, and other variables.
Results: The percentage of subjects with osteoporosis or low BMD was 29.9%, and 66.7% subjects in T2DM group were significantly higher than that in the pre-DM (28.6%) and NGT (22.7%) groups (p=0.005 and p< 0.001, respectively). Both BMD at femoral neck (FN) and lumbar spine (LS) of T2DM group were lower than those in NGT group (p=0.009 and p=0.003, respectively), and BMC of T2DM group was lower than those of NGT and pre-DM groups (p< 0.001). The results of statistical analysis revealed that both two-hour plasma glucose (2-h PG) and age showed negative correlation with BMC, FN BMD, and LS BMD. AVF showed positive correlation with BMC and LS BMD. Furthermore, the lean mass (LM) showed independent positive effects on BMC.
Conclusion: Our findings suggest that 1) Age is a strong negative predictor of bone mass. 2) A direct negative effect of increasing 2-h PG might be more prominent at bone mass in women. 3) A moderate increase in AVF is beneficial to bone mass, while excessive increase might be harmful. 4) LM is a positive predictor of BMC.
Keywords: abdominal visceral fat, abnormal glucose metabolism, two-hour plasma glucose, bone mineral density, bone mineral content
Background
Diabetes mellitus, obesity, and osteoporosis have become chronic epidemic diseases worldwide, and are posing serious threat to the public health. But the relationship of DM and obesity with BMD remains unclear in previous studies.
The effects of T2DM on bones are complicated.1 T2DM and low body mass index (BMI) have been identified as risk factors for osteoporosis.2 Currently, it has been recognized that patients with T2DM were associated with higher risk of fractures than non-diabetic patients,3 BMD was associated with glucose metabolism.4,5 Another study has also revealed the differences in the blood glucose levels among osteoporosis, low BMD, and normal BMD groups.6 However, there was a study showed the detection rates of low BMD and osteoporosis have no significant differences among different glucose metabolism groups.7 Meta-analysis results also indicated that abnormal glucose metabolism showed no significant correlation with BMD or bone metabolism.8
The effect of obesity on BMD is associated with varied factors, but the relationship between obesity and osteoporosis still remains to be controversial,9 and it is inconclusive whether obesity increases or decreases BMD. Research indicated obesity as one of the protective factors of bones,10 body mass has beneficial effects on the mechanical load during bone formation.11 Epidemiological studies have also confirmed the positive relationship between obesity and bone health.12 However, there are also different opinions showed that AVF induces OP, excessive fat, especially the visceral fat, might be a risk factor for bone loss, increasing the fractures associated with obesity.13–15 In addition, visceral fat affects human metabolism by secreting a variety of fat factors, including the effect on bones, which might be used to explain the complex correlation between adipose tissue and bone tissue.
Hence, we intended to analyze BMD in adult women with different plasma glucose levels and AVF status, to provide more information for the relationship of PG and AVF with BMD and BMC. Sex hormones play a critical role in bone remodeling. In order to reduce the influence of gender differences on the research results, only women were included in this study.
Methods
Subjects
This study involved 187 individuals who are referred to the Physical Examination Centre of the First Hospital of Qinhuangdao. Inclusion criteria included female individuals aged ≥18 years, with Chinese ethnicity.
The medical history of these individuals was collected. The exclusion criteria were as follows: individuals with ongoing inflammation (last longer than three month), cardiovascular disease, tumors, significant liver disease (levels of liver enzymes are elevated more than three times), creatinine clearance of <30 mL/min, autoimmune diseases (such as rheumatoid arthritis), previous pathological fractures, smoking, and intake of medicines that could affect bone mass (such as bisphosphonates, calcitonin, estrogens, vitamin D, and glucocorticoids).
OGTT
The subjects were divided into three groups, pre-DM, and T2DM were according to the 1998 Standards of the World Health Organization (WHO).16 Thus, patients meeting either of the following criteria could be diagnosed as having T2DM: (i) fasting plasma glucose (FPG) ≥ 125 mg/dL (7.0 mmol/L), where fasting is defined as no caloric intake for at least 8 h or (ii) two-hour post-load plasma glucose ≥200 mg/dL (11.1 mmol/L) during an OGTT. Additionally, patients meeting either of the following standards were diagnosed as having pre-DM: (i) FPG ≥110 mg/dL (6.1 mmol/L) and <125 mg/dL (7.0 mmol/L); or (ii) two-hour post-load plasma glucose ≥140 mg/dL (7.8 mmol/L) and <200 mg/dL (11.1 mmol/L) during an OGTT. Plasma glucose (PG, mmol/L) was tested using an automatic analyzer (7600 series; Hitachi, Tokyo, Japan). T2DM patients were all newly diagnosed and had not received lifestyle interventions or insulin treatment.
Anthropometric Measurements
Anthropometric measurements, including height, weight, neck circumference (NC), waist circumference (WC), hip circumference (HC), and blood pressure, were obtained when the subjects were in light clothing and not wearing shoes. WC was accurately measured at the level of midway between the lowest rib and the top of the iliac crest. Blood pressure was measured twice using a mercury sphygmomanometer after 10 min of rest while the subjects were seated, and the average of the two measurements was used for analysis. BMI was calculated by dividing weight (kg) by height squared (m2).
Body Composition and Bone Density Assessment
AVF was measured using a 1.5-T MRI scanner (Signa; GE Medical Systems, Milwaukee, WI, USA). A single MRI slice at the navel level of L4/L5 intervertebral spaces17 was obtained using water-suppressed T1-weighted imaging sequences (repetition time = 600 ms, echo time = 13 ms). The AVF area was quantified using the area measurement tool of Advantage Workstation 4.2 (GE Healthcare Technologies, Milwaukee, WI, USA). Abdominal obesity was defined as an AVF area of ≥100 cm2.18
The total body LM, FM, bone mineral content (BMC), BMD at FN and LS (L1-L4), and left hip (LH) were assessed using DXA (Hologic-4500 densitometer, Hologic, Inc., Waltham, Massachusetts, USA). DXA was performed by a well-trained professional.
Osteoporosis and low BMD were defined in the present study using the WHO criteria.19 Specifically, osteoporosis was defined as a T-score ≤ −2.5 at either the FN or the LS, low BMD was defined as those with T-scores between −1.0 and −2.5 at either skeletal site in postmenopausal women. And a Z-score of –2.0 or lower is defined as either “low BMD for chronological age” in premenopausal women.
Statistical Analysis
All analyses were performed using SPSS 13.0 statistical software. All of the numerical variables were normally distributed and reported as means ± standard deviation. Comparisons were conducted between the three groups using ANOVA. Post hoc tests were conducted by Student–Newman–Keuls (S–N–K) test. Comparison of data prevalence was performed by chi-square analysis. To measure the strength of the association between the two variables, Pearson correlation coefficient was used. Three multiple linear regression models were used to evaluate the relationships between BMD, plasma glucose, AVF, and other variables (stepwise method). In model 1, age, weight, BMI, fasting plasma glucose (FPG), 2-h PG level from OGTT, WC, HC, AVF, LM, and FM were used as independent variables, and BMC was used as dependent variable. In models 2 and 3, BMC was replaced by BMD at FN and LS, respectively. P<0.05 was considered to be statistically significant. The statistical power was nearly 0.7 processed by PASS 11.0 statistical software.
Declarations
This study was conducted in accordance with the Declaration of Helsinki. This study was approved by the ethics committee of the First Hospital of Qinhuangdao (ethical approval number:2018H010). Written informed consent was obtained from all subjects/patients.
Results
Among the study subjects, 29.9% had low BMD or osteoporosis. The prevalence of low BMD or osteoporosis was significantly higher in T2DM (66.7%) than in NGT and pre-DM groups (p < 0.001), but was similar between NGT and pre-DM (NGT 22.7% vs pre-DM 28.6%).
The information regarding age, as well as anthropometric, biochemical, and body composition are presented in Table 1. Age was similar among the three groups (p=0.936). BMI, WC, and LM were significantly higher in the T2DM group than in the NGT group (p< 0.001). BMD at FN and LS in the T2DM group was significantly lower when compared to NGT group (p=0.009 and p=0.003, respectively). FPG, 2-h PG, AVF were higher, and BMC was lower in T2DM group than in NGT and pre-DM groups (p<0.001). Furthermore, BMI, 2-h PG, WC, AVF, LM were significantly higher in the pre-DM group than NGT group (p<0.001).
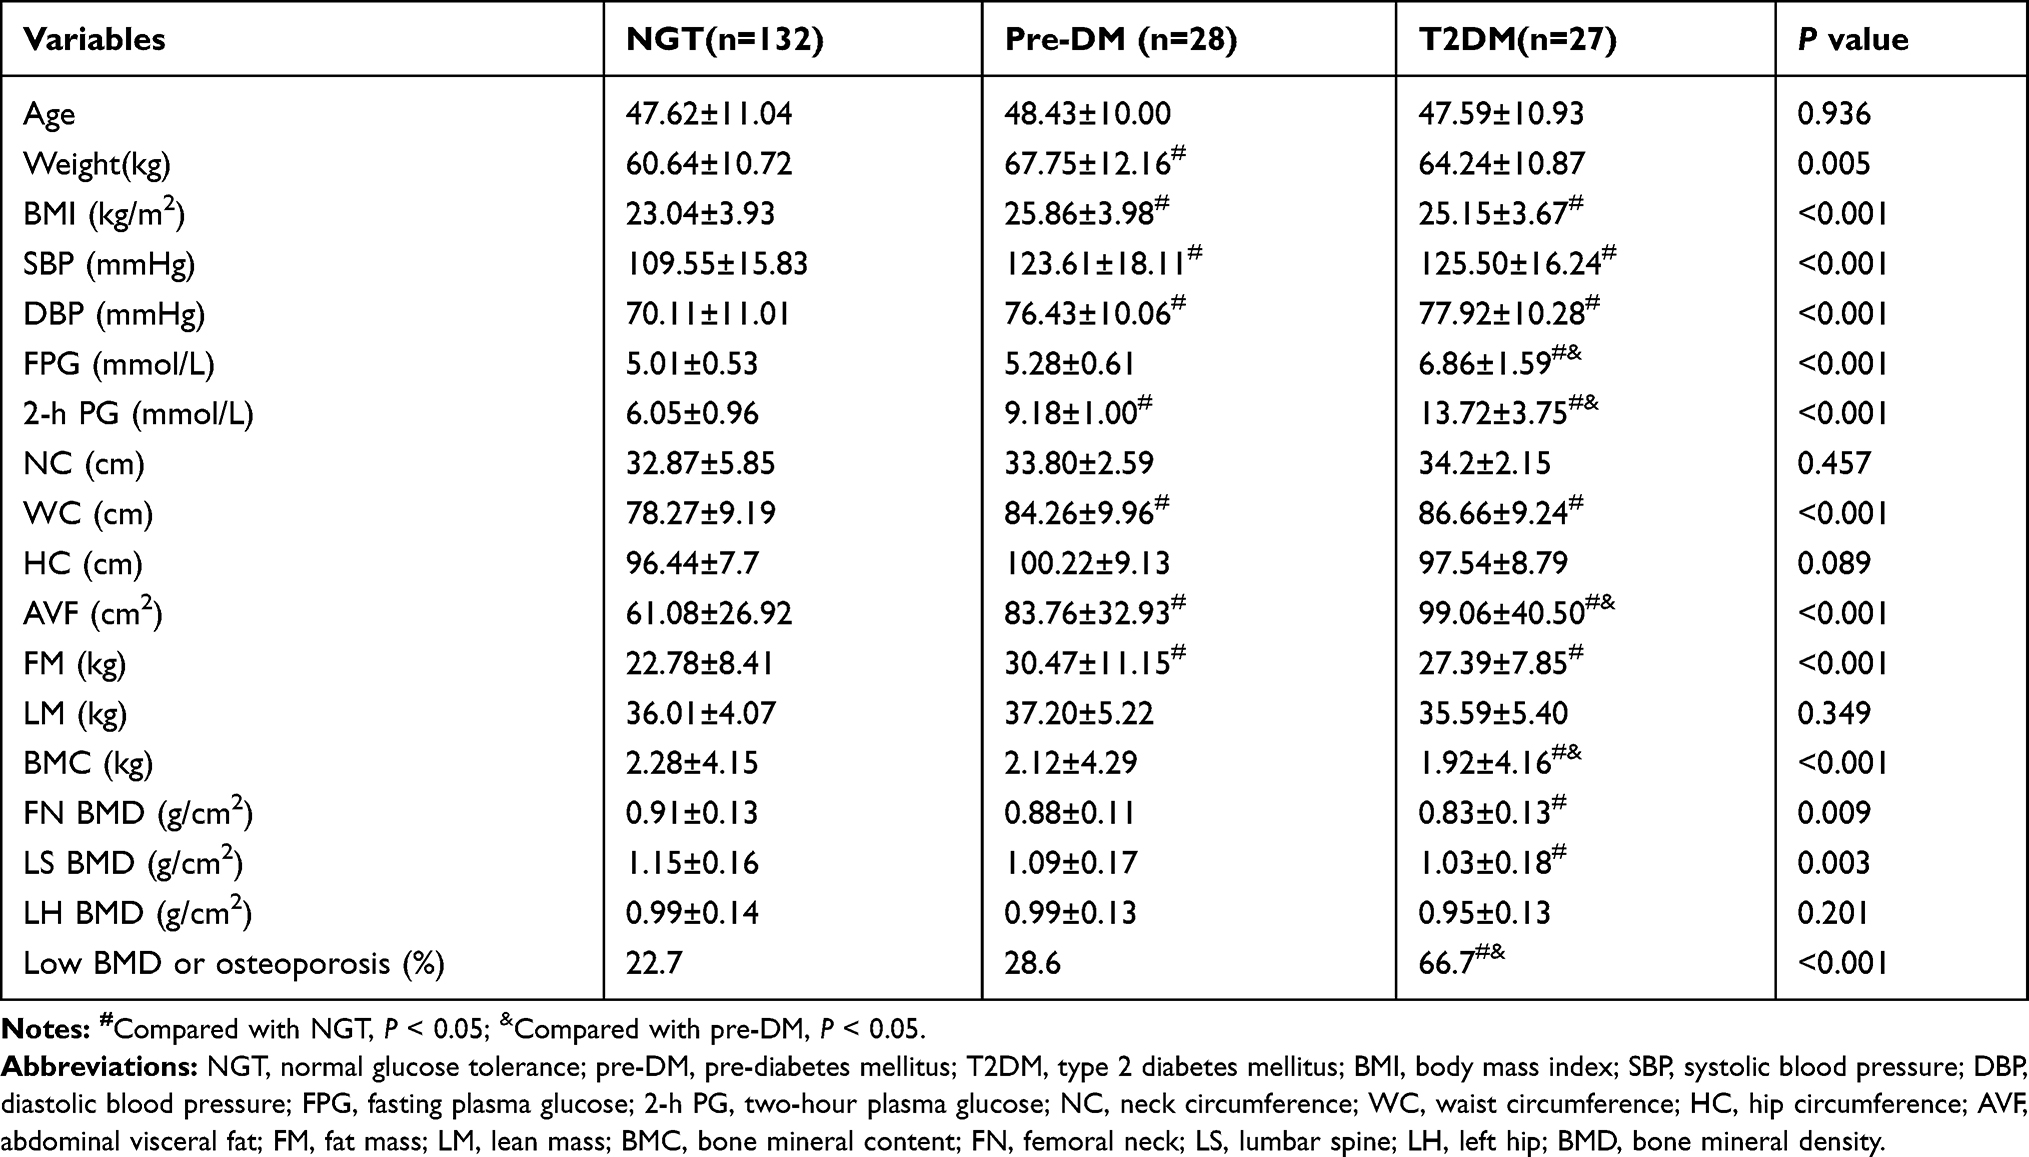 |
Table 1 Clinical, Laboratory, and Anthropometric Characteristics of 187 Subjects and Their Comparisons in Three Groups |
The correlation coefficients between BMC, FN BMD, LS BMD, and other variables in all subjects are shown in Table 2. WC showed positive correlation with BMC (r=0.233, p=0.001), FN BMD (r=0.203, p=0.001). LM showed positive correlation with BMC (r=0.624, p<0.001), FN BMD (r=0.343, p<0.001), LS BMD (r=0.269, p<0.001). Age showed negative correlation with BMC (r=−0.366, p<0.001), FN BMD (r=−0.403, p<0.001), LS BMD (r=−0.451, p<0.001). And 2-h PG showed negative correlation with BMC (r=−0.296, p<0.001), FN BMD (r=−0.236, p=0.001), LS BMD (r=−0.287, p<0.001). Although the results of univariate correlation analysis showed no correlation between AVF and BMD or BMC in the overall subjects, AVF showed positive correlation with BMC (r=0.437, p=0.025) in the T2DM group.
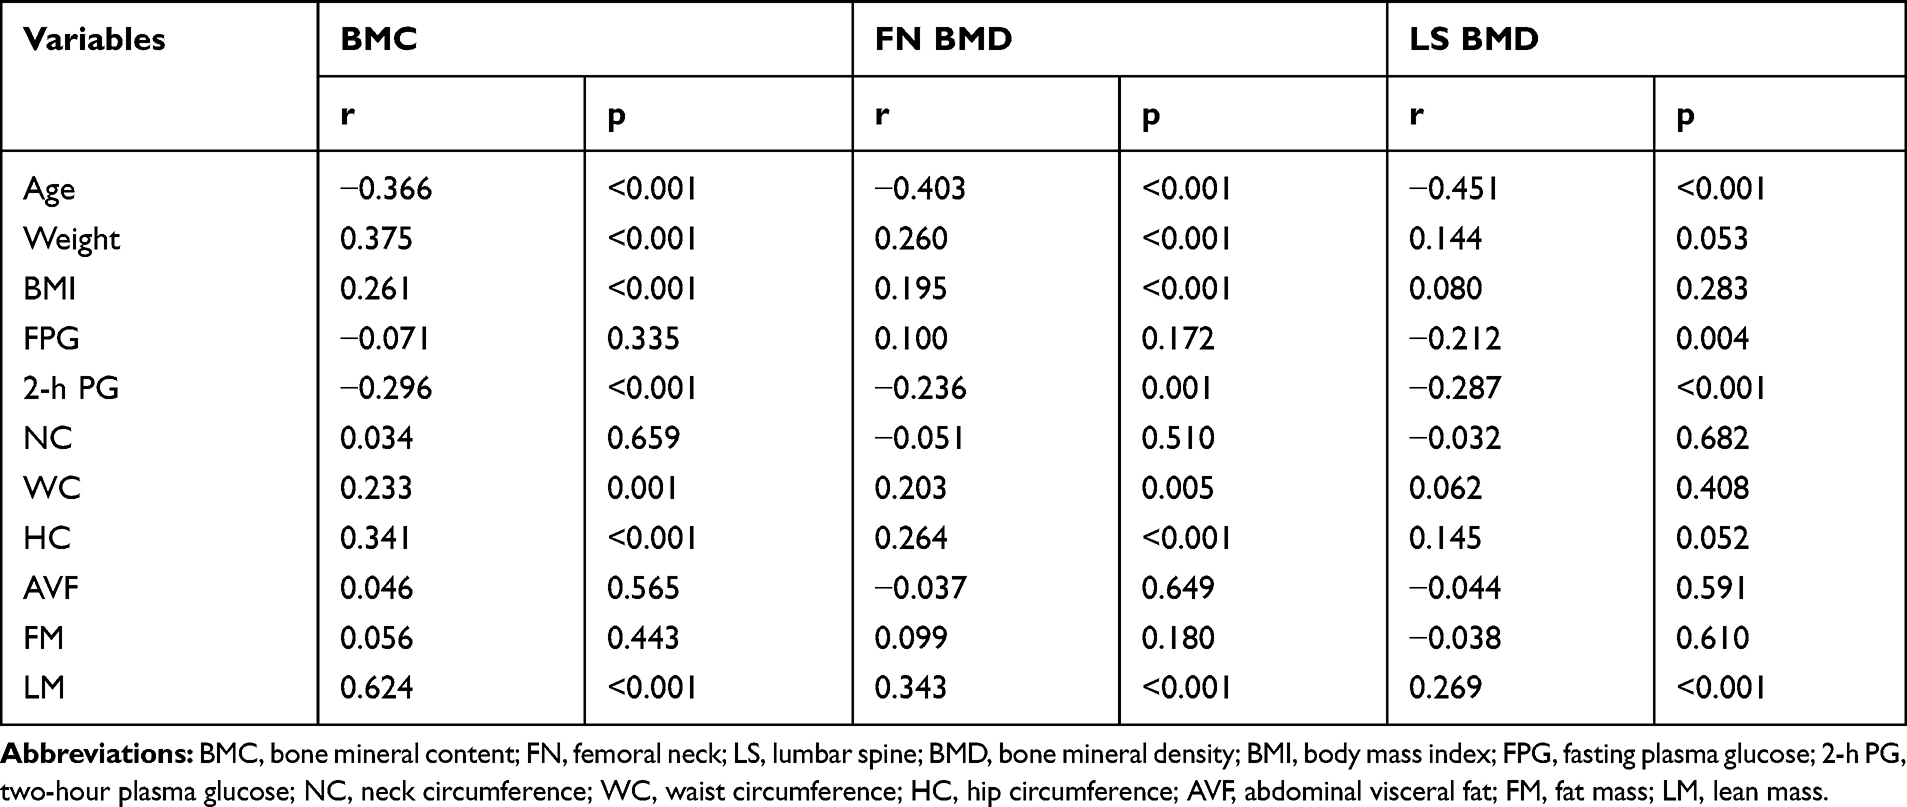 |
Table 2 Simple Correlations Between BMC, FN BMD, LS BMD, and Age, Glucose, Body Composition Variables in the Study Subjects |
The results of regression analysis showed that LM, age, 2-h PG, and AVF demonstrated an independent association with BMC (Model 1, R2 = 0.550, F= 45.145, p<0.001) (Table 3). Age, 2-h PG and WC showed independent association with FN BMD (Model 2, R2 = 0.346, F= 19.569, p<0.001) (Table 4). Age, 2-h PG, and AVF were independently associated with LS BMD (Model 3, R2 = 0.362, F= 20.554, p<0.001) (Table 5). Because of the age variable has a significant effect on multivariate analysis, three new regression models that eliminated the variable “age” were operated. The results of these new regression analyses excluded the effect of AVF and WC on BMC or BMD, but still showed negative effects of 2-h PG on BMC and BMD, and LM was still positively correlated with BMC. Hence, age, 2-h PG, AVF, WC, and LM were considered as important determinants of BMC or BMD after adjusting for the age variable in this study.
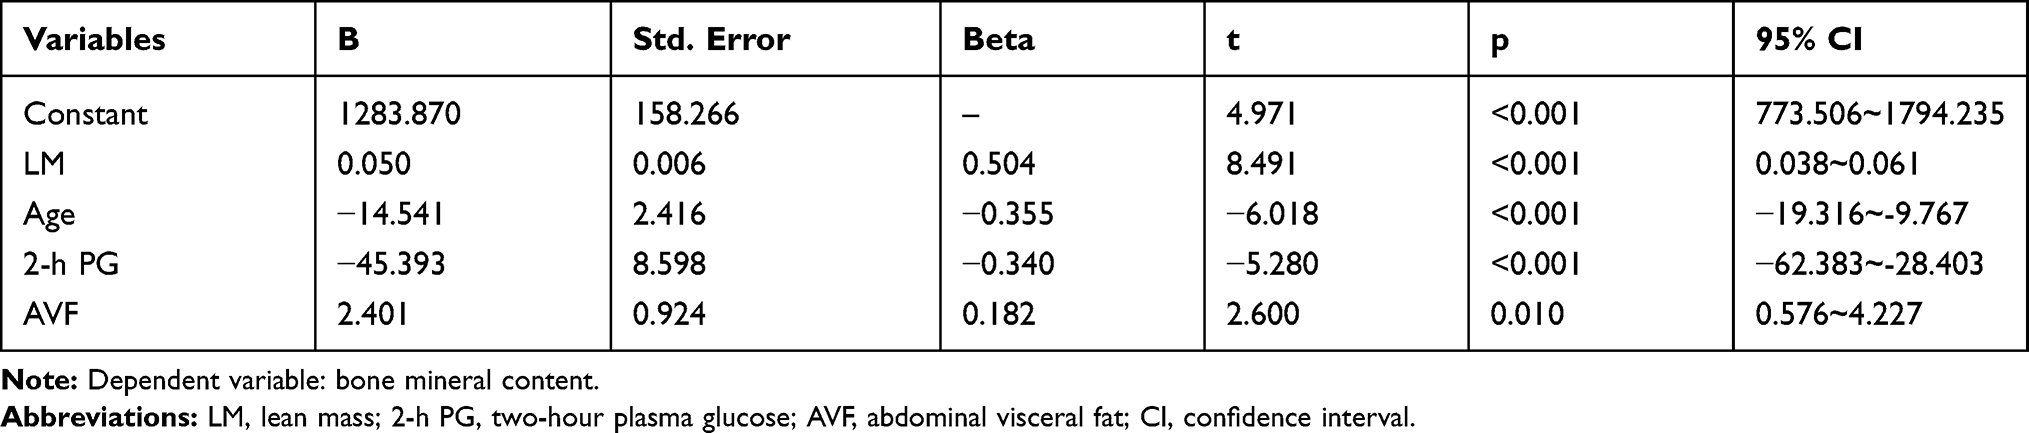 |
Table 3 Multiple Linear Regression Analysis for BMC |
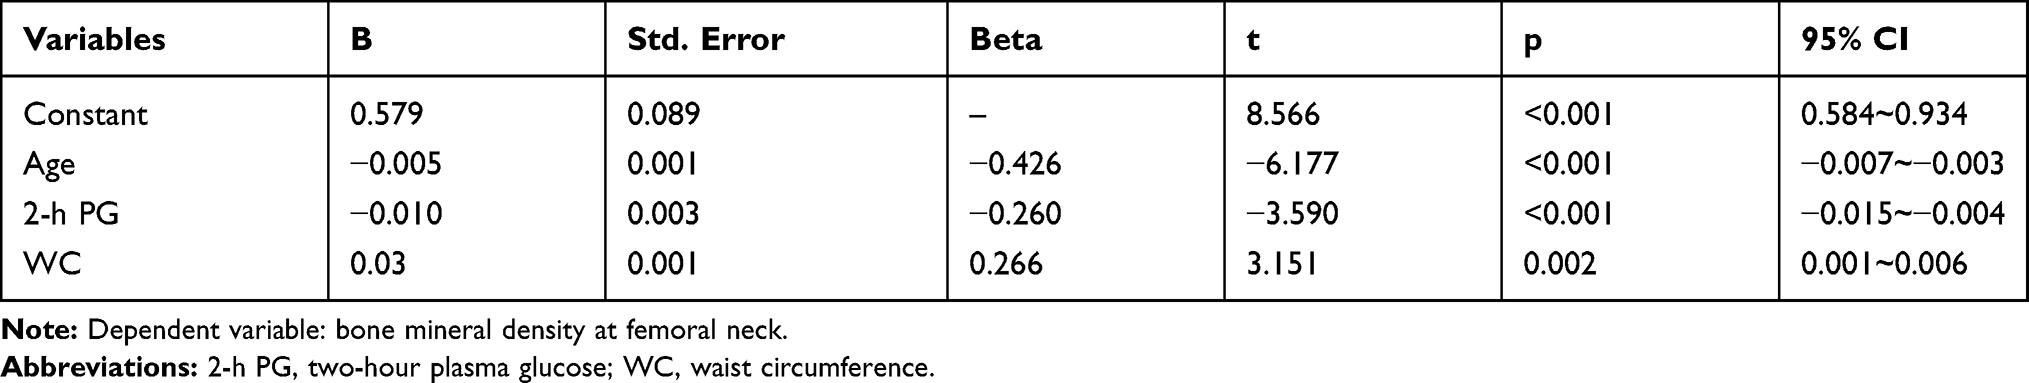 |
Table 4 Multiple Linear Regression Analysis for BMD at Femoral Neck |
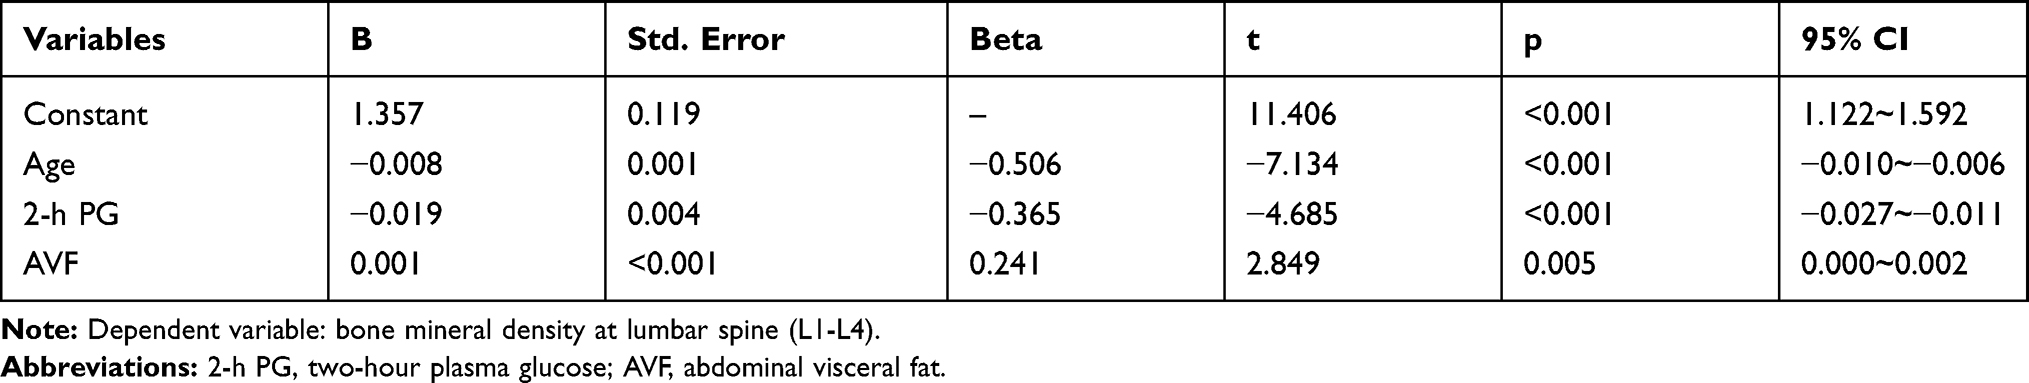 |
Table 5 Multiple Linear Regression Analysis for BMD at Lumbar Spine (L1-L4) |
Discussion
In the present study, there was no significant difference in baseline age among the three groups. Univariate analysis showed that age was negatively correlated with BMC (r=−0.366, p<0.001), FN BMD (r=−0.403, p<0.001), and LS BMD (r=−0.451, p<0.001). After adjusting some influential factors, multivariate regression analysis revealed age was independently correlated with BMC, FN BMD, and LS BMD. Hence, age undoubtedly showed a negative effect on BMD, and this was consistent with the results reported previously. Previous study indicated that bone mass reaching peak in women aged 30~39 years, and the age at 40~59 years is the range at which menopause, obesity, and many other related diseases commonly occur, and so this age is regarded as the beginning of bone aging.20,21 As we have known, hormones levels vary with age, both age and hormones levels affect bone metabolism. It was indicated that osteoporosis is an inevitable outcome if humans live long enough.
We collected and analyzed plasma glucose levels data, and revealed that the prevalence of low BMD or osteoporosis was 66.7% in the T2DM group, 28.6% in the pre-DM group and 22.7% in the NGT group. Previous studies showed that T2DM population has a higher BMD, but also has a higher risk of overall fracture and hip fracture when compared with non-diabetic patients.3,22,23 However, T2DM demonstrated additional harmful effects, which might be related to high blood glucose levels, change in insulin levels and increased obesity rate. These abnormalities might affect bone metabolism indexes by different mechanisms.24 This study showed that FN BMD (0.83±0.13), LS BMD (1.03±0.18) and BMC (1.92±4.16) in T2DM group were lower than those of FN BMD (0.91±0.13), LS BMD (1.15±0.16), and BMC (2.12±4.29) in NGT group. And the BMC was also lower in T2DM group than pre-DM group (2.28±4.15). These results might be related to the increased plasma glucose levels and duration of the disease.3 Furthermore, the results of statistical analysis revealed that 2-h PG was negatively correlated with BMC, FN BMD, and LS BMD. Studies on mechanisms of glucose affecting bone mass showed that advanced glycation end-products (AGEs),25 the polyol pathway,26 insulin resistance,27 oxidative stress, inflammation, and the production of ROS, which have adverse effects on bone.28 In short, this study highlighted the significant negative impact of 2-h PG on BMD.
The easy-to-obtain anthropometric parameters, such as weight, BMI, WC, HC, NC, etc., are indicators that represent obesity in some aspects. The above parameters were collected and analyzed, but the results showed only the effect of WC on FN BMD. This might be because that abdominal obesity has more significant effect on bone metabolism among obese people, while WC as an index for evaluating abdominal obesity is more reliable than other parameters.29–31 Our data showed that WC in T2DM and pre-DM groups were higher than that in NGT group, and WC was positively correlated with BMC (r=0.233, p=0.001) and FN BMD (r=0.203, p=0.001). Regression analysis also suggested that WC had a positive effect on FN BMD.
Compared with WC, AVF is regarded as a gold standard for evaluating abdominal obesity.32 Data analysis results showed that the AVF area was gradually increased from NGT group, pre-DM group to T2DM, and the differences were statistically significant (99.06±40.50 vs 83.76±32.93 vs 61.08±26.92). Although the results of univariate correlation analysis showed no correlation between AVF and BMD or BMC in the overall subjects, AVF was positively correlated with BMC (r=0.437, p=0.025) in the T2DM group. Further regression analysis indicated that AVF still demonstrated independent positive effects on BMC and LS BMD. There were studies found that AVF had a negative impact on BMD, it is regarded as a risk factor for bone loss and increased obese fractures.12–15 Studies showed that adipose tissue showed a positive effect on bones only through mechanical loading,33 while the others are more complex non-weight-bearing effects.34 Furthermore, epidemiological studies have found adipose tissue showing a positive correlation with BMD and BMC.35–37 In contrast, previous studies found that adipose tissue was positively correlated with BMC,38 but excessive adipose tissue could lead to decreased BMC,39 and adipose tissue at different parts might exert different effects on bone.33 Our results showed positive effects on BMC and LS BMD, which might be due to that a certain range of increase in AVF might have a positive impact on BMD, while an excessive increased AVF might lead to a negative effect.33 In addition, the adipose tissue, especially the visceral fat not only affects the homeostasis of the body’s energy but also affects other processes including bone metabolism by releasing a variety of adipokines. This might be used to explain the complex correlation between adipose tissue and bone tissue.11,23,40
This study also measured LM data using DXA. LM has been widely reported as a protective factor for BMD due to its mechanical traction on bones.41 Our results showed that LM alone has positive effect on BMC. Univariate correlation analysis showed positive correlation of LM with BMC (r=0.624, p<0.001), FN BMD (r=0.343, p<0.001) and LS BMD (r=0.269, p<0.001). Moreover, regression analysis also confirmed the correlation between LM and BMC, which was consistent with the results reported previously. Therefore, we confirm that LM is a positive predictor of BMC.
Conclusions
In conclusion, our findings suggest that age is a strong negative predictor of bone mass. We observed a significant negative effect of 2-h PG that was more pronounced at bone mass in women. Thirdly, the effect of AVF on bone mass might be related to the extent of its increase, a moderate increase in AVF is beneficial to bone mass, while excessive increase remains harmful, which needs to be further studied. Lastly, we confirm that LM is a positive predictor of BMC.
However, there were certain limitations in the current study. This study involves a cross-sectional design, limiting our ability to prove the causality. It also involves small population, which limits the statistical power and lacks more comprehensive clinical information (such as family history, physical activity, and dietary habits). In addition, menopausal women were not stratified for analysis due to inclusion of sample size.
Abbreviation
BMD, bone mineral density; BMC, bone mineral content; AVF, abdominal visceral fat; OGTT, oral glucose tolerance test; NGT, normal glucose tolerance; DM, diabetes mellitus; BMI, body mass index; SBP, systolic blood pressure; DBP, diastolic blood pressure; FPG, fasting plasma glucose; 2-h PG, two-hour plasma glucose; NC, neck circumference; WC, waist circumference; HC, hip circumference; FN, femoral neck; LS, lumbar spine; LH, left hip; FM, fat mass; LM, lean mass; ANOVA, analysis of variance; S–N–K, Student–Newman–Keuls; CI, confidence interval.
Author Contributions
All authors contributed to data analysis, drafting and revising the article, gave final approval of the version to be published, and agree to be accountable for all aspects of the work.
Disclosure
The authors report no conflicts of interest in this work.
References
1. Heilmeier U, Patsch JM. Diabetes and bone. Semin Musculoskelet Radiol. 2016;20:300–304. doi:10.1055/s-0036-1592366
2. Research CSOO. Guidelines for the diagnosis and management of primary osteoporosis (2017). J Osteoporos. 2019;25:281–309.
3. Napoli N, Chandran M, Pierroz DD, Abrahamsen B, Schwartz AV, Ferrari SL. Mechanisms of diabetes mellitus-induced bone fragility. Nat Rev Endocrinol. 2017;13:208–219. doi:10.1038/nrendo.2016.153
4. Barroso LN, Farias DR, Soares-mota M, et al. Waist circumference is an effect modifier of the association between bone mineral density and glucose metabolism. Arch Endocrinol Metab. 2018;62:285–295. doi:10.20945/2359-3997000000040
5. Kim SM, Cui J, Rhyu J, et al. Association between site-specific bone mineral density and glucose homeostasis and anthropometric traits in healthy men and women. Clin Endocrinol (Oxf). 2018;88:848–855. doi:10.1111/cen.13602
6. Gu LJ, Lai XY, Wang YP, Zhang JM, Liu JP. A community-based study of the relationship between calcaneal bone mineral density and systemic parameters of blood glucose and lipids. Medicine (Baltimore). 2019;98:e16096. doi:10.1097/MD.0000000000016096
7. Liu M, Lu Y, Cheng X, et al. Relationship between abnormal glucose metabolism and osteoporosis in Han Chinese men over the age of 50 years. Clin Interv Aging. 2019;14:445–451. doi:10.2147/CIA.S164021
8. Qu Y, Kang MY, Dong RP, Zhao JW. Correlations between abnormal glucose metabolism and bone mineral density or bone metabolism. Med Sci Monit. 2016;22:824–832. doi:10.12659/MSM.895387
9. Liu YH, Xu Y, Wen YB, et al. Association of weight-adjusted body fat and fat distribution with bone mineral density in middle-aged chinese adults: a cross-sectional study. PLoS One. 2013;8:e63339. doi:10.1371/journal.pone.0063339
10. Ravn P, Cizza G, Bjarnason NH, et al. Low body mass index is an important risk factor for low bone mass and increased bone loss in early postmenopausal women. Early Postmenopausal Intervention Cohort (EPIC) study group. J Bone Miner Res. 1999;14:1622–1627. doi:10.1359/jbmr.1999.14.9.1622
11. Cao JJ. Effects of obesity on bone metabolism. J Orthop Surg Res. 2011;6:30. doi:10.1186/1749-799X-6-30
12. Lee SJ, Lee JY, Sung J. Obesity and bone health revisited: a Mendelian Randomization Study for Koreans. J Bone Miner Res. 2019;34:1058–1067. doi:10.1002/jbmr.3678
13. Bredella MA, Torriani M, Ghomi RH, et al. Determinants of bone mineral density in obese premenopausal women. Bone. 2011;48:748–754. doi:10.1016/j.bone.2010.12.011
14. Nielson CM, Marshall LM, Adams AL, et al. BMI and fracture risk in older men: the osteoporotic fractures in men study (MrOS). J Bone Miner Res. 2011;26:496–502. doi:10.1002/jbmr.235
15. Zhang P, Peterson M, Su GL, Wang SC. Visceral adiposity is negatively associated with bone density and muscle attenuation. Am J Clin Nutr. 2015;101:337–343. doi:10.3945/ajcn.113.081778
16. Alberti KG, Zimmet PZ. Definition, diagnosis and classification of diabetes mellitus and its complications. Part 1: diagnosis and classification of diabetes mellitus provisional report of a WHO consultation. Diabet Med. 1998;15:539–553. doi:10.1002/(ISSN)1096-9136
17. Thomas EL, Bell JD. Influence of undersampling on magnetic resonance imaging measurements of intra-abdominal adipose tissue. Int J Obes Relat Metab Disord. 2003;27:211–218. doi:10.1038/sj.ijo.802229
18. Zhang Y, Chen TW, Zhang XM, et al. Abdominal regional fat distribution on MRI correlates with cholecystolithiasis. PLoS One. 2014;9:e109776. doi:10.1371/journal.pone.0109776
19. Kanis JA, McCloskey EV, Johansson H, Oden A, Melton LR, Khaltaev N. A reference standard for the description of osteoporosis. Bone. 2008;42:467–475. doi:10.1016/j.bone.2007.11.001
20. Liu X, Zhou J, Sun S, et al. Body composition investigation of 2321 Shenzhen government and enterprise staffs. Wei Sheng Yan Jiu. 2016;45:24–28.
21. Chew CK, Clarke BL. Causes of low peak bone mass in women. Maturitas. 2018;111:61–68. doi:10.1016/j.maturitas.2017.12.010
22. Leslie WD, Morin SN, Majumdar SR, Lix LM. Effects of obesity and diabetes on rate of bone density loss. Osteoporos Int. 2018;29:61–67. doi:10.1007/s00198-017-4223-9
23. Walsh JS, Vilaca T. Obesity, type 2 diabetes and bone in adults. Calcif Tissue Int. 2017;100:528–535. doi:10.1007/s00223-016-0229-0
24. Sundararaghavan V, Mazur MM, Evans B, Liu J, Ebraheim NA. Diabetes and bone health: latest evidence and clinical implications. Ther Adv Musculoskelet Dis. 2017;9:67–74. doi:10.1177/1759720X16687480
25. Saito M, Fujii K, Mori Y, Marumo K. Role of collagen enzymatic and glycation induced cross-links as a determinant of bone quality in spontaneously diabetic WBN/Kob rats. Osteoporos Int. 2006;17:1514–1523. doi:10.1007/s00198-006-0155-5
26. Inaba M, Terada M, Nishizawa Y, et al. Protective effect of an aldose reductase inhibitor against bone loss in galactose-fed rats: possible involvement of the polyol pathway in bone metabolism. Metabolism. 1999;48:904–909. doi:10.1016/S0026-0495(99)90227-5
27. Shin D, Kim S, Kim KH, Lee K, Park SM. Association between insulin resistance and bone mass in men. J Clin Endocrinol Metab. 2014;99:988–995. doi:10.1210/jc.2013-3338
28. Lebovitz HE. Insulin secretagogues: old and new. Diabetes Rev. 1999;7:139–153.
29. Weiping J, Junxi L, Kunsan X, Yuqian B. Evaluation of abdominal visceral obesity from anthropometric parameters using receiver operating characteristic curves. Chin J Epidemioligy. 2002;23:20–23.
30. Yun-fei PU, Hong-bo HE, Zhi-gang Z, et al. Evaluation of visceral adipose in abdominal obesity and its clinical application. Natl Med J China. 2008;88:2391–2394.
31. Cui LH, Shin MH, Kweon SS, et al. Sex-related differences in the association between waist circumference and bone mineral density in a Korean population. BMC Musculoskelet Disord. 2014;15:326. doi:10.1186/1471-2474-15-326
32. von Eyben FE, Mouritsen E, Holm J, Dimcevski G, Montvilas P, Suciu G. Computed tomography scans of intra-abdominal fat, anthropometric measurements, and 3 nonobese metabolic risk factors. Metabolism. 2006;55:1337–1343. doi:10.1016/j.metabol.2006.05.019
33. Lv S, Zhang A, Di W, et al. Assessment of fat distribution and bone quality with Trabecular Bone Score (TBS) in Healthy Chinese Men. Sci Rep. 2016;6:24935. doi:10.1038/srep24935
34. Zhao LJ, Jiang H, Papasian CJ, et al. Correlation of obesity and osteoporosis: effect of fat mass on the determination of osteoporosis. J Bone Miner Res. 2008;23:17–29. doi:10.1359/jbmr.070813
35. Gonnelli S, Caffarelli C, Tanzilli L, et al. The associations of body composition and fat distribution with bone mineral density in elderly Italian men and women. J Clin Densitom. 2013;16:168–177. doi:10.1016/j.jocd.2012.02.013
36. Lekamwasam S, Weerarathna T, Rodrigo M, Arachchi WK, Munidasa D. Association between bone mineral density, lean mass, and fat mass among healthy middle-aged premenopausal women: a cross-sectional study in southern Sri Lanka. J Bone Miner Metab. 2009;27:83–88. doi:10.1007/s00774-008-0006-x
37. Cui LH, Shin MH, Kweon SS, et al. Relative contribution of body composition to bone mineral density at different sites in men and women of South Korea. J Bone Miner Metab. 2007;25:165–171. doi:10.1007/s00774-006-0747-3
38. Reid IR, Ames R, Evans MC, et al. Determinants of total body and regional bone mineral density in normal postmenopausal women–a key role for fat mass. J Clin Endocrinol Metab. 1992;75:45–51. doi:10.1210/jcem.75.1.1619030
39. Blum M, Harris SS, Must A, et al. Leptin, body composition and bone mineral density in premenopausal women. Calcif Tissue Int. 2003;73:27–32. doi:10.1007/s00223-002-1019-4
40. Huang BX, Zhu MF, Wu T, et al. Neck circumference, along with other anthropometric indices, has an independent and additional contribution in predicting fatty liver disease. PLoS One. 2015;10:e118071.
41. Capozza RF, Cointry GR, Cure-ramirez P, Ferretti JL, Cure-cure C. A DXA study of muscle-bone relationships in the whole body and limbs of 2512 normal men and pre- and post-menopausal women. Bone. 2004;35:283–295. doi:10.1016/j.bone.2004.03.010
 © 2020 The Author(s). This work is published and licensed by Dove Medical Press Limited. The
full terms of this license are available at https://www.dovepress.com/terms
and incorporate the Creative Commons Attribution
- Non Commercial (unported, 3.0) License.
By accessing the work you hereby accept the Terms. Non-commercial uses of the work are permitted
without any further permission from Dove Medical Press Limited, provided the work is properly
attributed. For permission for commercial use of this work, please see paragraphs 4.2 and 5 of our Terms.
© 2020 The Author(s). This work is published and licensed by Dove Medical Press Limited. The
full terms of this license are available at https://www.dovepress.com/terms
and incorporate the Creative Commons Attribution
- Non Commercial (unported, 3.0) License.
By accessing the work you hereby accept the Terms. Non-commercial uses of the work are permitted
without any further permission from Dove Medical Press Limited, provided the work is properly
attributed. For permission for commercial use of this work, please see paragraphs 4.2 and 5 of our Terms.