")
Back to Journals » Clinical Interventions in Aging » Volume 18
Relationship of Frailty with Kidney Function in Adults More Than 60-Years-Old: Effect of Using Different Formulas to Estimate Glomerular Filtration Rate
Authors Shi X , Wang S , Hu J, Chen F, Zhang H, Yang Y, Li X, Ma Q
Received 18 February 2023
Accepted for publication 8 June 2023
Published 27 June 2023 Volume 2023:18 Pages 999—1007
DOI https://doi.org/10.2147/CIA.S409140
Checked for plagiarism Yes
Review by Single anonymous peer review
Peer reviewer comments 2
Editor who approved publication: Dr Zhi-Ying Wu
Xiaotian Shi, Shan Wang, Jieqiong Hu, Fei Chen, Heng Zhang, Yifan Yang, Xv Li, Qing Ma
Department of Geriatrics, Beijing Friendship Hospital, Capital Medical University, Beijing, People’s Republic of China
Correspondence: Qing Ma, Email [email protected]
Objective: Determine the relationship of renal function with frailty using different formulas for estimated glomerular filtration rate (eGFR).
Methods: Individuals who were 60-years-old or more (n=507) were recruited from August 2020 to June 2021, and the FRAIL scale was used to classify them as non-frail or frail. The three equations used to compute the eGFR were based on serum creatinine (eGFRcr), cystatin C (eGFRcys), or SCr+CysC (eGFRcr-cys). Renal function was classified using eGFR and defined as normal (≥ 90 mL/min/1.73m2), mild damage (59– 89 mL/min/1.73m2), or moderate damage (≤ 60 mL/min/1.73m2). The relationship of frailty with renal function was analyzed. A subset of participants (n=358) was used to analyze changes in eGFR from 1 January 2012 to 31 December 2021 according to frailty and using the different eGFR equations.
Results: There were significant differences between the eGFRcr-cys and eGFRcr values in the frail group (P< 0.05), but not the non-frail group; however, the differences between the eGFRcr-cys and eGFRcys values were significant in the frail and non-frail groups (P< 0.001). Based on each eGFR equation, the prevalence of frailty increased as eGFR decreased (P< 0.001), but there was no significant relationship after adjusting for age or the age-adjusted Charlson co-morbidity index. There were temporal declines in eGFR in all three frailty groups (robust, pre-frail, and frail), especially in the frail group (2.226 mL/min/1.73m2 per year; P< 0.001).
Conclusion: For older individuals who are frail, the eGFRcr value may not provide accurate estimates of renal function. Frailty is associated with a rapid decline in kidney function.
Keywords: elderly, frailty, kidney function, serum creatinine, cystatin C
Introduction
Chronic kidney disease (CKD) has become a serious public health problem, and the average worldwide prevalence was 13.4% in 2019.1 The Sixth China Chronic Disease and Risk Factor Surveillance reported the prevalence of CKD in China was 8.2% in 2018 and 2019, but there are low rates of awareness, treatment, and compliance in China.2,3 Because of the progressive aging of populations in China and throughout the world, increasing percentages of the elderly are suffering from CKD, and the prevalence is 30% for those over 70-years-old and 40% for those over 80-years-old.4
The glomerular filtration rate (GFR) is the most important parameter used for diagnosis, staging, and predicting the prognosis of patients with CKD.5 Overestimation of GFR will lead to under-diagnosis of CKD, which will lead to delays in prevention and treatment; underestimation of GFR will lead to misdiagnosis, wasting of medical resources, and possible iatrogenic effects. Therefore, it is important to calculate eGFR accurately. Inulin clearance is considered the gold standard for measurement of GFR, but it is not commonly used in clinical practice because continuous infusion of inulin and many blood measurements are necessary. Radioisotope markers are also used for clinical determinations of GFR, but their use can be cumbersome, expensive, and difficult in clinical practice. Thus, the estimated GFR (eGFR), which is based on equations and measurements of endogenous and anthropometric variables, is the most commonly used method and is recommended by numerous guidelines. Although calculation of eGFR based on the serum creatinine (SCr) level (eGFRcr) is frequently used to assess renal function, muscle mass and body weight affect the SCr level, making this estimation problematic in the elderly.6 This shortcoming led to the use of serum cystatin C (CysC) level alone (eGFRcys) or with SCr (eGFRcr-cys) for calculation of eGFR. All nucleated cells in the body produce CysC (a cysteine protease inhibitor), and CysC is filtered by the glomerulus, catabolized in the proximal renal tubules, does not return to the blood, and is completely reabsorbed rather than secreted.7
The elderly can have a variety of underlying diseases and are also prone to frailty, sarcopenia, and various geriatric syndromes. The prevalence of frailty increases with age, and its presence increases the vulnerability to poor resolution of homeostasis following stress.8 Frailty also increases the risk for adverse health outcomes, including mortality, institutionalization, falls, and hospitalization.9 Sarcopenia is a progressive and generalized skeletal muscle disorder that causes an accelerated loss of muscle mass and function, and is linked to a higher risk of poor outcomes, such as falls, functional decline, frailty, and mortality.10 Many elderly individuals also use multiple drugs, and have an increased risk of adverse drug reactions because of age-related alterations in pharmacokinetics and drug-drug interactions.11 Thus, when elderly patients with CKD who use drugs present in clinical practice, drug dosage may require adjustment according to renal function.12 An accurate assessment of kidney function is therefore crucial for elderly individuals to achieve appropriate risk stratification and for decision-making regarding treatments.13–15
SCr concentrations are typically lower in older adults than in younger people due to factors such as decreased appetite and protein consumption, malnutrition, reduced physical activity, and greater muscular atrophy. The SCr level may not have a considerable increase, even when eGFR drops to a lower level.16 All nucleated body cells produce CysC, which is freely filtered at the glomerulus and metabolized in the proximal tubules.16 The rate of CysC synthesis is unaffected by variables that affect GFR (eg, age, sex, and race) because it is unrelated to muscle mass. Thus, use of eGFRcys may offer significant diagnostic advantages beyond the more commonly measured eGFRcr because CysC is independent of muscle mass.17
The Kidney Disease: Improving Global Outcomes (KIDGO) suggests that when SCr does not accurately reflect renal function, a formula based on the levels of SCr and CysC (eGFRcr-cys) should be used instead.18 Unfortunately, these guidelines do not identify the specific conditions in which creatinine-based estimates of GFR are inaccurate, and it can be difficult to identify the specific situations in which this combined formula is needed. The SCr-based eGFR formulas may not accurately reflect renal function in elderly individuals who are frail, have low muscle mass, and have decreased or even total loss of physical function. Our general purpose was to assess the use of serum CysC and SCr for calculation of eGFR in frail and elderly individuals.
The eGFR declines as age increases and as renal disease progresses. There is also evidence that older adults with poor underlying renal function are more likely to experience a rapid decline in eGFR.19 A decline of renal function is a risk factor for overall poor prognosis in the elderly, and early detection and treatment strategies are therefore important. Frail elderly people also may have reduced multisystem physiological reserve, reduced resistance to stressors, and increased vulnerability to adverse clinical outcomes.20 Notably, the elderly have reduced renal functional reserve, making them more vulnerable to physiological insult.21 There is also limited evidence regarding the effect of geriatric syndromes that contribute to debilitation on the rate of renal decline, depletion of renal functional reserve, and the onset and progression of acute kidney injury (AKI).
The present study of adults who were older than 60 years compared the eGFR values calculated using SCr alone (eGFRcr), CysC alone (eGFRcys), and SCr+CysC (eGFRcr-cys), and then determined the correlation between frailty and these different measures of renal function. We also analyzed temporal changes in 358 Chinese adults who were older than 60 years and had complete data on frailty and renal function from 2015 to 2021.
Materials and Methods
Participants
From August 2020 to June 2021, 507 individuals were selected from adults who were more than 60-years-old and were undergoing routine clinical examinations and medical checkups at Beijing Friendship Medical Center, Beijing Friendship Hospital, Capital Medical University. The individuals in our population could be considered as healthy, with relatively stable physical condition. For analysis of temporal changes in eGFR, data of 358 of these individuals, each with complete data from 2015 to 2021, were analyzed. Each participant was 60-years-old or more, expressed willingness to participate, and signed an informed consent document. This study was performed in accordance with the most recent version of the Declaration of Helsinki, and was approved by Clinical Analysis Commission of the Beijing Friendship Hospital, Capital Medical University (Project number: 2020-P2-227-03). Participants were excluded if they were unable to complete a thorough geriatric assessment because of severe dementia or communication difficulties, or if they suffered from a severe metabolic wasting condition, such as an acute illness or terminal cancer.
Clinical Evaluations and Laboratory Tests
Data on socio-demographic characteristics included gender, age, sex, body mass index (BMI), educational attainment, physical activity, smoking, alcohol drinking, co-morbidities, fall history, and medication history in the past year.
After more than 10 h of fasting, venous blood samples were taken and tested for leukocytes, red blood cells, urea nitrogen, hemoglobin, and other factors. SCr was calculated using an enzymatic method (Roche Modular P800, USA) and CysC was measured using an immuno-turbidimetric method (OLYMPUS 7500). Serum samples were analyzed at the Beijing Friendship Hospital Health Care Center Laboratory, which successfully completed a standardized and certified system.
The age-adjusted for Charlson Co-morbidity index (ACCI) was also calculated for each patient. According to Charlson et al, the age equivalence index and Charlson Comorbidity Index are combined to create the age-adjusted Charlson Comorbidity Index (ACCI).22 The cumulative score increased by 1 point every 10 years of age (1 point for those in the 50–59 age range, 2 points for those in the 60–69 age range, etc.), and the age score is added to the CCI. The eGFR was calculated using three different CKD-EPI equations: the CKD-EPI creatinine equation (eGFRcr), the CKD-EPI cystatin C equation (eGFRcys), and the CKD-EPI creatinine-cystatin C equation (eGFRcr-cys).18 The mean rate of eGFR decline was calculated as: (eGFRt1 − eGFRt0)/(years of follow-up), where t1 is the date of the most recent measurement and t0 is the date of the baseline measurement.
Comprehensive Geriatric Assessment
All assessors had a background in medicine and nursing and passed uniform professional integrated geriatric training before conducting assessments. A comprehensive geriatric assessment, which included measurements related to frailty, was completed by a trained geriatrician on the day of the physical examination. The FRAIL score (which measures fatigue, resistance of muscles, ambulation, illness, and loss of weight) ranges from 0 to 5 and assesses frailty based on the answers to five yes-or-no questions.9 Participants were classified as robust (0 points) or frail (1–5 points) in most analyses, and as robust (0 points), pre-frail (1–2 points), or frail (3–5 points) in analysis of changes over the course of 5 years.
Statistical Analysis
Data were presented as number (%) for categorical variables, mean and standard deviation for continuous variables with a normal distribution, and median (interquartile range [IQR]) for continuous variables with a skewed distribution. Based on previous literature, the prevalence of frailty was 9.9%. Considering a 5% rate of missed visits, 456 patients were required for this study to obtain 90% certainty of detecting this difference (two-sided α = 0.05).
Categorical variables were compared using Fisher’s exact test or the chi-square test. The Mann–Whitney U-test or Student’s t-test was used to compare continuous variables. Differences in the estimates between each method and the reference standard (eGFRcr-cys) were evaluated using the pairwise Wilcoxon rank sum test for paired samples, with the Bonferroni correction for multiple testing. A Poisson model was used to analyze the relationship of frailty with different levels of renal function. A generalized linear model (GLM) was used to examine the effect of frailty on the rate of eGFR decline.
Results
eGFR in Frail and Non-Frail Participants
We initially examined the demographic characteristics and laboratory results of 507 individuals who were at least 60-years-old (Table 1). There were 375 males (74.0%), the overall median age was 73 years (IQR: 66–83), and there were 196 individuals (38.7%) who were frail (FRAIL score: 1–5) and 311 (61.3%) who were robust (FRAIL score: 0). Univariate analysis showed that the frail group had a significantly lower eGFR when it was calculated using SCr, CysC, or SCr+CysC formula (all P < 0.001, Table 2).
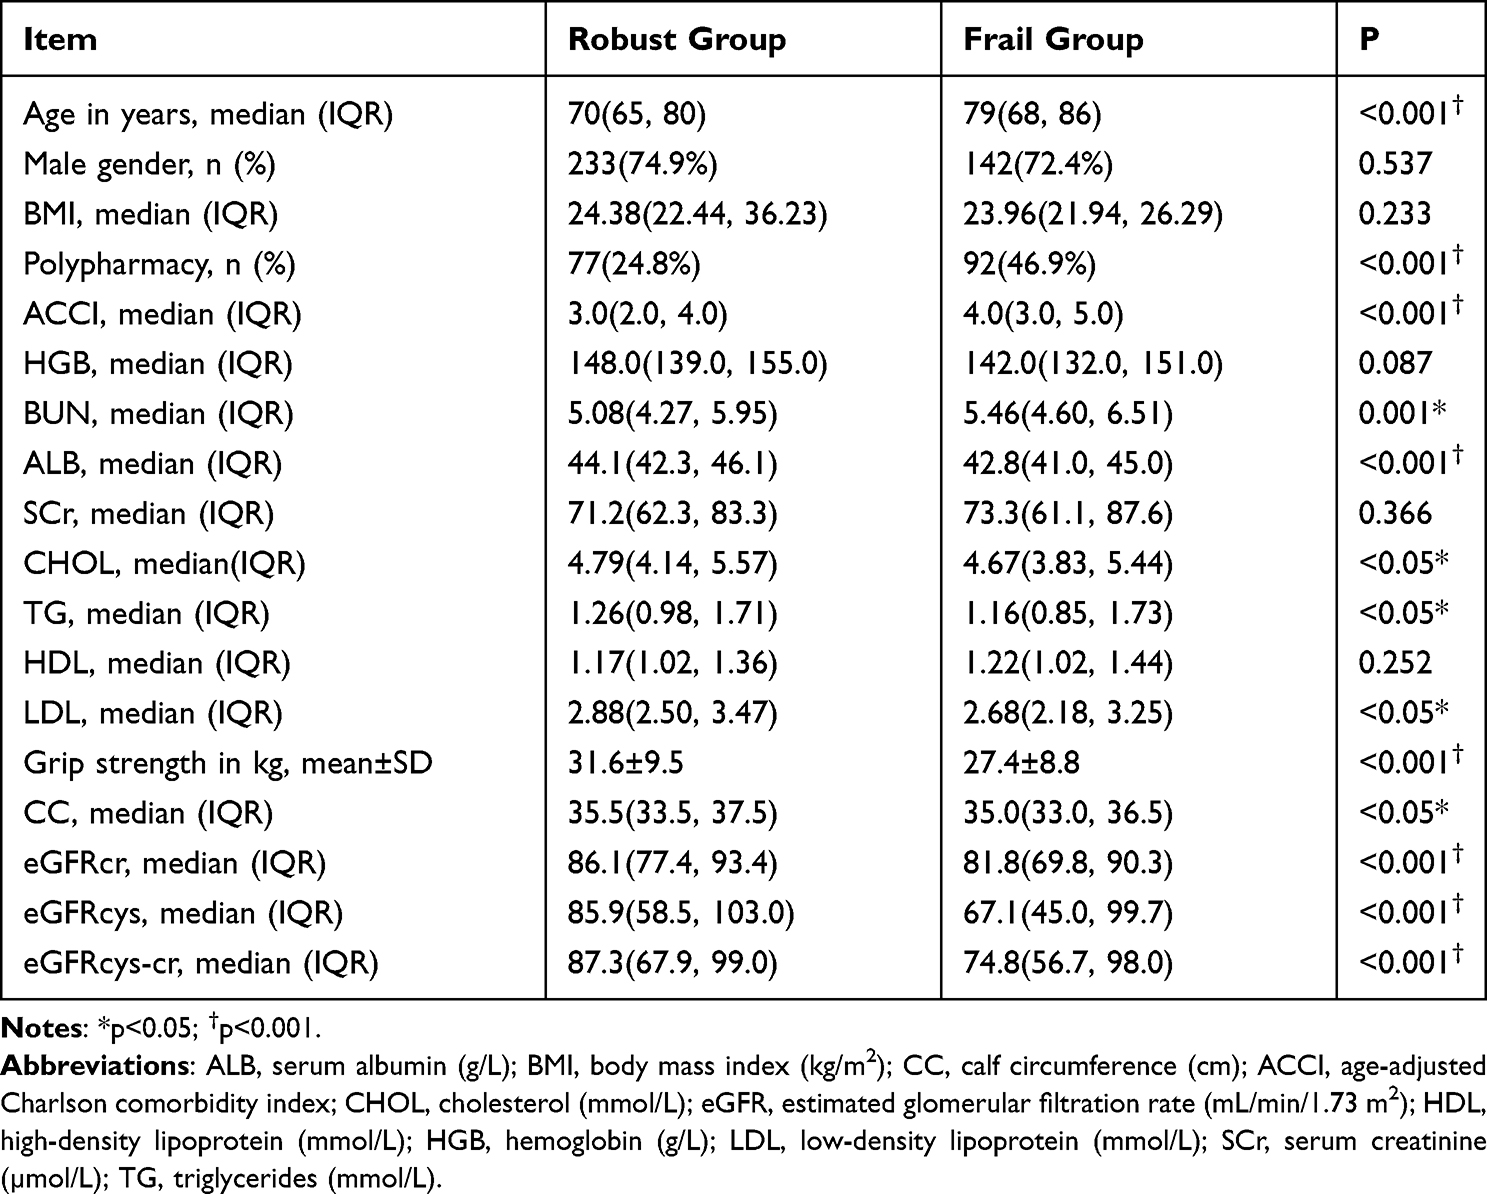 |
Table 1 Baseline Characteristics of Included Participants (n = 507) |
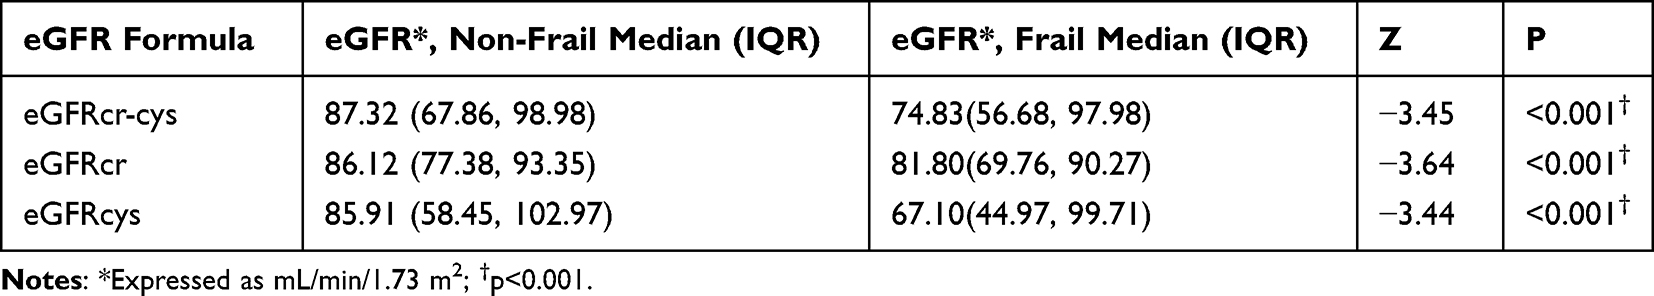 |
Table 2 Median eGFR Values Calculated Using Different Formulas in the Non-Frail and Frail Groups |
We also compared the difference of eGFR when calculated by SCr alone and by SCr+CysC (eGFRcr-cys – eGFRcr) and the difference when calculated by CysC alone and by SCr+CysC (eGFRcr-cys – eGFRcys; Table 3). Although the difference in eGFRcr-cys and eGFRcys did not significantly differ between the robust and frail groups, the difference between eGFRcys-cr and eGFRcr was statistically different between these two groups (P = 0.02). The results showed that the frail group had statistically significant differences in both calculations (both P < 0.05). The non-frail group had no significant difference between eGFRcr and eGFRcr-cys, but did have a significant difference between eGFRcys and eGFRcr-cys (P < 0.001). Therefore, the CKD-EPI equation that uses SCr and CysC (eGFRcr-cys) appears to provide a more reliable characterization of renal function in frail individuals who are older than 60 years.
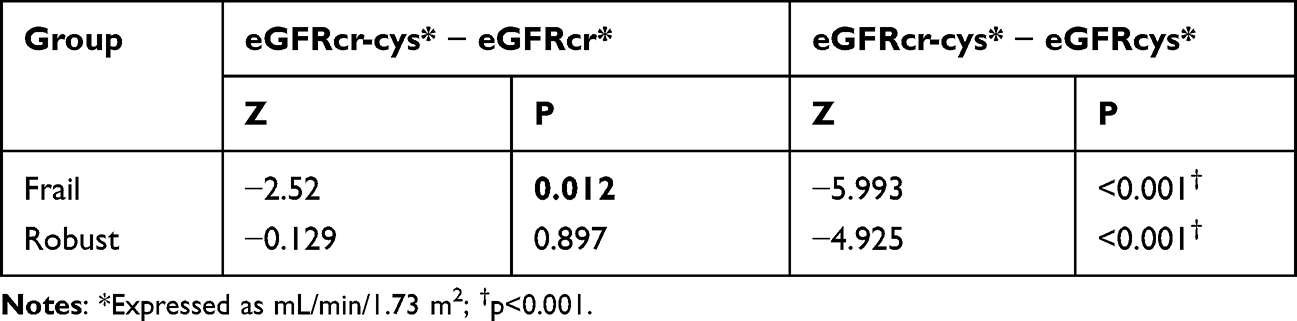 |
Table 3 Difference of eGFRcr-Cys with eGFRcr and with eGFRcys in the Frail and Non-Frail Groups |
Frailty and CKD
We then classified the participants into three groups based on kidney function (normal: eGFR ≥ 90 mL/min/1.73 m2; mild damage: eGFR = 60–90 mL/min/1.73 m2; moderate damage: eGFR < 60 mL/min/1.73 m2) and according to each of the three formulas for calculation of eGFR (eGFRcr, eGFRcys, eGFRcr-cys; Table 4). For each eGFR formula, the unadjusted prevalence of frailty increased as the eGFR decreased. Thus, for participants with moderate renal damage (eGFR < 60 mL/min/1.73 m2), the unadjusted prevalence of frailty was 56.6% based on eGFRcr, 51.20% based on eGFRcys, and 58.30% based on eGFRcr-cys.
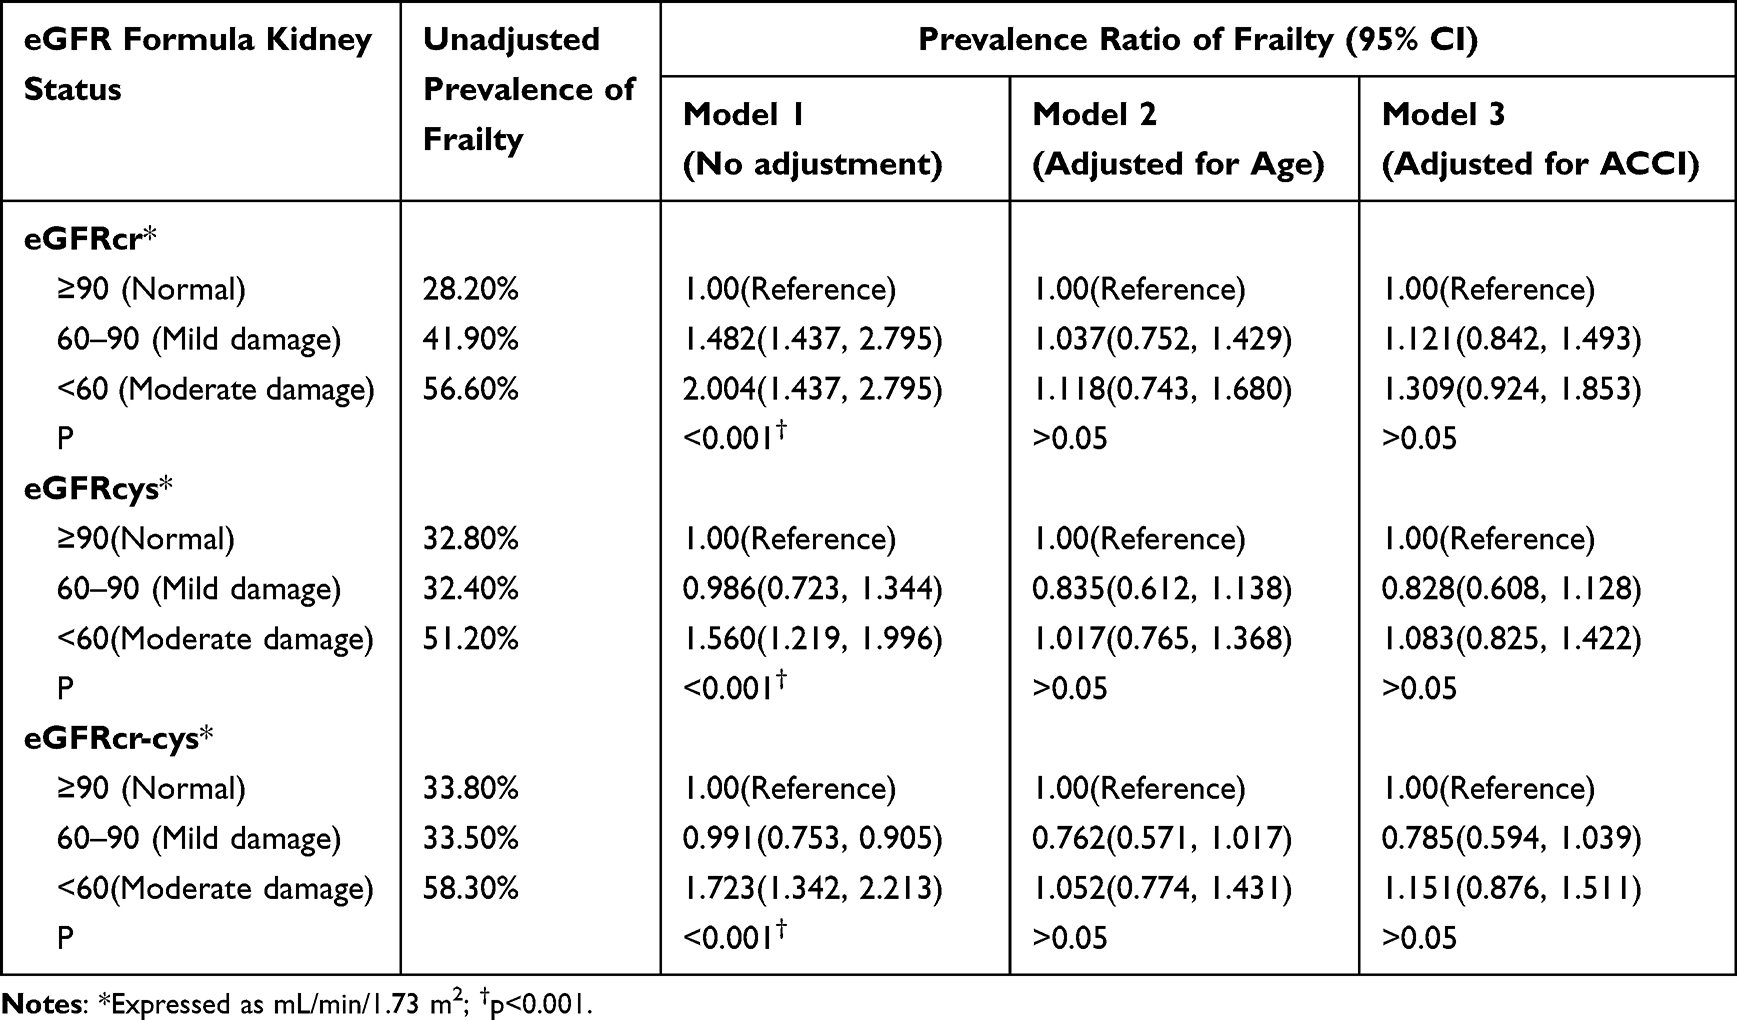 |
Table 4 Unadjusted Prevalence of Frailty, and Prevalence Ratios of Frailty with No Adjustment (Model 1), with Adjustment for Age (Model 2), and with Adjustment for ACCI (Model 3) According to Kidney Status Determined Using Three Different eGFR Formulas |
In Model 1 (no adjustments), the prevalence ratio of frailty had a significant negative correlation with eGFR when it was calculated by each formula (all P < 0.001). However, after adjustment for age (Model 2) or for ACCI (Model 3), there was no significant relationship between frailty and eGFR when it was calculated by each formula (Table 4).
Frailty and Changes in Renal Function
We further analyzed 358 of these 507 participants who had complete data from 2015 to 2021 (Figure 1). Based on the FRAIL score, 59.5% of them were robust (FRAIL score: 0), 35.2% were pre-frail (FRAIL score: 1–2), and 5.3% were frail (FRAIL score: 3–5). We then used calculations of eGFRcr, eGFRcys, and eGFRcr-cys to analyze changes in eGFR over time using a mixed linear model. The overall trend of decreasing eGFR differed among the three groups, and the greatest decrease in eGFR was in the frail group (all P < 0.05; Table 5). Furthermore, when eGFR was calculated as eGFRcr-cys, the decline was 0.746 mL/min/1.73 m2 per year in the robust group, 2.066 mL/min/1.73 m2 per year in the pre-frail group, and 2.226 mL/min/1.73 m2 per year in the frail group.
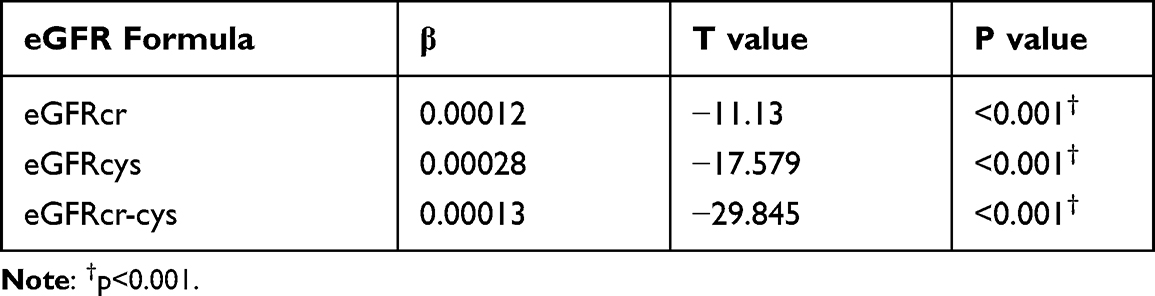 |
Table 5 Effect of eGFR Formula on the Decrease of eGFR from 2015 to 2021 |
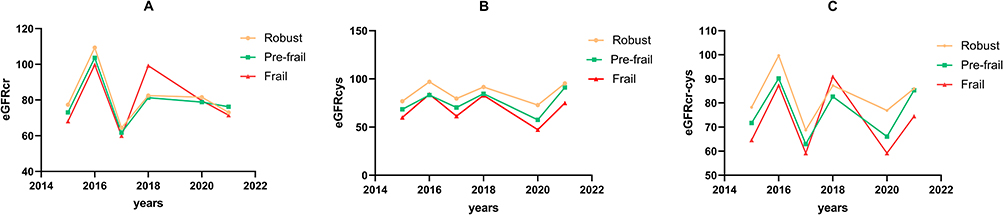 |
Figure 1 Changes of eGFRcr (A), eGFRcys (B), and eGFRcr-cys (C) from 2015 to 2021 in the robust, pre-frail, and frail groups (n = 358). eGFR is expressed as mL/min/1.73 m2. |
Discussion
Several studies reported that calculating the eGFR using CysC+SCr greatly improved the risk classification of patients for end-stage renal disease, cardiovascular disease, and death.23 A meta-analysis assessed 90,750 individuals from 11 general population studies and demonstrated that calculation of eGFR using CysC (rather than SCr) led to a stronger association of eGFR with risk of death and risk of end-stage renal disease, because calculation using CysC led to lower eGFR values.16 Several current guidelines recommend use of SCr+CysC to assess renal function in cases when SCr may not accurately reflect renal function.24 In the present study, we used the eGFRcr-cys equation as the reference standard. For the frail group, the eGFR had significant differences from this reference method when it was calculated using eGFRcr or using eGFRscr. For the non-frail group, the difference from the reference method was only significant when eGFR was calculated using eGFRcys. These results suggest that use of SCr alone to calculate eGFR for frail individuals older than 60 years provides a less reliable characterization of renal function.
Many physiological factors can affect SCr, such as muscle mass, diet, and physical activity. Frail elderly people are more likely to have malnutrition and decreased digestive function, both of which affect protein absorption and can lead to lower blood creatinine levels. Frailty is currently considered a non-specific state characterized by a systemic multisystem impairment in the composition of the body. Frailty is associated with alterations of the homeostatic reticular system, leading to sarcopenia, reduced physiological reserve, diminished stress resistance, and reduced ability to recover after stress. In contrast to several traditional markers of renal function, CysC has high sensitivity and specificity, and its concentration is independent of gender, age, and muscle mass. However, the CysC level changes in response to several pathological conditions, such as hyperthyroidism and underlying inflammation.25 Because CKD is associated with a microinflammatory state,26 this may also explain the differences we observed when comparing eGFRcys and eGFRcr-cys values in our non-frail and frail groups.
Our results suggest that assessment of eGFR based on SCr alone may provide less reliable measurements of renal function in elderly and frail individuals because of their lower muscle mass. We therefore recommend that kidney function be assessed using the eGFRcr-cys, especially in frail adults who are older than 60 years.
Frailty and CKD
We found that a lower eGFR, calculated using SCr, CysC, or SCr+CysC, was associated with increased frailty. In addition, the significance of the association between frailty and kidney function were greatly attenuated when eGFR was calculated using SCr alone instead of Scr+CysC. However, the associations of eGFRscr and eGFRcr with frailty were not significant after adjustment for age and ACCI. Many factors can influence frailty, and advanced age and comorbidities (indicated by ACCI) might have a greater impact than renal function. For example, a previous study reported frail individuals had a high prevalence of reduced kidney function, but after adjustment for age, sex, smoking status, alcohol drinking, and comorbidities, this association was only present when the eGFR was extremely low (<30 mL/min/1.73 m2).27 Another study of 630 outpatients found that compared to non-CKD individuals (reference), the odds ratios for frailty was 0.87 (95% CI: 0.56, 1.35; P > 0.05) for patients with Stage-3A CKD (60 < eGFR ≤ 45 mL/min/1.73 m2) and 2.54 (95% CI: 1.46, 4.53; P < 0.05) for patients with Stage-3B or higher CKD (eGFR < 45 mL/min/1.73 m2).28 Wilhelm et al29 found that frailty was significantly associated with all stages of CKD, particularly with moderate-to-severe CKD.
Previous studies concluded that age was an independent risk factor for frailty.30 A prospective cohort study in the UK found a strong association between frailty and the presence of four or more comorbidities (OR = 27.1, 95% CI: 25.3, 29.1).31 A meta-analysis of frailty and comorbidities showed that about three-quarters of patients with frailty had comorbidities, and the prevalence of frailty the group with comorbidities was 16%.32 The correlation between frailty and a high Charlson Comorbidity Index (CCI) score is consistent with the interpretation that comorbidities and multiple stressors lead to a decline in homeostatic reserve and accelerate the occurrence and development of frailty.33 The present study showed that age and CCI score had a greater impact on frailty than renal function. This may because of the relatively intact renal function of most participants in our population and because urine proteins were not collected and included in the statistical analysis.
Frailty and Risk of Kidney Function Decline
Previous longitudinal studies that examined the association between frailty and eGFR emphasized the relationship of baseline eGFR with the incidence of frailty. We found a faster decline in renal function in frail individuals who were more than 60-years-old. The findings of our mixed-effect model also showed that during the 6-year study period, participants with frail status experienced a faster decline of eGFR (2.226 mL/min/1.73 m2 per year) than subjects with robust status (0.746 mL/min/1.73 m2 per year). Frailty is also a risk factor for a rapid decline in renal function. In particular, a previous cohort study of 1269 older adults showed that baseline frailty was associated with a 2.48-fold increased risk (95% CI: 1.24, 4.95) of decreased kidney function over an average of 3 years, and confirmed that frailty contributed to the rapid decline of renal function.34 Just as frailty can contribute to declining renal function, declining renal function can contribute to frailty. Our finding indicated that frailty was a risk factor for renal dysfunction. Thus, targeting the typical risk factors that contribute to kidney injury and also targeting factors that contribute to frailty may help to prevent renal damage in high-risk adults.
It is likely that many pathophysiological processes contribute to impaired renal function in adults with frailty, and these are not yet fully understood. Renal aging is a multifactorial process, and oxidative stress, chronic inflammation, and impaired capacity for renal repair play important roles.35 The presumably similar pathways of debilitation and renal aging can make frail patients more prone to a rapid decline in renal function. Frailty reflects the degenerative decline of numerous interconnected organ systems, and it may also be affected by the integrated total effect of specific risk factors for kidney injury in the elderly.36
Limitations
Firstly, the gold standard of using inulin to measure eGFR was not available to us. Secondly, the retrospective design of our study did not allow the inference of causal relationships between frailty and decline in renal function. Further prospective cohort studies are warranted to determine whether frailty is an independent risk factor for decline of renal function and a possible target for preventive interventions.
Conclusion
Our study of adults older than 60 years indicated that eGFRcr in those who are frail may led to an inaccurate characterization of renal function. It is best to use eGFRcr-cys to assess kidney function in these individuals. In addition, we found that frailty was associated with a rapid decline in kidney function. These findings have implications for measurements of kidney function in elderly adults.
Data Sharing Statement
The data are not available to the general public to maintain the confidentiality of all participants. The data supporting the results of this study are available upon request from the corresponding author.
Ethics Approval and Informed Consent
The analysis protocol complied with the Helsinki Declaration and was approved by the Clinical Analysis Commission of the Beijing Friendship Hospital, Capital Medical University (Project number: 2020-P2-227-03). Before participation, all participants signed a written informed consent document.
Acknowledgments
The authors thank all participants, researchers, and employees who were involved in this study.
Author Contributions
All authors made a significant contribution to the work reported, whether that is in the conception, study design, execution, acquisition of data, analysis and interpretation, or in all these areas; took part in drafting, revising or critically reviewing the article; gave final approval of the version to be published; have agreed on the journal to which the article has been submitted; and agree to be accountable for all aspects of the work.
Funding
The research reported in this publication was funded by the Beijing Municipal Health Commission (Process No. 19-7) and Capital’s Funds for Health Improvement and Research (CFH 2022-2-2028).
Disclosure
The authors report no conflicts of interest in this work.
References
1. Lv JC, Zhang LX. Prevalence and disease burden of chronic kidney disease. Adv Exp Med Biol. 2019;1165:3–15. doi:10.1007/978-981-13-8871-2_1
2. Wang L, Xu X, Zhang M, et al. Prevalence of chronic kidney disease in China: results from the sixth China chronic disease and risk factor surveillance. JAMA Intern Med. 2023;183(4):298–310. doi:10.1001/jamainternmed.2022.6817
3. Zhang L, Wang F, Wang L, et al. Prevalence of chronic kidney disease in China: a cross-sectional survey. Lancet. 2012;379(9818):815–822. doi:10.1016/S0140-6736(12)60033-6
4. Yamada S, Inaba M. Potassium metabolism and management in patients with CKD. Nutrients. 2021;13(6):1751. doi:10.3390/nu13061751
5. Chen TK, Knicely DH, Grams ME. Chronic kidney disease diagnosis and management: a review. JAMA. 2019;322(13):1294–1304. doi:10.1001/jama.2019.14745
6. Huang X, Jiang X, Wang L, et al. Serum cystatin C and arterial stiffness in middle-aged and elderly adults without chronic kidney disease: a population-based study. Med Sci Monit. 2019;25:9207–9215. doi:10.12659/MSM.916630
7. Seronie-Vivien S, Delanaye P, Pieroni L, et al. Cystatin C: current position and future prospects. Clin Chem Lab Med. 2008;46(12):1664–1686. doi:10.1515/CCLM.2008.336
8. Gao J, Wang Y, Xu J, Jiang J, Yang S, Xiao Q. Life expectancy among older adults with or without frailty in China: multistate modelling of a national longitudinal cohort study. BMC Med. 2023;21(1):101. doi:10.1186/s12916-023-02825-7
9. Fried LP, Tangen CM, Walston J, et al. Frailty in older adults: evidence for a phenotype. J Gerontol a Biol Sci Med Sci. 2001;56(3):M146–56. doi:10.1093/gerona/56.3.m146
10. Cruz-Jentoft AJ, Sayer AA. Sarcopenia. Lancet. 2019;393(10191):2636–2646. doi:10.1016/S0140-6736(19)31138-9
11. Modig S, Lannering C, Ostgren CJ, Molstad S, Midlov P. The assessment of renal function in relation to the use of drugs in elderly in nursing homes; a cohort study. BMC Geriatr. 2011;11:1. doi:10.1186/1471-2318-11-1
12. Gomez C, Vega-Quiroga S, Bermejo-Pareja F, Medrano MJ, Louis ED, Benito-Leon J. Polypharmacy in the elderly: a marker of increased risk of mortality in a population-based prospective study (NEDICES). Gerontology. 2015;61(4):301–309. doi:10.1159/000365328
13. Schaeffner ES, Ebert N, Delanaye P, et al. Two novel equations to estimate kidney function in persons aged 70 years or older. Ann Intern Med. 2012;157(7):471–481. doi:10.7326/0003-4819-157-7-201210020-00003
14. Fan L, Levey AS, Gudnason V, et al. Comparing GFR estimating equations using cystatin C and creatinine in elderly individuals. J Am Soc Nephrol. 2015;26(8):1982–1989. doi:10.1681/ASN.2014060607
15. Zhu Y, Ye X, Zhu B, et al. Comparisons between the 2012 new CKD-EPI (chronic kidney disease epidemiology collaboration) equations and other four approved equations. PLoS One. 2014;9(1):e84688. doi:10.1371/journal.pone.0084688
16. Shlipak MG, Matsushita K, Arnlov J, et al. Cystatin C versus creatinine in determining risk based on kidney function. N Engl J Med. 2013;369(10):932–943. doi:10.1056/NEJMoa1214234
17. Ebert N, Shlipak MG. Cystatin C is ready for clinical use. Curr Opin Nephrol Hypertens. 2020;29(6):591–598. doi:10.1097/MNH.0000000000000638
18. Inker LA, Schmid CH, Tighiouart H, et al. Estimating glomerular filtration rate from serum creatinine and cystatin C. N Engl J Med. 2012;367(1):20–29. doi:10.1056/NEJMoa1114248
19. Hemmelgarn BR, Zhang J, Manns BJ, et al. Progression of kidney dysfunction in the community-dwelling elderly. Kidney Int. 2006;69(12):2155–2161. doi:10.1038/sj.ki.5000270
20. Walker SR, Gill K, Macdonald K, et al. Association of frailty and physical function in patients with non-dialysis CKD: a systematic review. BMC Nephrol. 2013;14:228. doi:10.1186/1471-2369-14-228
21. Denic A, Glassock RJ, Rule AD. Structural and functional changes with the aging kidney. Adv Chronic Kidney Dis. 2016;23(1):19–28. doi:10.1053/j.ackd.2015.08.004
22. Lin JX, Huang YQ, Xie JW, et al. Age-adjusted Charlson Comorbidity Index (ACCI) is a significant factor for predicting survival after radical gastrectomy in patients with gastric cancer. BMC Surg. 2019;19(1):53. doi:10.1186/s12893-019-0513-9
23. Peralta CA, Shlipak MG, Judd S, et al. Detection of chronic kidney disease with creatinine, cystatin C, and urine albumin-to-creatinine ratio and association with progression to end-stage renal disease and mortality. JAMA. 2011;305(15):1545–1552. doi:10.1001/jama.2011.468
24. Stevens PE, Levin A; Kidney Disease: Improving Global Outcomes Chronic Kidney Disease Guideline Development Work Group M. Evaluation and management of chronic kidney disease: synopsis of the kidney disease: improving global outcomes 2012 clinical practice guideline. Ann Intern Med. 2013;158(11):825–830. doi:10.7326/0003-4819-158-11-201306040-00007
25. Onopiuk A, Tokarzewicz A, Gorodkiewicz E. Cystatin C: a kidney function biomarker. Adv Clin Chem. 2015;68:57–69. doi:10.1016/bs.acc.2014.11.007
26. Zhang C, Wang J, Xie X, Sun D. Low serum vitamin D concentration is correlated with anemia, microinflammation, and oxidative stress in patients with peritoneal dialysis. J Transl Med. 2021;19(1):411. doi:10.1186/s12967-021-03077-w
27. Ballew SH, Chen Y, Daya NR, et al. Frailty, kidney function, and polypharmacy: the atherosclerosis risk in communities (ARIC) Study. Am J Kidney Dis. 2017;69(2):228–236. doi:10.1053/j.ajkd.2016.08.034
28. Inoue T, Shinjo T, Matsuoka M, et al. The association between frailty and chronic kidney disease; cross-sectional analysis of the Nambu Cohort Study. Clin Exp Nephrol. 2021;25(12):1311–1318. doi:10.1007/s10157-021-02110-y
29. Wilhelm-Leen ER, Hall YN, Tamura MK, Chertow GM. Frailty and chronic kidney disease: the third national health and nutrition evaluation survey. Am J Med. 2009;122(7):664–71 e2. doi:10.1016/j.amjmed.2009.01.026
30. Hoogendijk EO, Afilalo J, Ensrud KE, Kowal P, Onder G, Fried LP. Frailty: implications for clinical practice and public health. Lancet. 2019;394(10206):1365–1375. doi:10.1016/S0140-6736(19)31786-6
31. Hanlon P, Nicholl BI, Jani BD, Lee D, McQueenie R, Mair FS. Frailty and pre-frailty in middle-aged and older adults and its association with multimorbidity and mortality: a prospective analysis of 493 737 UK Biobank participants. Lancet Public Health. 2018;3(7):e323–e332. doi:10.1016/S2468-2667(18)30091-4
32. Vetrano DL, Palmer K, Marengoni A, et al. Frailty and multimorbidity: a systematic review and meta-analysis. J Gerontol a Biol Sci Med Sci. 2019;74(5):659–666. doi:10.1093/gerona/gly110
33. Drost D, Kalf A, Vogtlander N, van Munster BC. High prevalence of frailty in end-stage renal disease. Int Urol Nephrol. 2016;48(8):1357–1362. doi:10.1007/s11255-016-1306-z
34. Wang M, Sun X, Zhang W, et al. Frailty and the risk of kidney function decline in the elderly population: the rugao longevity and ageing study. Nephrol Dial Transplant. 2021;36(12):2274–2281. doi:10.1093/ndt/gfaa323
35. Bolignano D, Mattace-Raso F, Sijbrands EJ, Zoccali C. The aging kidney revisited: a systematic review. Ageing Res Rev. 2014;14:65–80. doi:10.1016/j.arr.2014.02.003
36. Howlett SE, Rockwood K. New horizons in frailty: ageing and the deficit-scaling problem. Age Ageing. 2013;42(4):416–423. doi:10.1093/ageing/aft059
 © 2023 The Author(s). This work is published and licensed by Dove Medical Press Limited. The full terms of this license are available at https://www.dovepress.com/terms.php and incorporate the Creative Commons Attribution - Non Commercial (unported, v3.0) License.
By accessing the work you hereby accept the Terms. Non-commercial uses of the work are permitted without any further permission from Dove Medical Press Limited, provided the work is properly attributed. For permission for commercial use of this work, please see paragraphs 4.2 and 5 of our Terms.
© 2023 The Author(s). This work is published and licensed by Dove Medical Press Limited. The full terms of this license are available at https://www.dovepress.com/terms.php and incorporate the Creative Commons Attribution - Non Commercial (unported, v3.0) License.
By accessing the work you hereby accept the Terms. Non-commercial uses of the work are permitted without any further permission from Dove Medical Press Limited, provided the work is properly attributed. For permission for commercial use of this work, please see paragraphs 4.2 and 5 of our Terms.