Back to Journals » Diabetes, Metabolic Syndrome and Obesity » Volume 14
Relationship Between Vitamin D Status and the Relevant Parameters of Glucose in Patients with Type 2 Diabetes
Authors Tran Huu TT ![]() , Tran HD, Tran TN, Hoang BB
, Tran HD, Tran TN, Hoang BB
Received 9 April 2021
Accepted for publication 22 May 2021
Published 3 June 2021 Volume 2021:14 Pages 2489—2494
DOI https://doi.org/10.2147/DMSO.S314416
Checked for plagiarism Yes
Review by Single anonymous peer review
Peer reviewer comments 3
Editor who approved publication: Professor Ming-Hui Zou
Thanh Tung Tran Huu,1 Huu Dang Tran,2 Thua Nguyen Tran,3 Bui Bao Hoang2
1Hue University of Medicine and Pharmacy, Hue University, Hue City, Vietnam; 2Department of Internal Medicine, Hue University of Medicine and Pharmacy, Hue City, Vietnam; 3Department of General Internal Medicine and Geriatrics, Hue Central Hospital, Hue City, Vietnam
Correspondence: Thua Nguyen Tran
Department of General Internal Medicine and Geriatrics, Hue Central Hospital, Hue City, Vietnam
Tel +84903597695
Email [email protected]
Introduction: Clarifying the prevalence of vitamin D deficiency in diabetic patients, and the relationship between vitamin D concentration and insulin resistance, fasting plasma glucose, and HbA1C in patients in Hue City, Vietnam.
Methods: A cross-sectional study on 110 diabetic patients examined at Hue Central Hospital and Hue University of Medicine and Pharmacy Hospital. These patients were collected venous blood sampling, and the 25(OH)D test, fasting plasma glucose test, fasting insulin test, HOMA-IR and QUICKI calculation.
Results: Vitamin D deficiency and insufficiency prevalence were 51.8%. The average concentration of 25(OH)D (ng/mL) was 30.67 ± 8.55; this concentration in fasting glucose level ≤ 8 mmol/l group and > 8 mmol/l group was 32.08 ± 9.26 and 28.55± 6.91 (p = 0.033); it was 32.95 ± 8.58 and 28.97 ± 8.17 in HOMA-IR ≤ 3.5 and HOMA-IR > 3.5 group, (p = 0.015); in QUICKI ≤ 0.32 group, it was 29.16 ± 8.12; in QUICKI > 0.32 group, it was 32.85 ± 8.76 (p = 0.025). Patients with an ideal exercise level have higher average levels of 25(OH)D (32.11± 8.62 vs 26.83± 7.16, p=0.003). The average levels of 25(OH)D in male patients are higher than in female patients (33.47± 0.08 vs 29.01± 8.43, p=0.008). Vitamin D deficiency and insufficiency prevalence in patients with HOMA-IR ≤ 3.5 and QUICKI > 0.32 were 36.2% and 37.8%, whereas in those with HOMA-IR > 3.5 and QUICKI ≤ 0.32 they were 63.5% and 61.5% (p = 0.007 and 0.02, respectively). 25(OH)D is negative correlation with fasting glucose level and HOMA-IR, with r = − 0.229 and − 0.192, respectively (p = 0.016 and 0.045); 25(OH)D was positively correlated with QUICKI, with r = 0.235, p = 0.008.
Conclusion: Patients who have better glucose-related parameters, such as fasting blood sugar, HOMA-IR and QUICKI, have a better vitamin D status. Some blood sugar-related factors, such as exercise level and sex, are related to vitamin D status.
Keywords: vitamin D, insulin resistance, diabetes, HbA1C
Introduction
In recent years, studies on non-classical functions of vitamin D have shown that vitamin D not only maintains musculoskeletal health, but also plays a certain role in metabolic diseases, especially type 2 diabetes. Many studies have indicated that patients with type 2 diabetes have a lower level of vitamin D and a higher prevalence of vitamin D deficiency than healthy people.1–3
Results of studies on the relationship between vitamin D deficiency and type 2 diabetes include the following: In vitro studies have shown that 1.25(OH)2 D may simultaneously increase the expression of insulin receptor mRNA in U-937 human cells and the glucose uptake ability of insulin receptors.4 Supplementation of 1.25(OH)2 D may significantly improve glucose absorption capacity of muscle cells.5 Vitamin D enhances the biosynthetic capacity of β-cells and expedites the conversion of proinsulin to insulin.6 Clinical studies have also highlighted the relationship between vitamin D deficiency and insulin resistance, beta-cell function.7 This association was also reported among healthy and glucose tolerant.6 Vitamin D also related to diabetes associated factors, such as overweight/obesity and dyslipidemia.8,9 Nonetheless, study findings vary in different geographical regions.
Our study aimed to clarify vitamin D deficiency in diabetic patients in two major hospitals in Hue City, in Central Vietnam, and the relationship between vitamin D concentration and insulin resistance, fasting plasma glucose, HbA1C.
Materials and Methods
Study Population
This cross-sectional study was carried out from August 2020 to September 2020. A total of 110 patients (41 men and 69 women) aged 36 to 94 with type 2 diabetes (average age: 69.86±12.54) were examined and treated at Hue Central Hospital and Hue University of Medicine and Pharmacy Hospital.
The inclusion criteria were diabetic patients aged ≥18 years. The exclusion criteria were patients with: (1) a history of chronic liver disease; (2) pregnant women; (3) those with thyroid dysfunction with or without medication; (4) a history of parathyroid disease; (5) those with infectious or intestinal diseases; (6) those using vitamin D supplements.
Collection of basic Information of the subjects included the volunteers’ basic information, past medical history, exercising activities.
Determination of Serum Biochemical Indicators
Fasting venous blood specimens of the participants were collected (8 hours after meal) for the fasting plasma glucose (Go) test, and measured using hexokinase method with a AU680 Beckman analyzer fasting insulin test was conducted using a chemiluminescent microparticle immunoassay (CMIA) with an ARCHITECT i2000SR immunoassay analyzer.
Quantitative measurement of 25(OH)D was undertaken using a competitive immunoassay, with a CMIA. The total time to analyze a specimen was 18 minutes. The test was conducted using an ARCHITECT i2000SR analyzer, and the unit measurement for 25(OH)D was ng/mL.
Calculation of HOMA-IR was undertaken using the formula: HOMA = (Io × Go)/22.5.
Calculation of QUICKI was undertaken using the formula: QUICKI = 1/[logI0(µU/mL) + logGo(mg/dl)].
Diagnostic Standards
The participants were diagnosed with diabetes according to ADA 2020, for which any of the following four criteria were satisfied: (1) FPG ≥126 mg/dL (7.0 mmol/L). Fasting was defined as no caloric intake for ≥8 hours. (2) Two-hour PG ≥200 mg/dL (11.1 mmol/L) during the glucose tolerance test. (3) A1C ≥6.5% (48 mmol/mol). (4) Random plasma glucose ≥200 mg/dL (11.1 mmol/L), and obvious clinical signs (excessive thirst, more frequent urination, unexplained weight loss).
Two satisfactory attempts were required for the first three criteria.10
The 25(OH)D levels (ng/mL) were defined as severe deficiency: <10; deficiency: 10–20; insufficiency: 21–29; and sufficiency: ≥30.11
Ideal exercise level was categorized as:12 moderate (at least 30 minutes on 5 or more days per week, leading to small increases in heart rate) and/or vigorous (at least 20 minutes on 3 or more days per week, leading to substantial increases in heart rate) physical activity.
Statistical Analysis
Data was processed using SPSS 20.0. The t-test was used to compare two average numbers. The chi-square test was used to compare two ratios. The difference was deemed statistically significant when p < 0.05. To find out the cutoff Go, HOMA-IR and QUICKI, we used the ROC of 25(OH)D against the glucose related parameters. A logistic regression model was used to assess the relationship between vitamin D concentration and relevant parameters of glucose in patients with type 2 diabetes such as insulin resistance, fasting plasma glucose, HbA1C.
Results
A total 110 patients with type 2 diabetes in Thua Thien Hue province Vietnam were randomly selected in this study. Of these, 57 experienced vitamin D deficiency and insufficiency, accounting for 51.8% of all patients; the percentage of patients with an ideal level of 25(OH)D was 48.2% (53 patients). Analysis of Go 7 mmol/l, Go 8 mmol/l, and Go 9mmol/l cutoff points showed that lower fasting plasma glucose groups had higher serum 25(OH)D levels. However, this result was only statistically significant at the 8mmol/l cutoff point, and no statistical significance was found at the 7 and 9mmol/l cutoff points. The specific results were as follows (as shown in Table 1): At the cutoff points of Go 7mmol/l, the average levels of 25(OH)D in the Go ≤7 mmol/l and Go >7 mmol/l groups were 32.50 ± 1.22 ng/mL and 29.58 ± 7.23 ng/mL, p = 0.083. At the cutoff point of Go 8 mmol/l, the average levels of 25(OH)D in Go ≤8 mmol/l and Go >8 mmol/l groups were 32.08 ± 9.26 ng/mL and 28.55 ± 6.91 ng/mL, p = 0.033. At the cutoff point of Go 9 mmol/l, the average levels of 25(OH)D in Go ≤9 mmol/l and Go >9 mmol/l groups were 31.18 ± 9.21 ng/mL and 29.18 ± 6.12 ng/mL, p = 0.289.
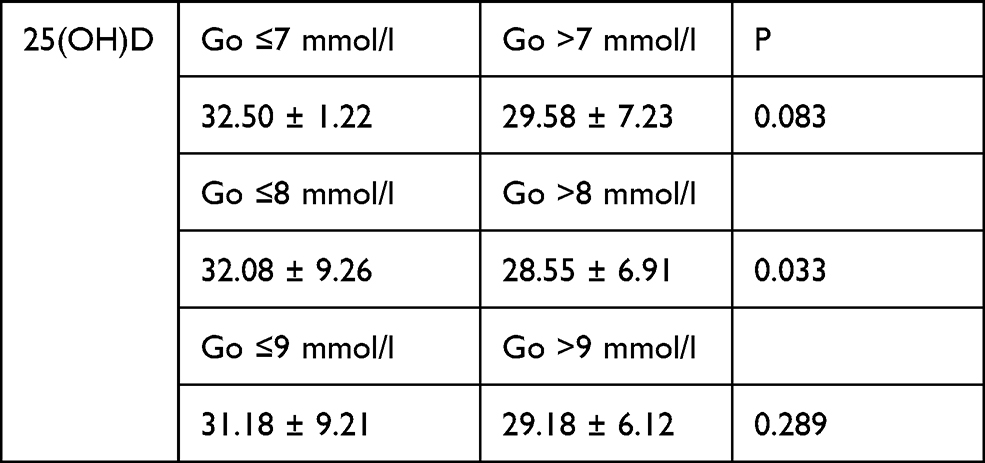 |
Table 1 Relationship Between 25(OH)D Level and Fasting Blood Glucose |
Analysis of the average 25(OH)D level at the cutoff point of HbA1C 6.5% shows that (Table 2) the average level of 25(OH)D in HbA1C ≤6.5% and HbA1C >6.5% groups were 32.02 ± 7.88 ng/mL and 30.20 ± 8.76 ng/mL, p = 0.335.
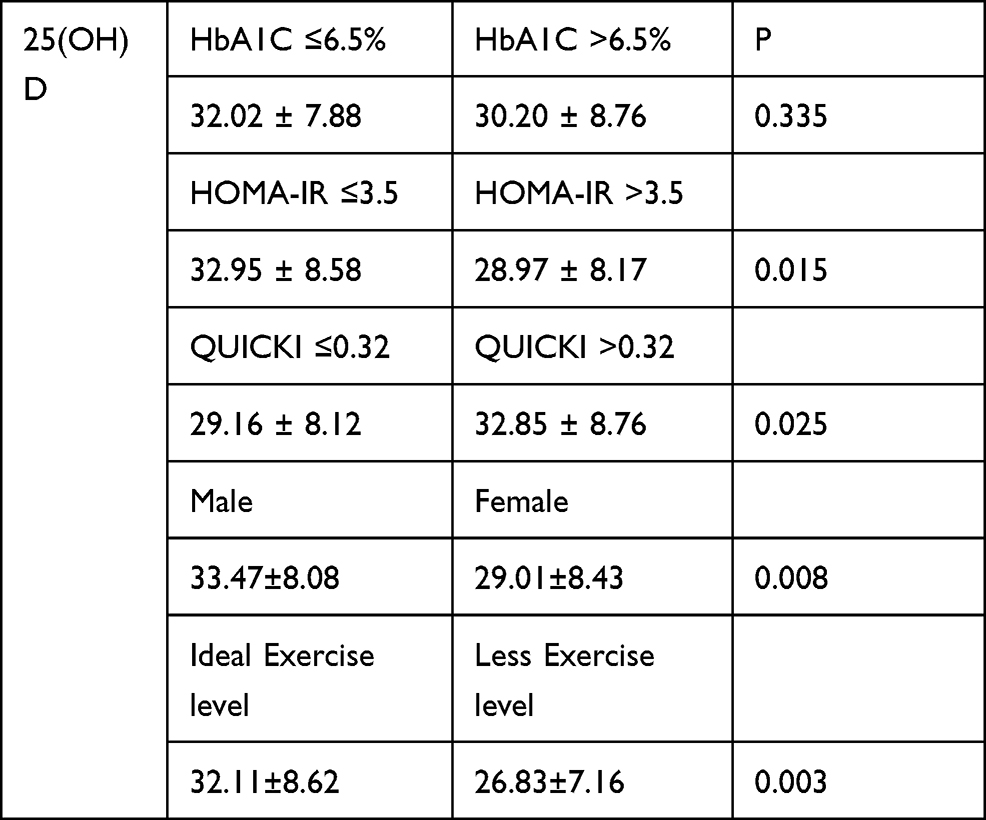 |
Table 2 Relationship Between 25(OH)D Level and HbA1C, HOMA-IR, and QUICKI |
Comparison of the average 25(OH)D levels of insulin resistant and non-insulin resistant patients at the cutoff points of HOMA-IR 3.5 and QUICKI 0.32 showed that the average 25(OH)D level of insulin resistant groups was lower than that of the non-insulin resistant group. This result was statistically significant, and the specific results were as follows: At the cutoff point of HOMA-IR 3.5, the average levels of 25(OH)D in HOMA-IR ≤3.5 and HOMA-IR >3.5 groups were 32.95 ± 8.58 ng/mL and 28.97 ± 8.17 ng/mL, p = 0.015. At the cutoff point of QUICKI 0.32, the average levels of 25(OH)D in QUICKI ≤0.32 and QUICKI >0.32 groups were 29.16 ± 8.12 ng/mL and 32.85 ± 8.76 ng/mL, p = 0.025. In comparison with patients who have a lower exercise level, patients with an ideal exercise level have higher average levels of 25(OH)D (32.11±8.62 vs 26.83±7.16, p=0.003). Moreover, the average levels of 25(OH)D in male patients are higher than in female patients (33.47±8.08 vs 29.01±8.43, p=0.008) (Table 2).
The percentage of vitamin D deficiency and insufficiency in the Go ≤8 mmol/l group was 43.9%, and in the Go >8 mmol/l group was 63.6%; the prevalence of ideal 25(OH)D level patients in the Go ≤8 mmol/l group was higher than that in the Go >8 mmol/l group. However, the difference was not statistically significant, with p = 0.052. Similar results were found in the HbA1C ≤6.5% and HbA1C >6.5% groups. Deficiency and insufficiency prevalence in the HbA1C >6.5% group were higher and ideal vitamin D status were lower than those of the HbA1C ≤6.5% group; however, the difference was not statistically significant, p = 0.521 (Table 3).
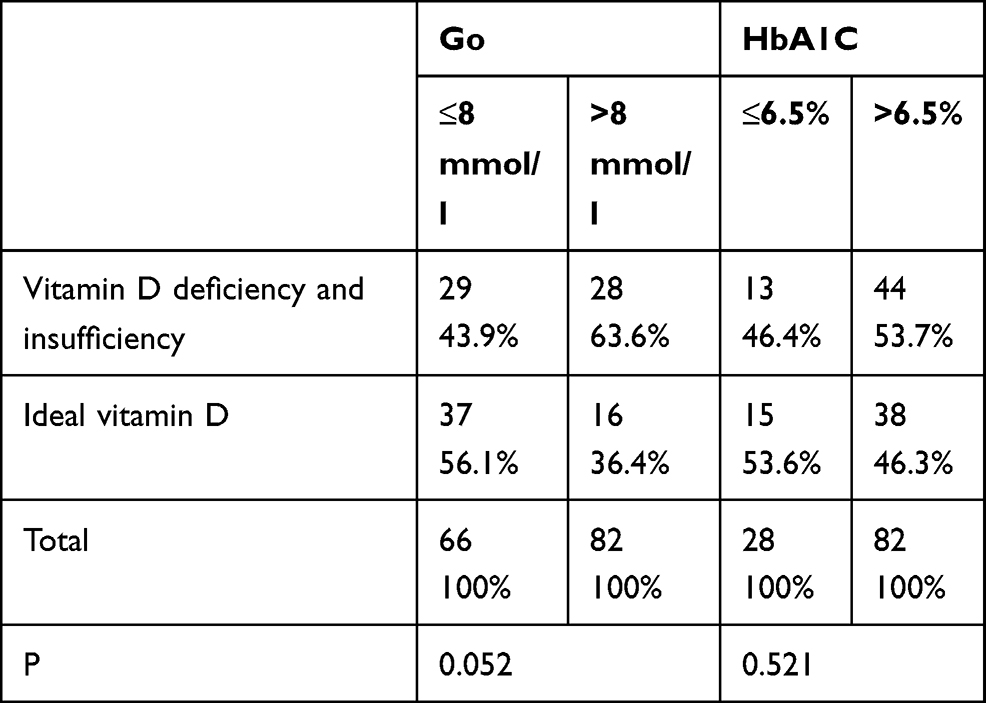 |
Table 3 Relationship Between Vitamin D Deficiency and Insufficiency, and Go and HbA1C |
There were 47/110 HOMA-IR ≤3.5 patients and 63/110 HOMA-IR >3.5 patients. Vitamin D deficiency and insufficiency was found in 36.2% of the patients of the HOMA-IR ≤3.5 group and 63.8% of patients had an ideal serum vitamin D level. These prevalence rates in the HOMA-IR >3.5 group were 63.5% of patients had vitamin D deficiency and insufficiency, and 36.5% patients had an ideal serum vitamin D level; this result had high statistical significance (p = 0.007). There were 45 QUICKI >0.32 patients and 65 QUICKI ≤0.32 patients. The QUICKI >0.32 group had a lower vitamin D deficiency and insufficiency rate (37.8%) and a higher ideal serum vitamin D rate (62.2%). These prevalence rates in the QUICKI ≤0.32 group were 61.5% and 38.5%, respectively, p = 0.020 (Table 4).
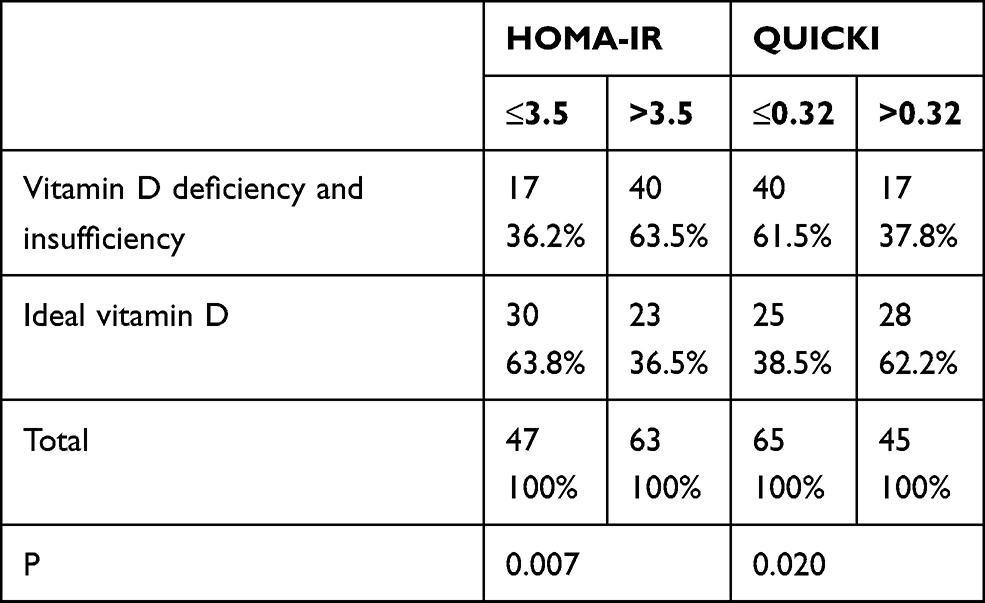 |
Table 4 Relationship Between Vitamin D Deficiency and Insufficiency, and HOMA-IR and QUICKI |
The correlation analysis indicated that (Table 5) there was no statistically significant correlation between 25(OH)D and HbA1C (r = −0.229, p = 0.14), age (r=0.045, p=0.641) and diabetes duration time (r=−0.007, p=0.994). Correlation analysis between serum 25(OH)D level and insulin resistance, with the QUICKI index, showed that the 25(OH)D level had a high statistically significant positive correlation with QUICKI, with r = 0.253, p = 0.008. With HOMA-IR, the 25(OH)D level had a statistically significant negative correlation with HOMA-IR, with r = 0.253, p = 0.008. The result of correlation analysis between serum 25(OH)D level with Go indicated that 25(OH)D level was negatively correlated with Go (r = −0.229, p = 0.016)
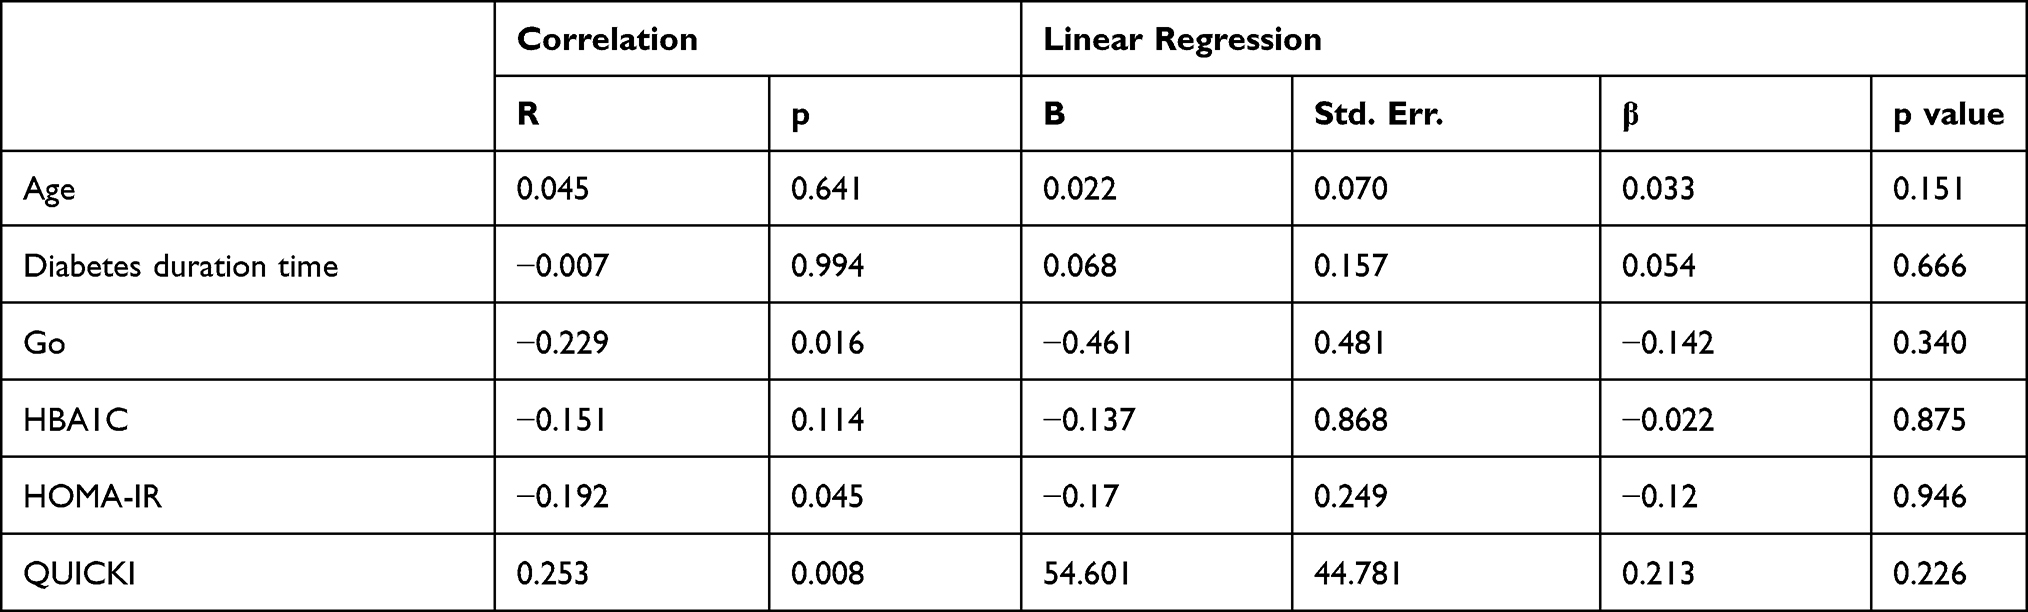 |
Table 5 Correlation Between Vitamin D Concentration and Fasting Blood Glucose, HbA1C, HOMA-IR, and QUICKI |
Discussion
Many studies have indicated that patients with type 2 diabetes have a high prevalence of vitamin D deficiency.1–3 In our study, the prevalence of vitamin D deficiency and insufficiency was found to be 51.8%, and the percentage of patients with an ideal level of 25(OH)D was 48.2%. The prevalence of vitamin D deficiency and insufficiency found in our study is lower than that found in other geographical areas.1,3 This difference can be attributed to the differences in living and eating habits of people in Vietnam compared to those of other countries reported in studies. Out results are similar to others study conducted in Vietnam.13
Previous studies showed that patients with a higher blood glucose level had a lower average level of 25(OH)D.9,14 The study of Bhatt et al14 on 5787 Korean adults, showed that the blood glucose levels of high 25(OH)D-level groups are lower than low 25(OH)D-level groups, similar to the study carried out by Yang et al9 with 1928 volunteers, where the 25(OH)D level of the FPG<5.6 group was higher than that of the FPG≥5.6 group. In our study, at the cutoff point of Go 8 mmol/l, the patient group with Go ≤8 mmol/l had a higher average level of 25(OH)D than the group with Go >8 mmol/l; this difference was statistically significant, with p = 0.033.
Physical activity is well known as a way to improve vitamin D status, and a study by Wanner et al15 showed that an increase of 10 min of objectively measured and self-reported moderate-to-vigorous activities per day was associated with an increase in circulating vitamin D of 0.32 ng/mL and of 0.18 ng/mL, respectively. In our study, the average level of 25(OH)D among patients in the ideal exercise level group was higher than those in less exercise level group, while the average level of 25(OH)D in male patients is higher than that of female patients. This may be because male patients engage in more physical activity and outdoor activity than female patients.
Besides fasting blood sugar, many studies indicate that vitamin D status is related to insulin resistance.16,17 In the study of Chung et al16 (on 1466 participants) and Dutta et al17 (on 157 prediabetes patients), the high 25(OH)D groups have a lower HOMA-IR and a higher QUICKI index. In parallel, in our study, at the cutoff point of 3.5 for HOMA-IR and 0.32 for QUICKI, patients in the high HOMA-IR group and patients in the low QUICKI group had a lower average level of 25(OH)D than those in the low HOMA-IR group and the high QUICKI group. The chi-square test also indicated that the prevalence of vitamin D deficiency and the insufficiency of patients in the high HOMA-IR group and low QUICKI group are higher than those in the low HOMA-IR group and high QUICKI group.
The correlation analysis indicated that the 25(OH)D level was negatively correlated with Go and HOMA-IR, with r coefficients of −0.229 and −0.192, respectively (p < 0.05). The 25(OH)D level was positively correlated with QUICKI, with r = 0.253; this had a high statistical significance, with p = 0.008. Our findings are consistent with previous studies.17–19
Conclusions
Vitamin D deficiency is prevalent in diabetes patients, while patients who have better glucose-related parameters such as fasting blood sugar, HOMA-IR and QUICKI have a better vitamin D status. Some blood sugar-related factors such as exercise level and sex are related to vitamin D status. Future studies should examine more vitamin D status and diabetes-related factors to clarify the role of vitamin D in the prevention and treatment of diabetes.
Ethics Approval and Informed Consent
The present study was approved by the Ethics Committee of Hue University of Medicine and Pharmacy (IRB number H2019/415) which confirmed that the study was conducted in accordance with the Declaration of Helsinki. All participants were informed about the purpose of the study. Written consent was obtained from all participants before data collection.
Disclosure
The authors declare no conflicts of interest.
References
1. AlHewishel MA, Bahgat M, Al Huwaiyshil A, Alsubie MA, Alhassan A. 25(OH)D serum level in non-diabetic and type II diabetic patients: a Cross-Sectional Study. Cureus. 2020;12(6):e8910. doi:10.7759/cureus.8910
2. Mei-juan D, Yuan-yuan L. Association of serum vitamin D with insulin ressitance and inflammatory factors in initially diagsosed with type 2 diabetes mellitus. J Med Postgrad. 2017;30:1057–1060.
3. Papadakis G, Villiotou V. Association between 25-hydroxyvitamin D levels and glycemic status. Curr Res Diabetes Obes J. 2017;1:001–004.
4. Maestro B, Campion J, Davila N, Calle C. Stimulation by 1,25-dihydroxyvitamin D3 of insulin receptor expression and insulin responsiveness for glucose transport in U-937 human promonocytic cells. Endocr J. 2000;47(4):383–391. doi:10.1507/endocrj.47.383
5. Zhou QG, Hou FF, Guo ZJ, Liang M, Wang GB, Zhang X. 1,25-Dihydroxyvitamin D improved the free fatty-acid-induced insulin resistance in cultured C2C12 cells. Diabetes Metab Res Rev. 2008;24(6):459–464. doi:10.1002/dmrr.873
6. Chiu KC, Chu A, Go VL, Saad MF. Hypovitaminosis D is associated with insulin resistance and beta cell dysfunction. Am J Clin Nutr. 2004;79(5):820–825. doi:10.1093/ajcn/79.5.820
7. Kayaniyil S, Vieth R, Retnakaran R, et al. Association of vitamin D with insulin resistance and beta-cell dysfunction in subjects at risk for type 2 diabetes. Diabetes Care. 2010;33(6):1379–1381. doi:10.2337/dc09-2321
8. Pereira-Santos M, Costa PR, Assis AM, Santos CA, Santos DB. Obesity and vitamin D deficiency: a systematic review and meta-analysis. Obes Rev. 2015;16(4):341–349. doi:10.1111/obr.12239
9. Yang K, Liu J, Fu S, et al. Vitamin D status and correlation with glucose and lipid metabolism in Gansu Province, China. Diabetes Metab Syndr Obes. 2020;13:1555–1563. doi:10.2147/DMSO.S249049
10. Association AD. Classification and diagnosis of diabetes: standards of medical care in Diabetes–2020. Diabetes Care. 2020;43(Supplement 1):s14–s31. doi:10.2337/dc20-S002
11. Lee S, Choi S, Kim HJ, et al. Cutoff values of surrogate measures of insulin resistance for metabolic syndrome in Korean non-diabetic adults. J Korean Med Sci. 2006;21(4):695–700. doi:10.3346/jkms.2006.21.4.695
12. Campbell HM, Khan N, Cone C, Raisch DW. Relationship between diet, exercise habits, and health status among patients with diabetes. Res Social Adm Pharm. 2011;7(2):151–161. doi:10.1016/j.sapharm.2010.03.002
13. Tuyen le D, Hien VT, Binh PT, Yamamoto S. Calcium and vitamin D deficiency in Vietnamese: recommendations for an intervention strategy. J Nutr Sci Vitaminol (Tokyo). 2016;62(1):1–5. doi:10.3177/jnsv.62.1
14. Bhatt SP, Misra A, Gulati S, Singh N, Pandey RM. Lower vitamin D levels are associated with higher blood glucose levels in Asian Indian women with pre-diabetes: a Population-Based Cross-Sectional Study in North India. BMJ Open Diabetes Res Care. 2018;6(1):e000501. doi:10.1136/bmjdrc-2017-000501
15. Wanner M, Richard A, Martin B, Linseisen J, Rohrmann S. Associations between objective and self-reported physical activity and vitamin D serum levels in the US population. Cancer Causes Control. 2015;26(6):881–891. doi:10.1007/s10552-015-0563-y
16. Chung SJ, Lee YA, Hong H, et al. Inverse relationship between vitamin D status and insulin resistance and the risk of impaired fasting glucose in Korean children and adolescents: the Korean National Health and Nutrition Examination Survey (KNHANES) 2009–2010. Public Health Nutr. 2014;17(4):795–802. doi:10.1017/S1368980013002334
17. Dutta D, Maisnam I, Shrivastava A, et al. Serum vitamin-D predicts insulin resistance in individuals with prediabetes. Indian J Med Res. 2013;138(6):853–860.
18. Jang HB, Lee HJ, Park JY, Kang JH, Song J. Association between serum vitamin d and metabolic risk factors in korean schoolgirls. Osong Public Health Res Perspect. 2013;4(4):179–186. doi:10.1016/j.phrp.2013.06.004
19. Yaqiong L, Guohua W, Fuyan Y, Wei L, Dan S, Yi Z. Study on the levels of 25(OH)D, inflammation markers and glucose and fat metabolism indexes in pregnant women of Han nationality in Jiangsu province with gestational diabetes mellitus. Medicine. 2020;99(35):e21654. doi:10.1097/MD.0000000000021654
 © 2021 The Author(s). This work is published and licensed by Dove Medical Press Limited. The
full terms of this license are available at https://www.dovepress.com/terms
and incorporate the Creative Commons Attribution
- Non Commercial (unported, 3.0) License.
By accessing the work you hereby accept the Terms. Non-commercial uses of the work are permitted
without any further permission from Dove Medical Press Limited, provided the work is properly
attributed. For permission for commercial use of this work, please see paragraphs 4.2 and 5 of our Terms.
© 2021 The Author(s). This work is published and licensed by Dove Medical Press Limited. The
full terms of this license are available at https://www.dovepress.com/terms
and incorporate the Creative Commons Attribution
- Non Commercial (unported, 3.0) License.
By accessing the work you hereby accept the Terms. Non-commercial uses of the work are permitted
without any further permission from Dove Medical Press Limited, provided the work is properly
attributed. For permission for commercial use of this work, please see paragraphs 4.2 and 5 of our Terms.