Back to Journals » Diabetes, Metabolic Syndrome and Obesity » Volume 14
Relationship Between Skeletal Muscle Mass to Visceral Fat Area Ratio and Cardiovascular Risk in Type 2 Diabetes
Authors Liu D, Zhong J, Wen W, Ruan Y, Zhang Z, Sun J ![]() , Chen H
, Chen H ![]()
Received 23 June 2021
Accepted for publication 3 August 2021
Published 25 August 2021 Volume 2021:14 Pages 3733—3742
DOI https://doi.org/10.2147/DMSO.S326195
Checked for plagiarism Yes
Review by Single anonymous peer review
Peer reviewer comments 4
Editor who approved publication: Prof. Dr. Antonio Brunetti
Dixing Liu, Jiana Zhong, Weiheng Wen, Yuting Ruan, Zhen Zhang, Jia Sun, Hong Chen
Department of Endocrinology, Zhujiang Hospital, Southern Medical University, Guangzhou, Guangdong, People’s Republic of China
Correspondence: Hong Chen; Jia Sun
Department of Endocrinology, Zhujiang Hospital, Southern Medical University, 253 Industrial Avenue, Guangzhou, Guangdong, 510282, People’s Republic of China
Tel +86 13602759769
; +86 13751822925
Email [email protected]; [email protected]
Purpose: Either visceral fat or muscle mass is identified to be correlated with cardiometabolic diseases, especially in type 2 diabetes (T2DM). But, the synergistical effect of visceral fat along with skeletal muscle on the risk of cardiovascular diseases (CVD) in T2DM still remains controversial. Thus, we investigated the relationship between skeletal muscle mass to visceral fat area ratio (SVR) and 10-yr CVD risk scores.
Patients and Methods: A total of 291 T2DM patients aged 40– 80 years were enrolled in the current study. SVR was evaluated based on bioelectrical impedance measurements. Both Framingham risk score system and China-PAR risk model were applied to estimate future 10-yr CVD risk in T2DM population.
Results: The 10-yr CVD risk scores increased with the decreased SVR tertiles in T2DM (All P< 0.001). SVR value was obviously lower in the high-risk group than that of low- or moderate-risk group (All P< 0.05). However, no significant differences were observed in BMI among different CVD risk groups. Besides, SVR was correlated with Framingham risk score (r=− 0.408; P< 0.001) and China-PAR risk score (r=− 0.336; P< 0.001). HOMA-IR, triglycerides and blood pressure were also inversely related to SVR (All P< 0.05). Furthermore, SVR value was independently correlated with both Framingham 10-yr CVD risk score (β=− 0.074, P=0.047) and China-PAR risk score (β=− 0.100, P=0.004) after adjustment for confounding factors, including age, gender, BMI, FPG, HbA1c, diabetes duration, albumin, creatinine, uric acid, smoking, blood pressure and blood lipid. The linear regression analysis was also conducted for men and women, respectively, indicating that the negative relationship between SVR and 10-yr CVD risk was observed in men but not in women.
Conclusion: T2DM populations who have lower SVR value are more likely to increase CVD risk. SVR levels show marked and inverse correlation with estimated 10-yr CVD risk in T2DM, indicating that SVR could be a valuable parameter to assess the risk of CVD events in clinical practice, especially in men.
Keywords: type 2 diabetes mellitus, cardiovascular diseases, skeletal muscle mass to visceral fat area ratio, risk assessment
Introduction
Cardiovascular diseases (CVD) remain amongst the top causes of mortality globally. While type 2 diabetes (T2DM) is known to be a major risk factor for CVD events and CVD associated mortality.1,2 Compared with general population, patients with T2DM are 2 to 4 times more likely to develop CVD3 and more than 50% of T2DM patients died due to cardiovascular events.4 Currently, changes in body composition were considered as important factors for developing of CVD.5 Among them, excessive accumulation of visceral fat was strongly correlated with cardiometabolic risk factors, including hypertension and dyslipidemia, especially in T2DM populations.6–8 In addition to increasing visceral fat, the reduction of skeletal muscle mass was also link with CVD. A prospective research illustrated that skeletal muscle mass was inversely related to 10-yr CVD incidence after adjusting for various confounders.9 A number of previous cross-sectional studies have also indicated that low appendicular skeletal muscle mass was significantly associated with stroke and ischemic heart disease.10,11
Unfortunately, fat accumulation might always be combined with decreased muscle quantity, which was termed as sarcopenic obesity. Cross-sectional studies demonstrated that combined phenotypes of obesity with lower muscle mass to be positively associated with dyslipidemia,12 metabolic syndrome,13 and hypertension.14 Existing work even indicated a close relationship between sarcopenic obesity and elevated Framingham CVD risk scores in Korean non-diabetic population.15 However, several prospective studies did not consider such combined phenotype to have a higher risk for the development of CVD incidents in the elderly.16–18 Thus, the association between visceral obesity along with low muscle mass and the hazard of CVD has not been fully clarified in T2DM.
Remarkably, there is no unified diagnostic standard for sarcopenic obesity currently, which may result in the large differences in the study conclusions.19 Thus, a more uniform and quantifiable index to evaluate the combined changes in visceral fat and muscle quantity is required in clinical practice. While skeletal muscle mass to visceral fat area ratio (SVR), combining two anthropometric parameters, has been established to be a supplementary measure of sarcopenic obesity at present. The decrease of SVR can reflect the changes in body composition arising from the reduction in skeletal muscle amount and the increase of visceral fat to some extent. Recently, a growing body of studies have shown the role of SVR in cardiometabolic disease, such as arterial stiffness,20 non-alcoholic fatty liver disease21 and metabolic phenotype.22 Thus, the current study is proposed to explore the association between SVR and 10-yr CVD risk as estimated using Framingham and China-PAR risk model in T2DM patients.
Materials and Methods
Study Participants
A total of 291 T2DM patients who visited Zhujiang Hospital of Southern Medical University between March 2019 and January 2021 were enrolled in our study. The patients aged 40–80 years, providing detailed information required for evaluating the 10-yr CVD risk were included in the current study. All participants were not diagnosed with myocardial ischemia or stroke before enrollment. Exclusion criteria included acute metabolic complication of diabetes, such as diabetic ketoacidosis and lactic acidosis; thyroid dysfunction; severe kidney or liver dysfunction; mental disorders; Cushing syndrome; pregnant or lactating women. Patients with a history of malignancy also failed to meet the inclusion standard of study. Besides, patients who have had bariatric surgery, using steroid, or receiving weight loss medication currently (ie, Orlistat, Phentermine/Topiramate, Naltrexone/bupropion), or with incomplete biochemical parameters and anthropometric were also excluded.
Measurements of Body Composition
Bioelectrical impedance analyzer (BIA) was applied to measure body composition with 15 reactance measurements. BIA (Jawon Medical Co., Ltd., Korea) is now considered a non-invasive and accurate method for body composition evaluation. The visceral fat area and skeletal muscle mass were measured. Then, the SVR value was calculated as appendicular skeletal muscle mass (kg) divided by the visceral fat area (cm2). Since there were no uniform standards for classifying SVR levels, all study participants were grouped according to the SVR tertiles (T1-T3).
Clinical Indicators Measurements
Each participant underwent a complete physical examination in order to obtain measurements of waist circumference, weight and height according to standardized methods. BMI (kg/m2) was calculated as weight divided by the square of height. After resting for at least 5 minutes, the blood pressure was taken in duplicate, and then the average value was computed.
All blood samples were collected after overnight fasting for 10h. Blood analyses were performed in the hospital laboratory to measure fasting C-peptide, fasting plasma glucose (FPG), uric acid, albumin, creatinine and blood lipids, including LDL-cholesterol, total cholesterol, triglycerides and HDL-cholesterol. Glycated hemoglobin (HbA1c) was also performed using high-performance liquid chromatography. A Correct Homeostasis Assessment Model (HOMA2) Calculator23 was applied to estimate HOMA-IR and insulin sensitivity index. Ultrasound examinations were performed by trained sonographers to evaluate the presence of carotid plaque and fatty liver.
Calculation of 10-Yr Cardiovascular Risk Scores
The Framingham Risk Score and China-PAR risk model are two algorithms for assessing the individual absolute 10-yr risk of developing CVD. The Framingham 10-yr CVD risk score system, including age, blood pressure, current smoking, HDL-cholesterol and total cholesterol for each gender, is commonly used worldwide, where Framingham 10-yr CVD risk score<10% was considered as low risk, 10–20% was moderate risk, and more than 20% was high risk.24 The 10-yr risk for CVD events was also evaluated by China-PAR risk model (https://www.cvdrisk.com.cn/ASCVD/Eval), which has been established to be the most suitable for Chinese, including gender, age, blood pressure, waist circumference, HDL-cholesterol, total cholesterol, smoking status, diabetes mellitus, family history of CVD, and residential area currently. China-PAR risk score<5% was considered as low risk, a total score of 5 to 9.9% as intermediate risk, and ≥10% as high risk.25
Statistical Analyses
The continuous data of normal distribution in different groups were compared by One-way ANOVA, while Kruskal–Wallis test was performed for skewed distributed parameters. The Post Hoc test was conducted using LSD test. Categorical variables were analyzed with Chi-Square test. Besides, the relationship between SVR and clinical variables was ascertained using Spearman correlation analysis. Linear regression analysis was further conducted to evaluate the relationship between SVR and 10-Yr CVD risk after controlling the confounding factors, including age, gender, BMI, FPG, HbA1c, diabetes duration, albumin, creatinine, uric acid, smoking, blood pressure and blood lipid. All statistical analyses were carried out by IBM SPSS V.26.0 (Armonk, NY, USA). Bar plots were generated by GraphPad Prism V.8.0 (San Diego, CA, USA). The P value<0.05 was considered significance (two-tailed).
Results
Characteristics of Study Participants by SVR Tertiles
In total, 291 T2DM patients aged 40–80 years were included in this cross-sectional study, of which 57.4% (n=167) were males and 42.6% (n=124) were females. The patients were divided into three groups according to SVR tertiles, with tertile 1 having the lowest and tertile 3 the highest level. The characteristics of participants are presented in Table 1. The patients with the lowest level of SVR tertile tend to be oldest (P=0.010). As shown in Table 1, BMI and waist circumference decreased from T1 to T3, as were their systolic blood pressure, uric acid and triglycerides (All P<0.05), while a positive tendency could be observed in HDL-cholesterol (P=0.001). Additionally, compared with T2 and T3 groups, 10-yr CVD risk scores assessed by both Framingham and China-PAR model were highest in T1 group (All P<0.05). Furthermore, those with lower SVR levels were more likely to suffer from carotid plaque (P=0.018), fatty liver disease (P<0.001), and metabolic syndrome (P<0.001). We also found that HOMA-IR value tended to be higher, but the insulin sensitivity index was lower in T1 group than that of group T3 (All P<0.05). However, no significant differences were observed in diabetes duration and HbA1c among SVR tertiles groups (All P>0.05).
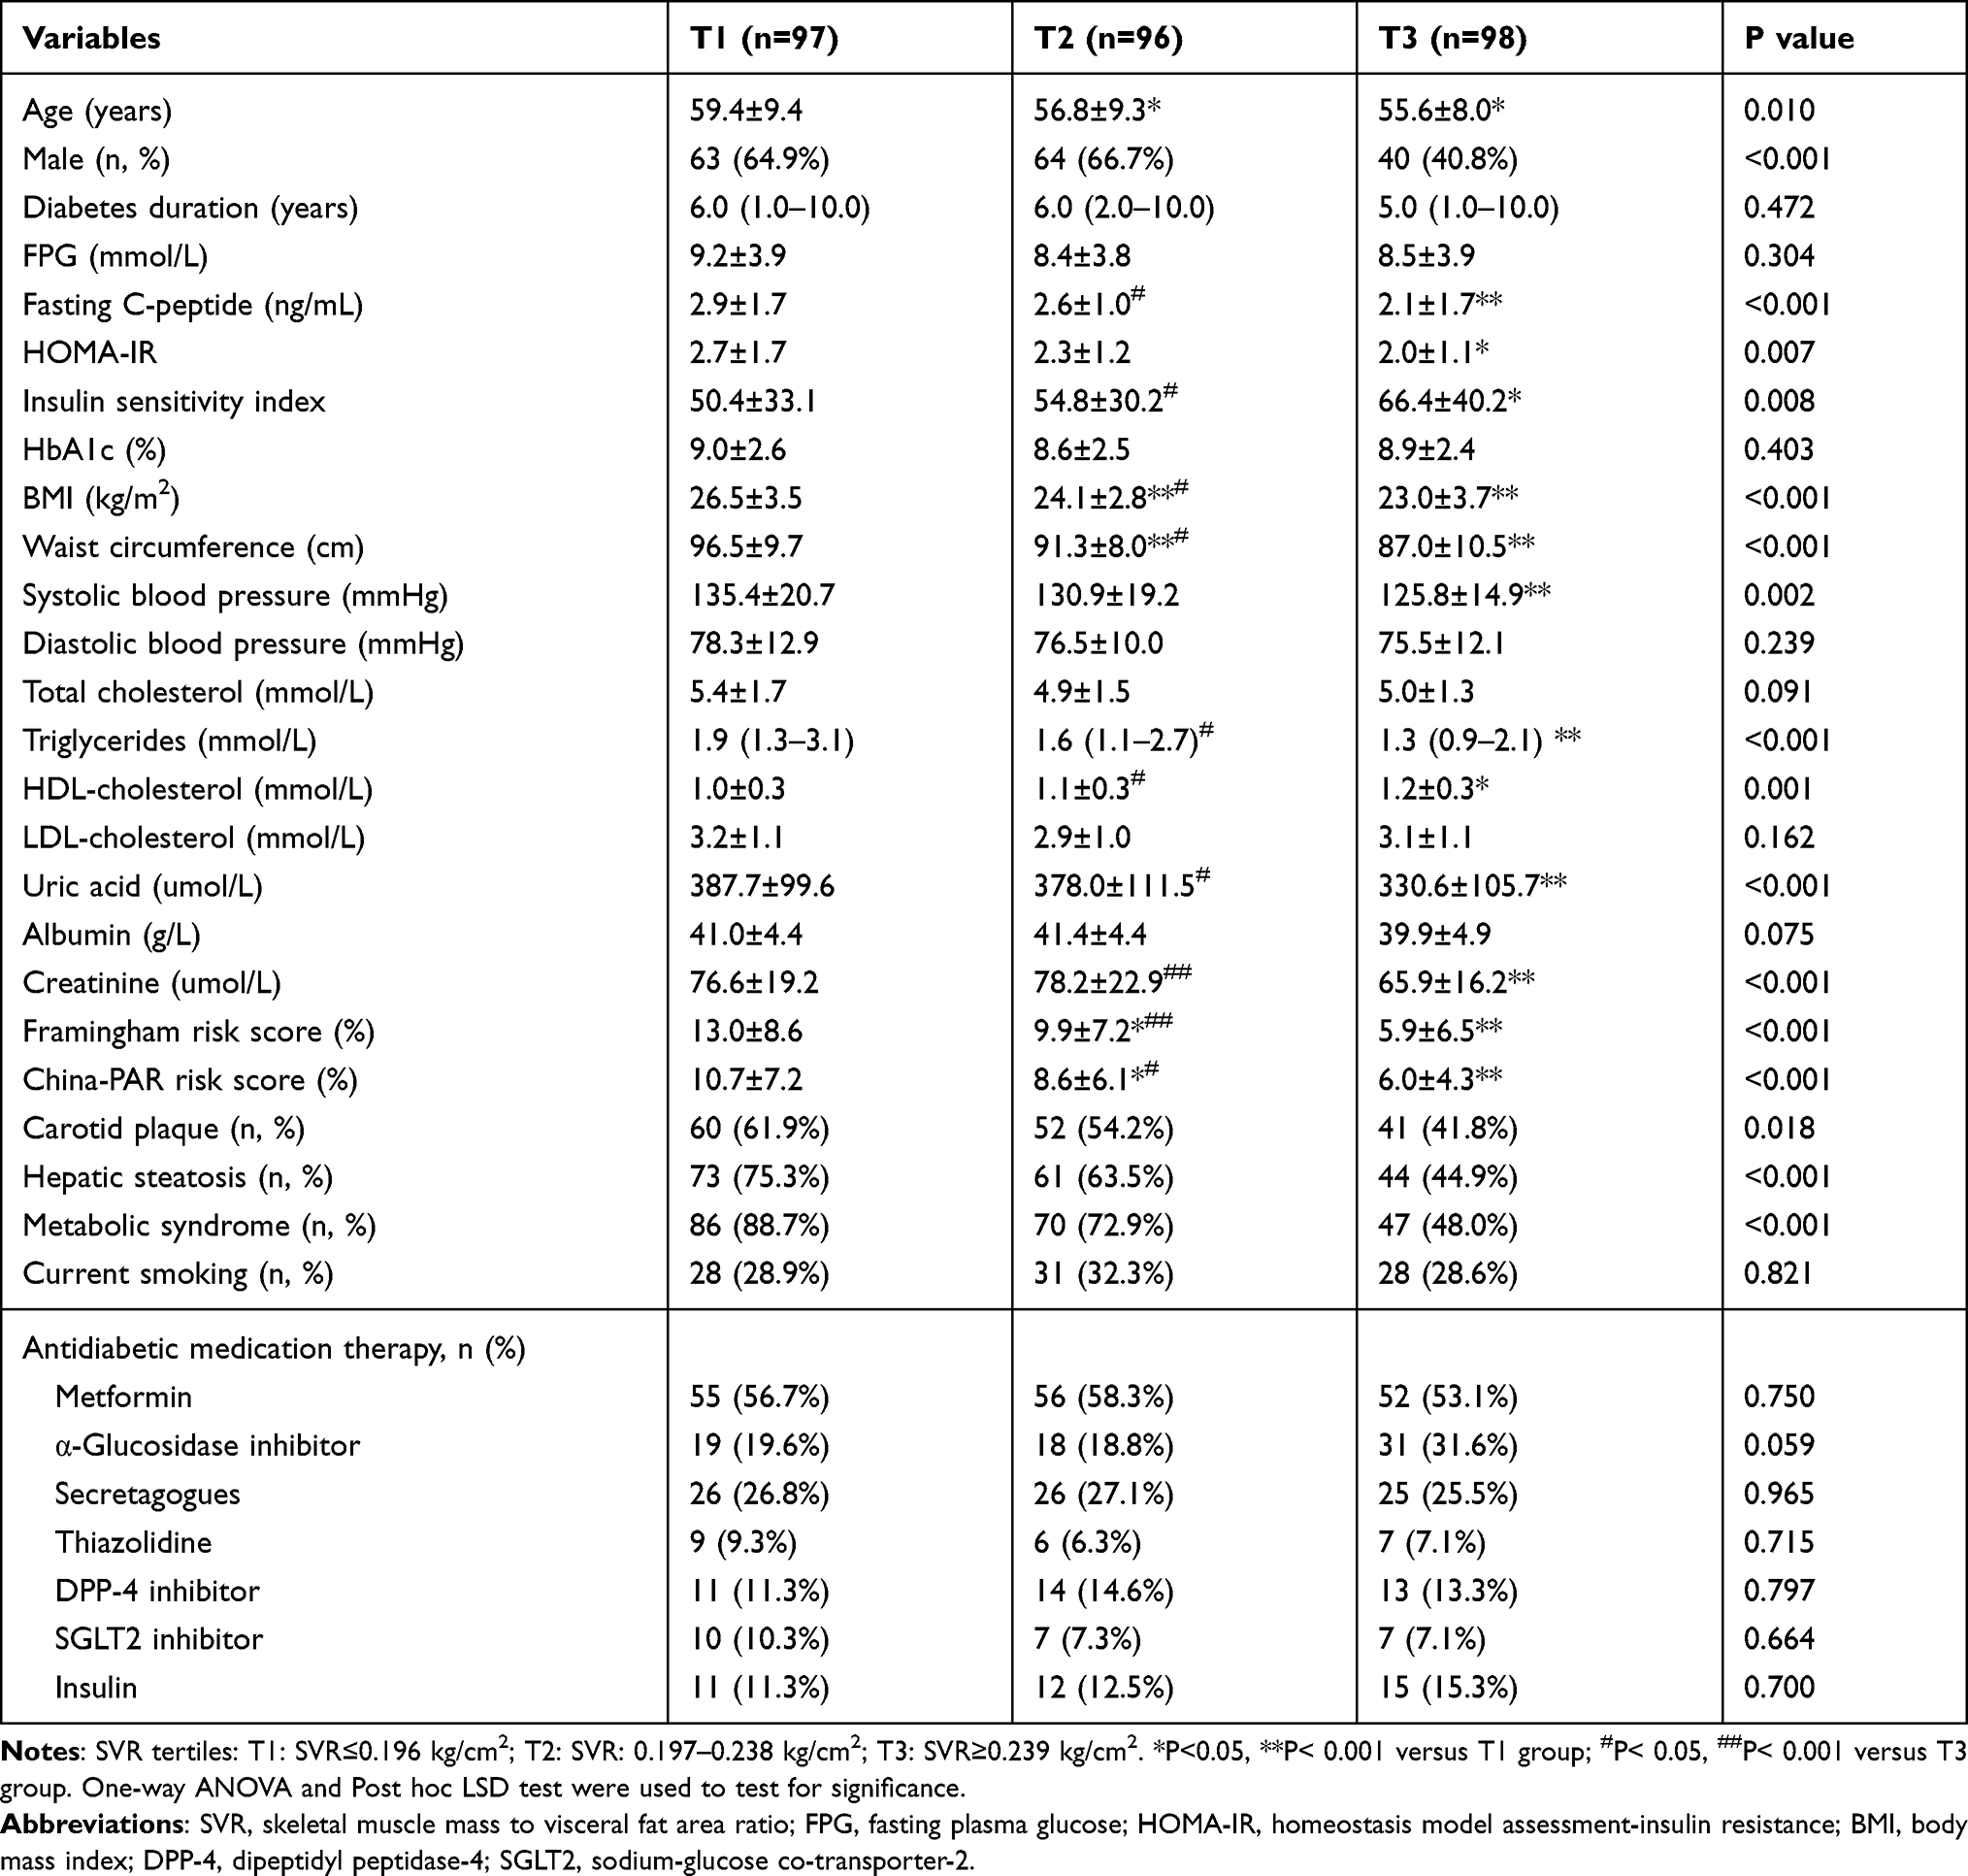 |
Table 1 Characteristics of T2DM Patients with Tertiles Stratification According to SVR |
SVR and Anthropometric Among T2DM with Different 10-Yr CVD Risk Grades
Based on the 10-yr CVD risk scores, the study participants were divided into low-, moderate- or high-risk group. When comparing SVR values in different groups, a statistically significant difference was shown in the comparisons (All P<0.05). The SVR levels in our research was 0.261±0.113kg/cm2 in Framingham low-risk (FRS<10%) group, 0.223±0.087kg/cm2 in moderate-risk (FRS 10–20%) group, and only 0.180±0.038kg/cm2 in the high-risk (FRS>20%) group (Figure 1A). Similarly, the SVR values were obviously lower in high-risk group than that of low- or moderate-risk group assessed by China-PAR risk model (P<0.05) (Figure 2A). However, significant pairwise differences in BMI and waist circumference among different CVD risk groups did not always exist (Figures 1B–C and 2B–C). Consistently, the proportions of SVR tertiles (T1-T3) also differed significantly among different Framingham 10-yr CVD Risk Grades (P<0.001). As shown in Figure 3, the highest proportion of T3 was found in the low-risk group, whereas the proportion of T1 was considerably higher in the high-risk group (Figure 3A). Similar results were observed in China-PAR risk score model (Figure 3B).
 |
Figure 1 Comparison of SVR, BMI and waist circumference among T2DM patients with different CVD risks assessed by Framingham risk score. (A) The comparison of SVR values among different CVD risk groups. The SVR value was 0.261±0.113kg/cm2 in Framingham low-risk group, 0.223±0.087kg/cm2 in moderate-risk group, and 0.180±0.038 kg/cm2 in high-risk group. All pairwise comparisons of the SVR values among different CVD risk groups were statistically significant (All P<0.05). (B) The comparison of BMI among different CVD risk groups. The BMI was 24.4±3.6kg/m2 in Framingham low-risk group, 24.6±3.8kg/m2 in moderate-risk group, and 25.4±3.3kg/m2 in high-risk group. No significant differences were observed in BMI among different CVD risk groups (All P>0.05). (C) The comparison of waist circumference among different CVD risk groups. The waist circumference was 90.0±10.2cm in low-risk group, 93.0±10.2cm in moderate-risk group, and 95.5±8.2cm in high-risk group. The waist circumference in low-risk group was significantly lower than that in moderate- and high-risk groups (Both P<0.05), while the difference between moderate- and high-risk group was not significant (P=0.206). Note: Framingham 10-yr CVD risk scores <10% was considered as low risk, 10–20% was moderate risk, and >20% was high risk. P value for significance among different groups was determined by One-way ANOVA and the Post Hoc test was conducted using LSD test. |
 |
Figure 2 Comparison of SVR, BMI and waist circumference among T2DM patients with different CVD risks assessed by China-PAR risk model. (A) The comparison of SVR values among different CVD risk groups. The SVR value was 0.272±0.113kg/cm2 in China-PAR low-risk group, 0.244±0.114kg/cm2 in moderate-risk group, and 0.199±0.050kg/cm2 in the high-risk group. All pairwise comparisons of the SVR values among different CVD risk groups were statistically significant (All P<0.05). (B) The comparison of BMI among different CVD risk groups. The BMI was 23.9±3.4kg/cm2 in China-PAR low-risk group, 25.1±4.2kg/cm2 in moderate-risk group, and 24.8±3.3kg/cm2 in high-risk group. The BMI in low-risk group was lower than that in moderate-risk groups (P=0.027). No statistical differences were found between low- and high-risk group (P=0.106), or moderate- and high-risk group (P=0.551). (C) The comparison of waist circumference among different CVD risk groups. The waist circumference was 88.8±9.9cm in China-PAR low-risk group, 93.4±11.3cm in moderate-risk group, and 93.1±8.8cm in high-risk group. The waist circumference in low-risk group was significantly lower than that in moderate- and high-risk groups (Both P<0.05), while the difference between moderate- and high-risk group was not significant (P=0.849). Note: China-PAR risk scores <5% was considered as low risk, 5–9.9% was moderate risk, ≥10% was high risk. P value for significance among different groups was determined by One-way ANOVA and the Post Hoc test was conducted using LSD test. |
 |
Figure 3 The proportion of different tertiles of SVR among different CVD risks. Note: Proportion of different tertiles (T1-T3) of SVR among different CVD risk groups defined by Framingham Risk Score (A) and China-PAR risk model (B). As shown in Fig A and Fig B, the highest proportion of T3 was found in the low-risk group, whereas the proportion of T1 was considerably higher in the high-risk group (Both P<0.001). |
Relationship Between SVR and Other Variables
The association between SVR and clinical parameters in the whole study population and by gender are summarized in Table 2. Of all the study participants, Spearman correlation analysis revealed that SVR was significantly correlated with Framingham risk score (r=−0.408; P <0.001) and China-PAR risk score (r=−0.336; P<0.001). Besides, age, waist circumference, BMI, HOMA-IR, triglycerides, systolic blood pressure, diastolic blood pressure and uric acid were inversely related to SVR (All P<0.05), while insulin sensitivity index and HDL-cholesterol showed positive association with it (All P<0.001). The results of the correlation analysis described above were consistent across genders.
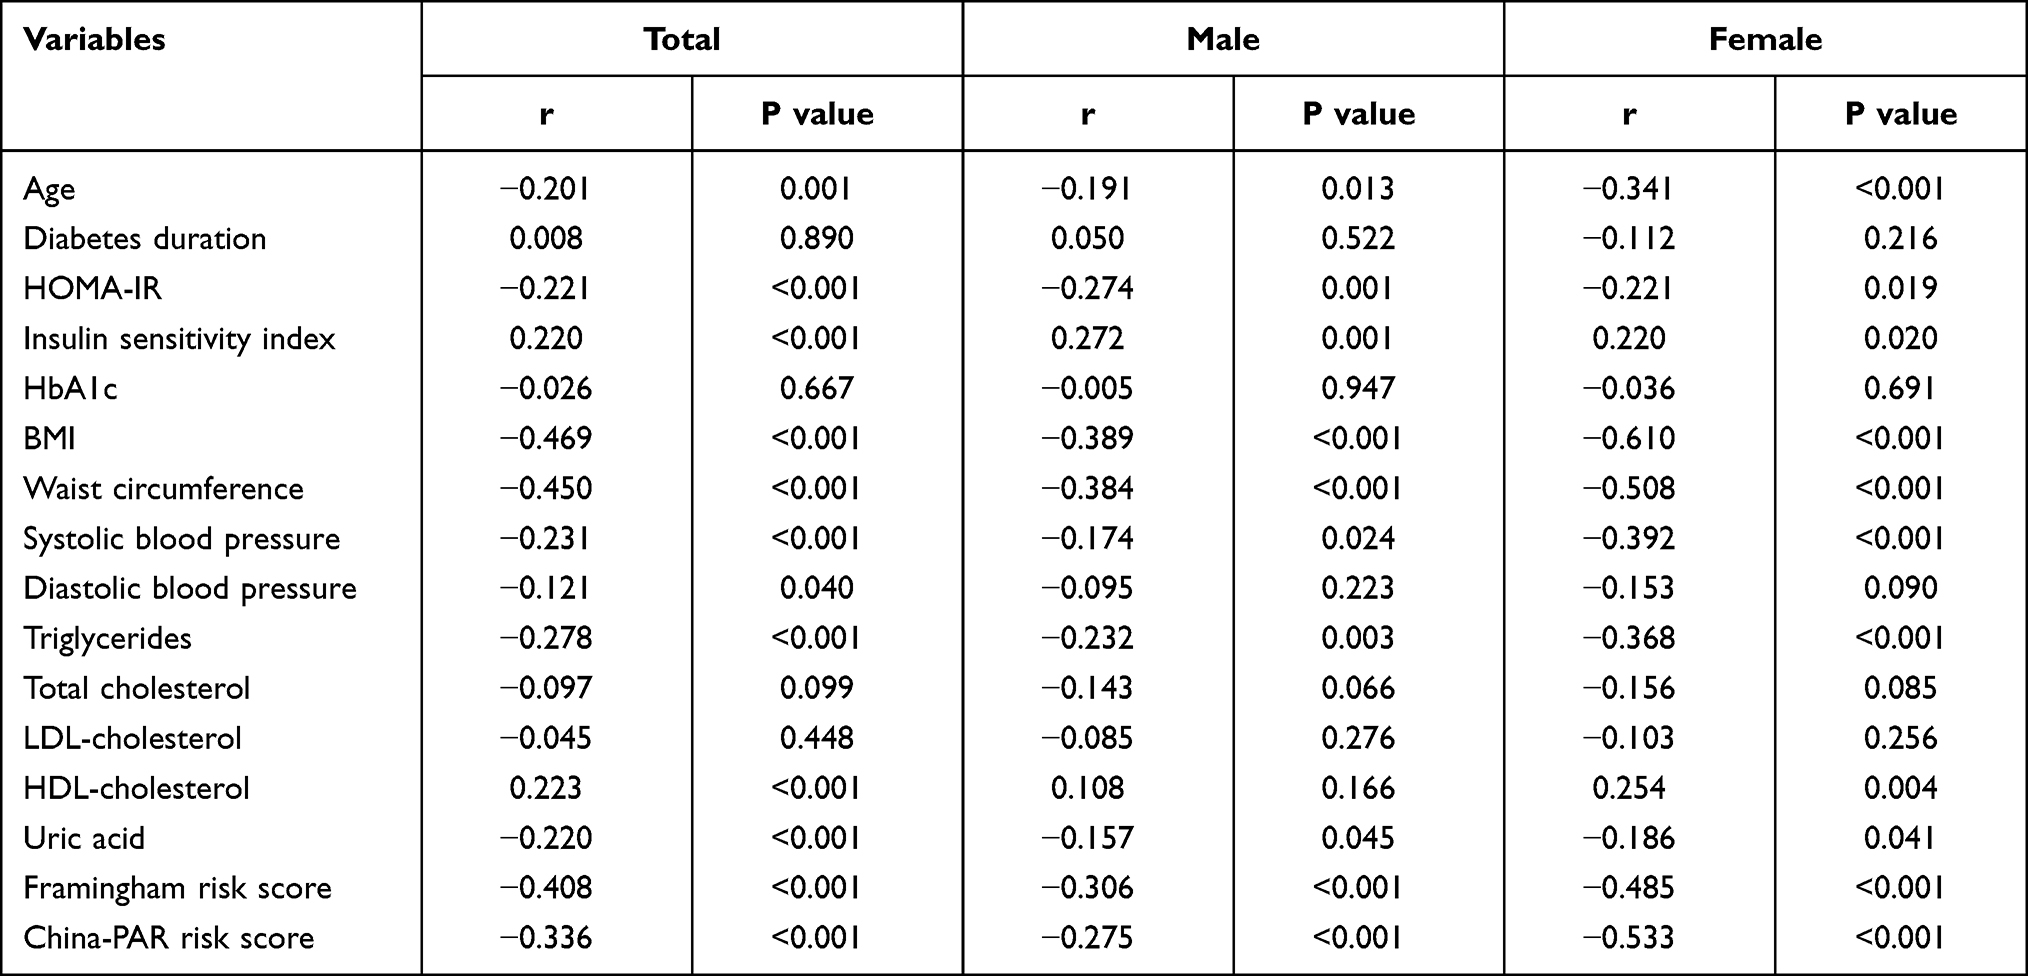 |
Table 2 Correlation of SVR and Other Variables in T2DM Patients |
Linear Regression Analysis of SVR and 10-Yr CVD Risk
In the multinomial linear regression model, significant association existed between SVR and Framingham risk score after adjusting for gender and age (β=−0.168, P<0.001) (Table 3). Further adjustment of BMI, the link between SVR and Framingham risk score still reach statistical significance (β=−0.152, P=0.004). Besides, even after controlling for FPG, HbA1c, diabetes duration, albumin, creatinine, uric acid, smoking, systolic blood pressure, diastolic blood pressure, total cholesterol and triglycerides, the relationship between SVR and Framingham risk score remained significant (β=−0.074, P=0.047). Analogously, the significant effect of SVR on China-PAR risk score remained after adjusting for all of the above confounders among all participants (β=−0.100, P=0.004). Finally, the regression analysis was also performed for male and female separately with essentially the similar results after adjustment of age, BMI, FPG, HbA1c, diabetes duration, albumin, creatinine, uric acid and smoking (All P<0.05). However, further adjusting for blood pressure and blood lipid, no significant relationship was observed in female (Table 4).
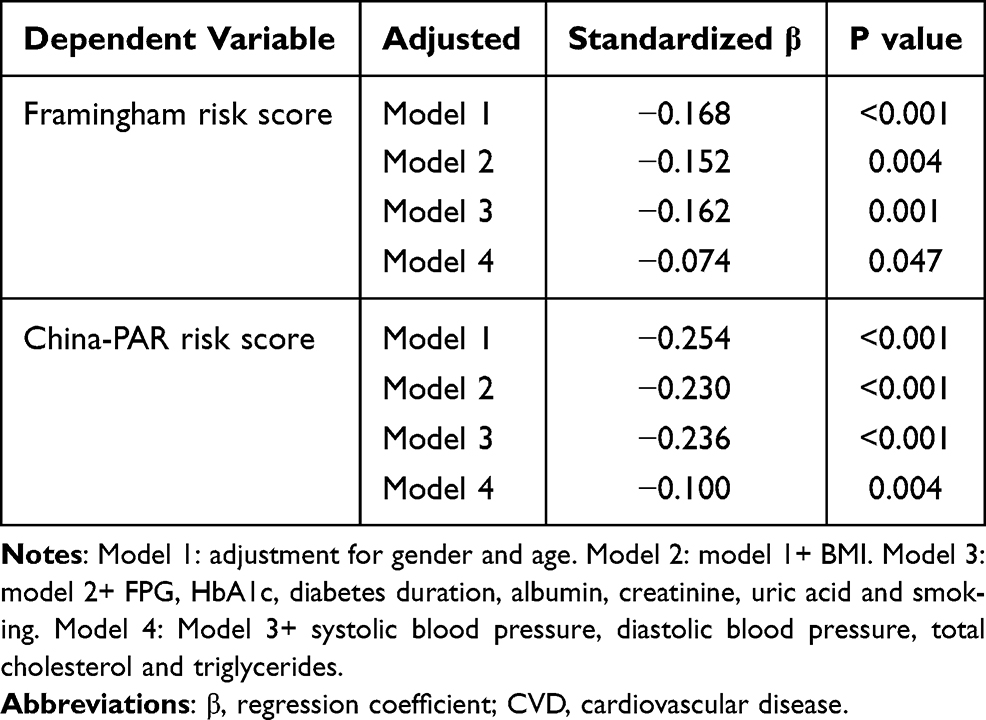 |
Table 3 Linear Regression Analysis of the Association Between SVR and 10-Yr CVD Risk Score |
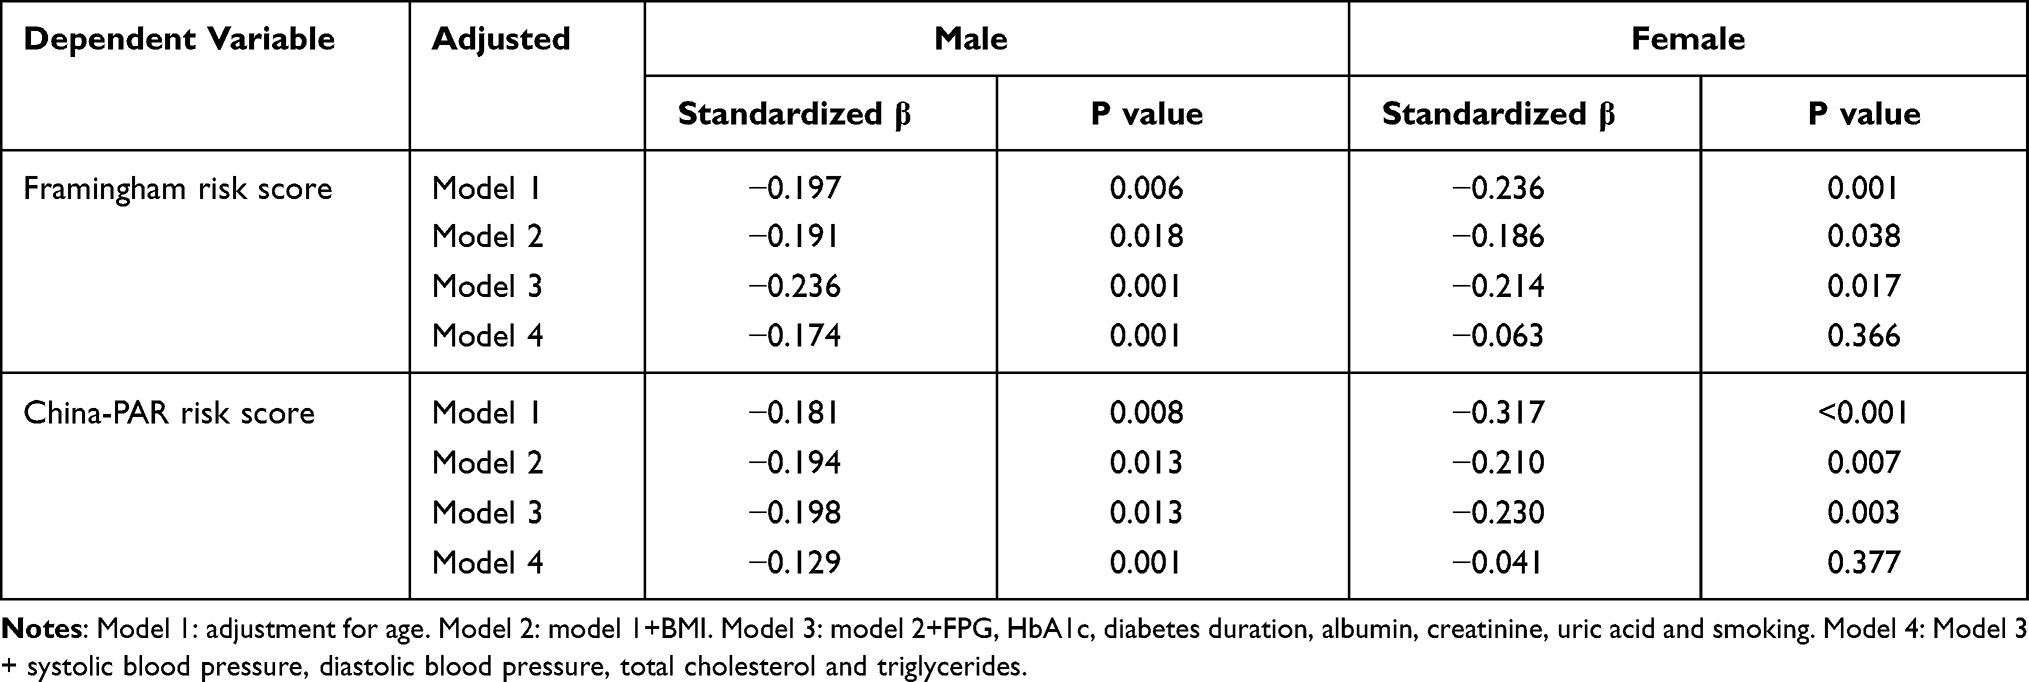 |
Table 4 Linear Regression Analysis of SVR and 10-Yr CVD Risk Score in T2DM Patients by Different Gender |
Discussion
The present study reports an independent inverse association between SVR and 10-yr CVD risk assessed not only by Framingham risk score system but also by China-PAR risk model of the whole study population. T2DM populations who have lower SVR value are more likely to increase CVD risk, especially in men.
Although consistent relationship has been made between visceral fat or skeletal muscle and elevated major risk factors for CVD,26 the correlation between the combination of high visceral fat and low muscle mass and the risk of CVD events has not been well illustrated completely, especially among T2DM patients. T2DM individuals will result in excessive visceral fat frequently, along with enhanced loss of muscle quantity,27 known as sarcopenic obesity. In recent years, sarcopenic obesity, which may display a dual metabolic burden, has been confirmed to suffer from a higher probability of cardiometabolic risk factors, such as metabolic syndrome13 and non-alcoholic fatty liver disease in T2DM.28 Higher 10-yr CVD risk in T2DM patients might be affected by the synergistical effect of visceral fat accumulation along with low muscle quantity. However, whether sarcopenic obesity is associated with a greater 10-yr risks of CVD remains controversial.
In a prospective study in men aged 60–79, people with low muscle mass determined by mid-arm muscle circumference as well as obesity classified using waist circumference did not display a significantly higher risk of CVD events.16 Meanwhile, another prospective cohort study conducted in older male and female also indicated that obesity coexisted with low muscle amount (categorized using total-body muscle quantity and waist circumference) did not predict the occurrence of CVD events.17 However, a cross-sectional population-based research of 7315 Korean adults showed that the close relationship between the increased 10-yr CVD risk and the combined phenotypes of high body fat as well as low muscle mass was present in men but entirely absent in women.29 Whereas Kim et al found the high estimated 10-yr CVD risk to be 2.2-fold greater for population with a condition of obesity and declined muscle quantity when compared with those with only one of low muscle mass or obesity. In the research, decreased appendicular muscle mass and obesity were defined using weight-adjusted skeletal muscle quantity index and BMI, respectively.15 Thus, it evidently shows that these contradictory results would be explained by some subtle differences within the diagnosis categorization of obesity and low muscle mass, to some extent. Besides, the cut-off points also vary strikingly between genders. Nevertheless, taken together, the above results indicate that a combination of obesity and low muscle mass might be associated with increased CVD risk. However, investigation into the relationship between combined visceral obesity as well as decreased skeletal muscle mass and the estimated CVD risk scores has been scarce in T2DM patients.
In the current study, the independent inverse association between SVR and 10-yr CVD risk was observed in T2DM patients. SVR is a simple surrogate indicator of sarcopenic obesity, reflecting the complex combined alteration of skeletal muscle and visceral fat. SVR might represent the dual metabolic burden and the potential adverse effect on CVD and its risk factors, including obesity, hypertension, and hyperlipidemia. Besides, the general trends discussed in this study may not be disturbed by a lack of unified diagnostic standard and cut-off points for obesity and sarcopenia at present. Patients with lower SVR values were more likely to have increased 10-yr CVD incidence than in the reference group. But when the regression analysis was conducted in men and women, respectively, the negative relationship between SVR and 10-yr CVD risk was only observed in men after adjusting for confounders. Gender differences in body composition and fat deposition may be one of the important reasons for such sex-specific result. In general, males feature larger amounts of visceral fat and well-developed skeletal muscle compared with females with the same age and BMI. Instead, the accumulation of fat tissue in gluteal and femoral regions is more obvious in females.30 Thus, the combination of visceral fat area and muscle mass may better represent the changes in major body composition and their potential adverse effects in men. Furthermore, the sex hormone levels change with age in female, which may affect cardiovascular health.31 Therefore, the gender inconsistency results in the current study might be associated with the differences in sex hormones.
Though BMI and waist circumference have been widely used in practical assessment for obesity, they are not accurate measurements to quantify body composition, resulting in an inability to accurately predict cardiovascular risk. A prospective study of risk factors for CVD indicated that a certain accumulation of the abdominal adipose tissue was a stronger risk factor for the development of the metabolic diseases than BMI.32 In the present study, patients with the higher CVD risk exhibited the lower SVR levels, but there was no significant difference in BMI among different CVD risk groups. Several possible mechanisms may account for the association of SVR with CVD risk in T2DM patients. On the one hand, skeletal muscle serves as the key site of glucose processing mediated by insulin, thus decreased of muscle quantity may be related to insulin resistance.33 On the other hand, excessive visceral fat accumulation has also been recognized to be closely associated with insulin resistance.34 As a result, the low SVR may present connection to insulin resistance. As shown in our result, the lower SVR value was, the lower insulin sensitivity and the more likely severe insulin resistance appeared to be. Thus, consistent with some existing studies, insulin resistance, served as a cardiovascular risk factor, may be responsible for the underlying pathophysiology concerning the significant relationship between SVR and 10-year CVD incidence.35
Besides, previous studies have demonstrated that SVR was independent, negative associated with arterial stiffness in T2DM patients.20 Arterial stiffness, measured by brachial-ankle pulse wave velocity (baPWV), was established as an independent predictor for risk of CVD events. In the current study, we also found that those with lower SVR levels were more likely to suffer from carotid plaque. A meta-analysis including 11 population-based studies (54,336 patients) suggested that the ultrasound assessment of carotid plaque is closely related to the future CVD events.36 These results suggested the close relationship between SVR and macrovascular function in T2DM population. Low SVR levels could lead to high arterial stiffness and carotid plaque formation, which in turn increases 10-yr CVD risk.
The present research had several notable limitations. Firstly, due to the cross-sectional design, the causal relationship between SVR and 10-yr CVD risk could not be confirmed. Then, the CVD risk assessment tools used in the study may have overestimated the 10-yr risk of CVD, as indicated by a previous research.37 Thus, the occurrence of CVD events in T2DM patients should be confirmed by a long-term follow-up. Finally, the most precise way to measure visceral fat area and skeletal muscle mass is the Computer Tomography (CT) or dual energy X-ray absorptiometry (DXA). However, limitations existed on account of the harmful radiation and high cost that make them rather difficult to popularize in a relatively large-scale study. Considering of the portability and no radiation of the machine, we used BIA instead of “gold standard” CT as a tool for the measurement of body composition, and the previous studies also indicated that the proxy measures are reliable.38,39
Conclusion
In conclusions, SVR level is independently and inversely related to the estimated 10-yr CVD risk among Chinese T2DM population, indicating that SVR value could be a valuable parameter to predict a higher risk of CVD events in clinical practice, especially in men.
Data Sharing Statement
The data used and analyzed in the study are available from the corresponding author, Hong Chen.
Ethics Approval
This research has received the approval of the ethics committee of Zhujiang Hospital, Southern Medical University (approval no. 2021-KY-043-01). Informed consent was obtained from all participants. The study was carried out in accordance with the Declaration of Helsinki.
Funding
This work was supported by the National Natural Science Foundation of China [grant numbers 81770835]; Guangzhou Science and Technology Program Project [grant numbers 201803040012] and the Key-Area Research and Development Program of Guangdong, China [grant numbers 2019B020230001].
Disclosure
All authors report no conflicts of interest in this work.
References
1. Einarson TR, Acs A, Ludwig C, Panton UH. Economic burden of cardiovascular disease in type 2 diabetes: a systematic review. Value Health. 2018;21(7):881–890. doi:10.1016/j.jval.2017.12.019
2. Li FR, Yang HL, Zhou R, et al. Diabetes duration and glycaemic control as predictors of cardiovascular disease and mortality. Diabetes Obes Metab. 2021;23(6):1361–1370. doi:10.1111/dom.14348
3. Dal Canto E, Ceriello A, Rydén L, et al. Diabetes as a cardiovascular risk factor: an overview of global trends of macro and micro vascular complications. Eur J Prev Cardiol. 2019;26(2_suppl):25–32. doi:10.1177/2047487319878371
4. Laakso M, Kuusisto J. Insulin resistance and hyperglycaemia in cardiovascular disease development. Nat Rev Endocrinol. 2014;10(5):293–302. doi:10.1038/nrendo.2014.29
5. Pi-Sunyer X. Changes in body composition and metabolic disease risk. Eur J Clin Nutr. 2019;73(2):231–235. doi:10.1038/s41430-018-0320-x
6. Liu J, Fox CS, Hickson DA, et al. Impact of abdominal visceral and subcutaneous adipose tissue on cardiometabolic risk factors: the Jackson Heart Study. J Clin Endocrinol Metab. 2010;95(12):5419–5426. doi:10.1210/jc.2010-1378
7. Anderson PJ, Chan JC, Chan YL, et al. Visceral fat and cardiovascular risk factors in Chinese NIDDM patients. Diabetes Care. 1997;20(12):1854–1858. doi:10.2337/diacare.20.12.1854
8. Fan Y, He D, Liu S, Qiao Y, Gao H, Xin L. Association between visceral adipose index and risk of hypertension in a middle-aged and elderly Chinese population. Nutr Metab Cardiovasc Dis. 2021;31(8):2358–2365. doi:10.1016/j.numecd.2021.04.024
9. Tyrovolas S, Panagiotakos D, Georgousopoulou E, et al. Skeletal muscle mass in relation to 10 year cardiovascular disease incidence among middle aged and older adults: the ATTICA study. J Epidemiol Community Health. 2020;74(1):26–31. doi:10.1136/jech-2019-212268
10. Chin SO, Rhee SY, Chon S, et al. Sarcopenia is independently associated with cardiovascular disease in older Korean adults: the Korea National Health and Nutrition Examination Survey (KNHANES) from 2009. PLoS One. 2013;8(3):e60119. doi:10.1371/journal.pone.0060119
11. Xia MF, Chen LY, Wu L, et al. Sarcopenia, sarcopenic overweight/obesity and risk of cardiovascular disease and cardiac arrhythmia: a cross-sectional study. Clin Nutr. 2021;40(2):571–580. doi:10.1016/j.clnu.2020.06.003
12. Baek SJ, Nam GE, Han KD, et al. Sarcopenia and sarcopenic obesity and their association with dyslipidemia in Korean elderly men: the 2008–2010 Korea National Health and Nutrition Examination Survey. J Endocrinol Invest. 2014;37(3):247–260. doi:10.1007/s40618-013-0011-3
13. Wang Q, Zheng D, Liu J, Fang L, Li Q. Skeletal muscle mass to visceral fat area ratio is an important determinant associated with type 2 diabetes and metabolic syndrome. Diabetes Metab Syndr Obes. 2019;12:1399–1407. doi:10.2147/DMSO.S211529
14. Park SH, Park JH, Song PS, et al. Sarcopenic obesity as an independent risk factor of hypertension. J Am Soc Hypertens. 2013;7(6):420–425. doi:10.1016/j.jash.2013.06.002
15. Kim JH, Cho JJ, Park YS. Relationship between sarcopenic obesity and cardiovascular disease risk as estimated by the Framingham risk score. J Korean Med Sci. 2015;30(3):264–271. doi:10.3346/jkms.2015.30.3.264
16. Atkins JL, Whincup PH, Morris RW, Lennon LT, Papacosta O, Wannamethee SG. Sarcopenic obesity and risk of cardiovascular disease and mortality: a population-based cohort study of older men. J Am Geriatr Soc. 2014;62(2):253–260. doi:10.1111/jgs.12652
17. Stephen WC, Janssen I. Sarcopenic-obesity and cardiovascular disease risk in the elderly. J Nutr Health Aging. 2009;13(5):460–466. doi:10.1007/s12603-009-0084-z
18. Scott D, Cumming R, Naganathan V, et al. Associations of sarcopenic obesity with the metabolic syndrome and insulin resistance over five years in older men: the concord health and ageing in men project. Exp Gerontol. 2018;108:99–105. doi:10.1016/j.exger.2018.04.006
19. Batsis JA, Villareal DT. Sarcopenic obesity in older adults: aetiology, epidemiology and treatment strategies. Nat Rev Endocrinol. 2018;14(9):513–537.
20. Xu J, Pan X, Liang H, et al. Association between skeletal muscle mass to visceral fat area ratio and arterial stiffness in Chinese patients with type 2 diabetes mellitus. BMC Cardiovasc Disord. 2018;18(1):89. doi:10.1186/s12872-018-0827-z
21. Shida T, Akiyama K, Oh S, et al. Skeletal muscle mass to visceral fat area ratio is an important determinant affecting hepatic conditions of non-alcoholic fatty liver disease. J Gastroenterol. 2018;53(4):535–547. doi:10.1007/s00535-017-1377-3
22. Hwang YC, Jeon WS, Park CY, Youn BS. The ratio of skeletal muscle mass to visceral fat area is a main determinant linking circulating irisin to metabolic phenotype. Cardiovasc Diabetol. 2016;15(1):9. doi:10.1186/s12933-015-0319-8
23. Levy JC, Matthews DR, Hermans MP. Correct homeostasis model assessment (HOMA) evaluation uses the computer program. Diabetes Care. 1998;21(12):2191–2192. doi:10.2337/diacare.21.12.2191
24. Panel on detection, evaluation, and treatment of high blood cholesterol in adults E. Executive Summary of The Third Report of The National Cholesterol Education Program (NCEP) Expert Panel on Detection, Evaluation, And Treatment of High Blood Cholesterol In Adults (Adult Treatment Panel III). JAMA. 2001;285(19):2486–2497. doi:10.1001/jama.285.19.2486
25. Yang X, Li J, Hu D, et al. Predicting the 10-year risks of atherosclerotic cardiovascular disease in Chinese population: the China-PAR Project (Prediction for ASCVD Risk in China). Circulation. 2016;134(19):1430–1440. doi:10.1161/CIRCULATIONAHA.116.022367
26. Santos A, Rodrigues APS, Rosa LPS, Sarrafzadegan N, Silveira EA. Cardiometabolic risk factors and Framingham risk score in severely obese patients: baseline data from DieTBra trial. Nutr Metab Cardiovasc Dis. 2020;30(3):474–482. doi:10.1016/j.numecd.2019.10.010
27. Volpato S, Bianchi L, Lauretani F, et al. Role of muscle mass and muscle quality in the association between diabetes and gait speed. Diabetes Care. 2012;35(8):1672–1679. doi:10.2337/dc11-2202
28. Su X, Xu J, Zheng C. The relationship between non-alcoholic fatty liver and skeletal muscle mass to visceral fat area ratio in women with type 2 diabetes. BMC Endocr Disord. 2019;19(1):76. doi:10.1186/s12902-019-0404-1
29. Lee K. Muscle mass and body fat in relation to cardiovascular risk estimation and lipid-lowering eligibility. J Clin Densitom. 2017;20(2):247–255. doi:10.1016/j.jocd.2016.07.009
30. Power ML, Schulkin J. Sex differences in fat storage, fat metabolism, and the health risks from obesity: possible evolutionary origins. Br J Nutr. 2008;99(5):931–940. doi:10.1017/S0007114507853347
31. Zhao D, Guallar E, Ouyang P, et al. Endogenous sex hormones and incident cardiovascular disease in post-menopausal women. J Am Coll Cardiol. 2018;71(22):2555–2566. doi:10.1016/j.jacc.2018.01.083
32. Ohlson LO, Larsson B, Svärdsudd K, et al. The influence of body fat distribution on the incidence of diabetes mellitus. 13.5 years of follow-up of the participants in the study of men born in 1913. Diabetes. 1985;34(10):1055–1058. doi:10.2337/diab.34.10.1055
33. de Matos MA, Ottone Vde O, Duarte TC, et al. Exercise reduces cellular stress related to skeletal muscle insulin resistance. Cell Stress Chaperones. 2014;19(2):263–270. doi:10.1007/s12192-013-0453-8
34. Medina-Urrutia A, Posadas-Romero C, Posadas-Sánchez R, et al. Role of adiponectin and free fatty acids on the association between abdominal visceral fat and insulin resistance. Cardiovasc Diabetol. 2015;14:20.
35. Adeva-Andany MM, Martínez-Rodríguez J, González-Lucán M, Fernández-Fernández C, Castro-Quintela E. Insulin resistance is a cardiovascular risk factor in humans. Diabetes Metab Syndr. 2019;13(2):1449–1455. doi:10.1016/j.dsx.2019.02.023
36. Inaba Y, Chen JA, Bergmann SR. Carotid plaque, compared with carotid intima-media thickness, more accurately predicts coronary artery disease events: a meta-analysis. Atherosclerosis. 2012;220(1):128–133. doi:10.1016/j.atherosclerosis.2011.06.044
37. Jee SH, Jang Y, Oh DJ, et al. A coronary heart disease prediction model: the Korean Heart Study. BMJ Open. 2014;4(5):e005025. doi:10.1136/bmjopen-2014-005025
38. Fang WH, Yang JR, Lin CY, et al. Accuracy augmentation of body composition measurement by bioelectrical impedance analyzer in elderly population. Medicine. 2020;99(7):e19103. doi:10.1097/MD.0000000000019103
39. Omura-Ohata Y, Son C, Makino H, et al. Efficacy of visceral fat estimation by dual bioelectrical impedance analysis in detecting cardiovascular risk factors in patients with type 2 diabetes. Cardiovasc Diabetol. 2019;18(1):137. doi:10.1186/s12933-019-0941-y
 © 2021 The Author(s). This work is published and licensed by Dove Medical Press Limited. The
full terms of this license are available at https://www.dovepress.com/terms
and incorporate the Creative Commons Attribution
- Non Commercial (unported, 3.0) License.
By accessing the work you hereby accept the Terms. Non-commercial uses of the work are permitted
without any further permission from Dove Medical Press Limited, provided the work is properly
attributed. For permission for commercial use of this work, please see paragraphs 4.2 and 5 of our Terms.
© 2021 The Author(s). This work is published and licensed by Dove Medical Press Limited. The
full terms of this license are available at https://www.dovepress.com/terms
and incorporate the Creative Commons Attribution
- Non Commercial (unported, 3.0) License.
By accessing the work you hereby accept the Terms. Non-commercial uses of the work are permitted
without any further permission from Dove Medical Press Limited, provided the work is properly
attributed. For permission for commercial use of this work, please see paragraphs 4.2 and 5 of our Terms.