Back to Journals » Diabetes, Metabolic Syndrome and Obesity » Volume 12
Relationship Between Skeletal Muscle Mass Indexes and Muscular Function, Metabolic Profile and Bone Mineral Density in Women with Recommendation for Bariatric Surgery
Authors Crispim Carvalho NN, Baccin Martins VJ ![]() , Modesto Filho J
, Modesto Filho J ![]() , Bandeira F, Fernandes Pimenta FC, de Brito Alves JL
, Bandeira F, Fernandes Pimenta FC, de Brito Alves JL
Received 27 April 2019
Accepted for publication 20 July 2019
Published 12 December 2019 Volume 2019:12 Pages 2645—2654
DOI https://doi.org/10.2147/DMSO.S213643
Checked for plagiarism Yes
Review by Single anonymous peer review
Peer reviewer comments 3
Editor who approved publication: Dr Konstantinos Tziomalos
Nara Nóbrega Crispim Carvalho,1,2 Vinícius José Baccin Martins,3 João Modesto Filho,2 Francisco Bandeira,4 Flávia Cristina Fernandes Pimenta,5 José Luiz de Brito Alves1
1Department of Nutrition, Health Sciences Center, Federal University of Paraiba, Joao Pessoa, Brazil; 2Department of Endocrinology, Lauro Wanderley University Hospital, Federal University of Paraiba, Joao Pessoa, Brazil; 3Department of Physiology and Pathology, Federal University of Paraiba, Joao Pessoa, Brazil; 4Division of Diabetes and Endocrinology of Agamenon Magalhães Hospital, Recife, Brazil; 5Lauro Wanderley University Hospital, Federal University of Paraiba, Joao Pessoa, Brazil
Correspondence: José Luiz de Brito Alves
Department of Nutrition, Federal University of Paraiba, Campus I – Jd. Cidade Universitária, João Pessoa, PB 58051-900, Brazil
Tel/Fax +55 81 9 9845 5485
Email [email protected]
Nara Nóbrega Crispim Carvalho
Department of Endocrinology, Lauro Wanderley University Hospital, Federal University of Paraiba, João Pessoa, PB 58051-900, Brazil
Tel/Fax +55 83 9 9368 0937
Email [email protected]
Background and aim: We evaluated low skeletal muscle mass (LMM) in women prior to bariatric surgery (BS) through different skeletal muscle mass indexes (MMIs) regarding body fat percentage (BFP), handgrip strength (HS), six-minute walk test (6MWT), metabolic profile and bone mineral density (BMD).
Methods: Women (n=62) were allocated into two groups according to LMM: obesity with low muscle mass (OLMM) or obesity with normal muscle mass (ONMM). LMM was defined by the appendicular skeletal muscle mass (ASM) adjusted for weight (ASM/wt × 100) and ASM adjusted for body mass index (ASM/BMI), considering the lowest quintile of the indexes studied.
Results: OLMM was found in 30.5% by ASM/wt × 100 and 20.3% by ASM/BMI. Using the ASM/wt × 100, OLMM group had a high BFP, low HS and BMD in L1-L4, femoral neck (FN) and total femur (TF) when compared with ONMM (p < 0.05). Using ASM/BMI, OLMM group had increased BFP, reduced HS and 6MWT in comparison to ONMM (p < 0.05). Metabolic profile was similar between OLMM and ONMM groups by the two MMIs. MMIs were negatively correlated with BFP (p < 0.05) and positively correlated with HS (p < 0.05), and none of them with 6MWT (p > 0.05). ASM/wt × 100 was positively correlated with all BMD sites assessed (p < 0.05). There was positive correlation between ASM/wt × 100 and ASM/BMI.
Conclusion: OLMM identified by the ASM/wt × 100 and ASM/BMI had higher adiposity and lower HS. Using ASM/BMI, we found that OLMN had a poor physical performance, while the ASM/wt × 100 identified a lower BMD at all sites.
Keywords: low muscle mass, obesity, muscle function, bone mass
Introduction
The prevalence of class II and III obesity has increased worldwide,1 as well as its metabolic and cardiovascular complications.1 Clinical treatment of these patients is complex, with bariatric surgery (BS) being an effective treatment option for weight loss, improvement of comorbidities and reduction of mortality.2,3
Currently, there is a concern with the stratification of these patients regarding cardiovascular risk before BS, due to the increase of morbidity and mortality.4 Indeed, obesity generates a low-grade systemic inflammatory state, predisposing to other chronic conditions, such as musculoskeletal impairments.5 The coexistence of low skeletal muscle mass (LMM) and high adiposity has been linked with metabolic complications, disability, fall, osteoporosis, fracture and mortality.6,7
Previous studies have shown that obese individuals could lose SMM,8 bone mass,9 and maintain a high body fat percentage (BFP) throughout the follow-up after BS.10 Thus, the identification of LMM in young subjects with the recommendation for BS may be useful to target therapeutic strategies that could help to reduce the complications associated with obesity and BS. Different muscle mass indexes (MMIs) have been used for evaluation of LMM, such as appendicular skeletal muscle mass (ASM) adjusted to weight (wt), BMI or height (ht).
The evaluation of LMM in adults with class II and III obesity is scarce, as well as there are few reports in the literature about the comparison between the MMIs with respect to the clinical outcomes in this subpopulation.18 Thus, the objective of the study was: 1) Identify LMM in women with recommendation for BS through two MMIs (ASM/wt × 100 and ASM/BMI); 2) Compare obesity with low muscle mass (OLMM) group to obesity with normal muscle mass (ONMM) group regarding age, blood pressure, anthropometric measurements, body composition, handgrip strength (HS), six-minute walk test (6MWT), metabolic profile and bone mineral density (BMD) for each MMI studied; and 3) Verify any correlation between the two MMIs and the studied variables.
Methods
Ethical Aspects
This cross-sectional study was conducted in accordance with the Declaration of Helsinki. The protocol of original study entitled “Cardiovascular, metabolic and muscular evaluation in sarcopenic and non-sarcopenic obese patients recommended for bariatric surgery” was submitted and approved by the Research Ethics Committee of Lauro Wanderley University Hospital, Federal University of Paraiba (Reference number 80984817.9.0000.5183) and all procedures were conducted in agreement with the Resolution 466/2012 of the national and international health councils. After the patients gave written informed consent they underwent screening procedures.
Subjects
Seventy-one individuals were assessed; however, we excluded nine men from the sample because of the small number of participants. Obese women aged 18–60 years, BMI ≥ 40 kg/m2 or ≥ 35 kg/m2 with comorbidities, already referred to BS service of Lauro Wanderley University Hospital, between March and September 2018, were included in the study. Women were categorized into two groups according to the presence of OLMM and ONMM for each MMI.
Exclusion criteria consisted of compatible history with pregnancy or lactating, cardiac transplantation, presence of arrhythmias (e.g.: ventricular atrial block, atrial fibrillation) cardiac pacemakers, clinical history of ischemic and non-ischemic cardiomyopathy, important psychiatric diseases, active malignant neoplasms. Additionally, patients who had osteoarticular or neurological diseases that might have led to physical impairment (strength deficit or physical performance), the use of controlled medications that might have led to side effects that compromise physical performance and patients with impaired pulmonary, hepatic and renal function were excluded in this study.
Clinical Evaluation, Anthropometric and Blood Pressure Measurements
A questionnaire was administered to participants in order to retrieve information regarding their age, socio-demographic data, medical history (menopause history, previous diseases; including history of atraumatic bone fracture, time of illness and use of medication), lifestyle (nutritional counseling, levels of physical activity and smoking). Duration of type 2 diabetes mellitus and arterial hypertension was recorded based on the date of diagnosis self-reported by patient.
Body weight was measured to the nearest 0.1 kg (Inbody 370). Ht was measured to the nearest 0.5 cm using a stadiometer (anthropometric balance Caumaq mechanical capacity 300 kg) and BMI (kg/m2) was calculated as the wt divided by the h2 (wt/h2).
Blood pressure was measured through the Welch Allyn sphygmomanometer with appropriate arm circumference cuff following the recommendations of the 2013 ESH/ESC Guidelines for the management of arterial hypertension.11
Assessment of Body Composition
Body composition was evaluated by bioimpedance (Inbody 370, Model JMW140, Chungcheongnam-do, KOREA), eight-point tactile electrodes, multifrequency (5 kHz, 50 kHz, 250 kHz). To perform the test, it was recommended to fast for 12 hrs, empty the bladder before the test, not to perform extenuating or vigorous physical exercises the day before and not being in the menstrual period. SMM (kg) and fat mass (kg) of all body segments (arms, legs and trunk), as well as BFP (%) were provided from the manufacturer’s algorithm incorporating age, sex, wt and ht.12,13 The ASM (kg) was calculated by summing the SMM of both arms and legs.
Obesity with Low Muscle Mass Definition
OLMM was characterized by the combination of obesity (defined by BMI) and LMM (defined by a low MMI). For evaluation of LMM, we used two definitions: 1) ASM (sum of SMM of arms and legs) adjusted for wt: ASM/wt × 100 (%) and 2) ASM adjusted for BMI: ASM/BMI (m2). We established that obese women in the lowest quintile for each MMI were OLMM group, whereas those in the remaining quintiles were allocated in the ONMM group, similarly to other studies when cut-off points were not established in that subpopulation.12,14,15
Muscle Function (Handgrip Strength and Physical Function) Assessment
HS was assessed by Jamar hand dynamometer (Sammons Preston Inc., IL, USA). We performed a mean of three attempts in each hand, starting the examination by the dominant hand with a pause between the 30-s measures, and using the verbal stimulus so that the patient reached maximum strength.
In addition, physical function by the 6MWT was assessed according to previous studies.16
Blood Sample and Biochemical Analyses
Blood samples were collected with 12 hrs fasting, without alcoholic beverage intake 72 hrs before. Fasting glucose, cholesterol, triglycerides and high-density lipoprotein cholesterol (HDL-c) concentrations were determined with an automated enzymatic method (Autoanalyzer; Technicon, Tarrytown, NY, USA). The low-density lipoprotein cholesterol (LDL-c) was calculated using the Friedwald formula.17 Fasting insulin was determined with the chemiluminescence immunoassay technique using (Siemens Healthcare Diagnostics) following the manufacturers’ recommendations. Insulin resistance was estimated with the homeostasis model assessment of insulin resistance (HOMA) method. Glycated hemoglobin (HbA1c) was measured by high-performance liquid chromatography (method certified by the National Glycohemoglobin Standardization Program). Lastly, high sensitivity quantitative C-reactive protein (C-RP) was measured by turbidimetry.
Bone Mineral Density
BMD (g/cm2), T-score and Z-score in the lumbar spine (L1-L4), femoral neck (FN) and total femur (TF) were evaluated by dual-energy X-ray absorptiometry with densitometer properly calibrated (model Lunar 8743, Medical Systems Lunar, Madison, USA) and by a single-experienced evaluator. This densitometer only allows the evaluation of patients weighing up to 120 kg.
The criteria of the European guidance for the diagnosis and management of osteoporosis in postmenopausal women for the diagnosis of osteopenia and osteoporosis in postmenopausal women were adopted.18 Premenopausal women with Z-score < 2 were considered to have low bone mass.
Statistical Analysis
Normality of the data was tested by Shapiro–Wilk. Data are reported as mean ± standard deviation. Triglycerides, insulin, C-RP, HbA1c and HOMA were log-transformed to normalize the data and presented as geometric means and confidence interval. The comparison between groups (OLMM and ONMM for each MMI) was performed using Student’s t-test and variance homogeneity tests between the groups compared through the Levine test. Pearson’s correlation coefficient was used to examine the relationship between the MMIs and age, anthropometric, blood pressure, body composition, muscle function, laboratory parameters and BMD.
Attained correlations were classified as poor (r ≤ 0.20), weak (0.21–0.40), moderate (0.41–0.60), good (0.61–0.80), and excellent (0.81–1.00),19,20 p values < 0.05 were considered significant.19,20 Multiple regression was applied to identify the most important factor that was related to ASM/wt × 100 and ASM/BMI. Two models were used in multiple regression; model 1 (age, BMD and HOMA-IR) and model 2 (model 1 plus HS). The analyses were performed using the SPSS package version 20 (IBM Corp., Armonk, NY).
Results
Subjects Characteristics
We evaluated 62 obese women aged 24–57 years (mean age 39.53 ± 8.99 years), mean wt 108.60 ± 13.86 kg and mean BMI 42.6 ± 4.64 kg/m2. Of the participants, 50% of them were married, 40.32% completed university, 50.3% were hypertensive (mean duration of 12 years), 24.19% had type 2 diabetes mellitus (mean duration of 5.81 years), 38.7% were dyslipidemic, 20% were in menopause, 8% had osteopenia, 40% practiced physical activity (≥ 150 mins/week), 66% underwent nutritional monitoring for more than 1 year. Eight participants did not assess BMD because they weighed more than 120 kg and three did not evaluated body composition. Anthropometric characteristics, muscular function, body composition and laboratory parameters are shown in Table 1.
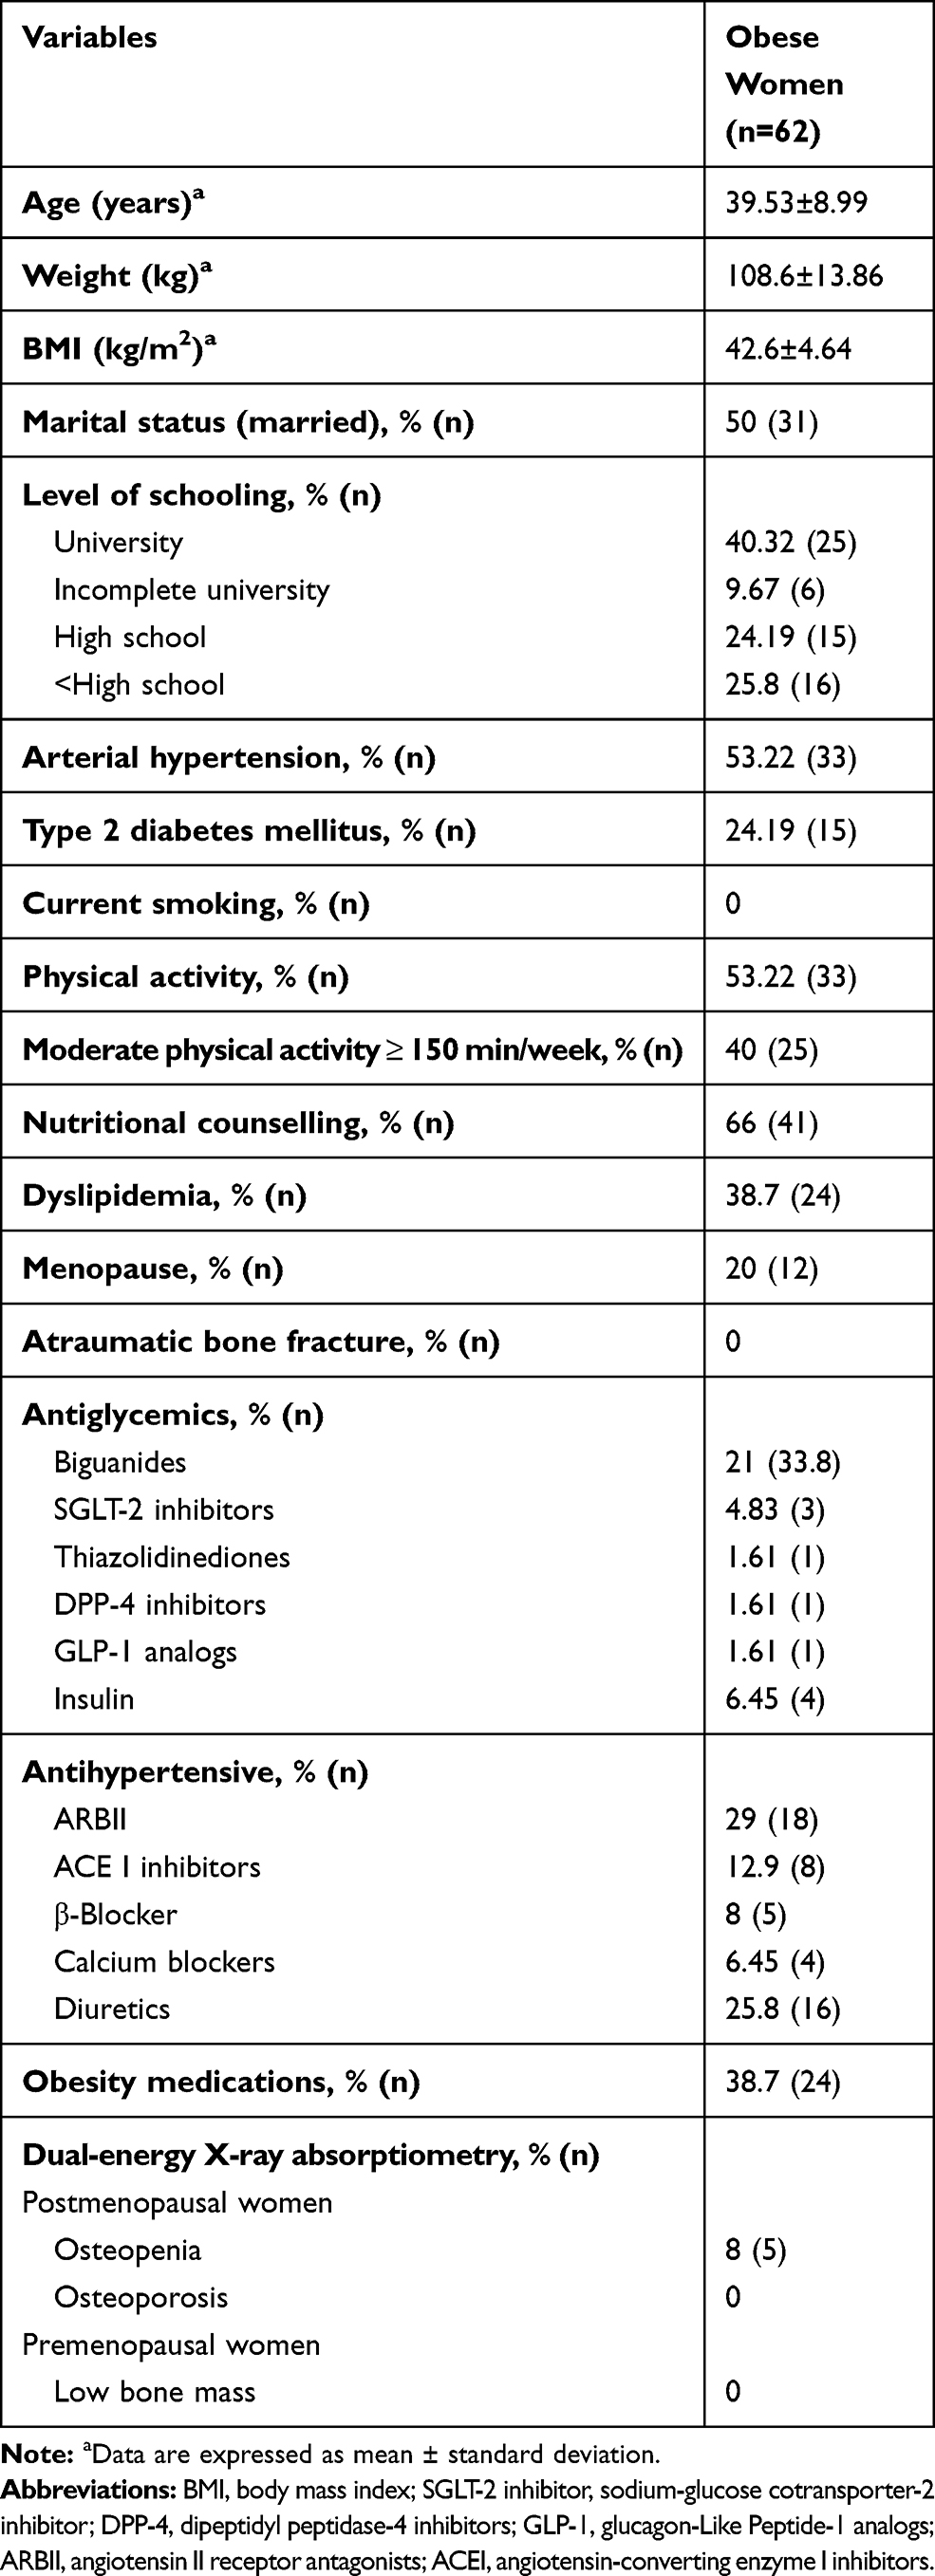 |
Table 1 Clinical Characteristics of the Obese Women Studied |
Obesity with Low Muscle Mass Definition
OLMM was identified in 30.5% (n=18) by ASM/wt × 100 and 20.3% (n=12) by ASM/BMI. The cut-off points for each quintile of the MMIs derived from wt and BMI are shown in Table 2.
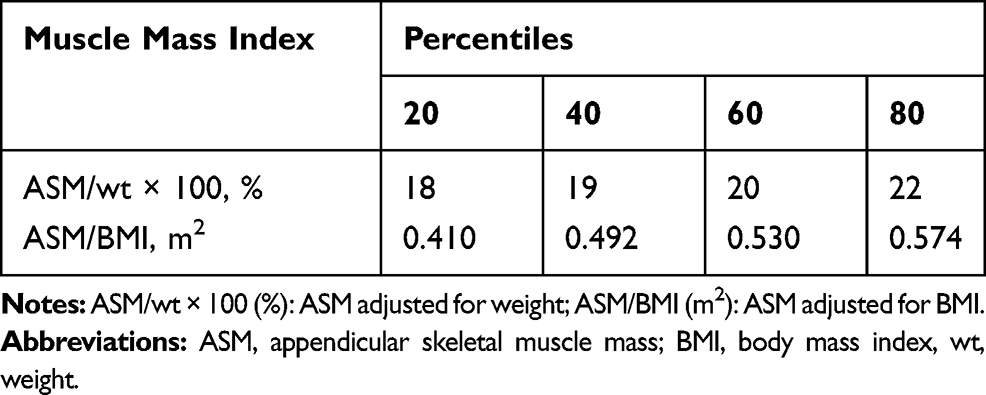 |
Table 2 Percentiles of Appendicular Muscle Mass Indexes by Weight (ASM/Wt × 100) and BMI (ASM/BMI) Adjustment |
Comparison Between OLMM and ONMM Groups as the Variables Studied According to ASM/Wt × 100 and ASM/BMI
Age was similar between the OLMM and ONMM groups, independent of the MMI used. Women in the lowest quintile for the ASM/wt × 100, presented a higher BFP and lower ht and HS than ONMM group (Table 3). There was no significant difference for 6MWT between the studied groups (Table 3). In relation to ASM/BMI, OLMM group exhibited higher BMI and BFP, while ht, HS and 6MWT were lower than the ONMM group (Table 3). Metabolic profile was not worse in OLMM compared to ONMM by the two MMIs evaluated (Table 3).
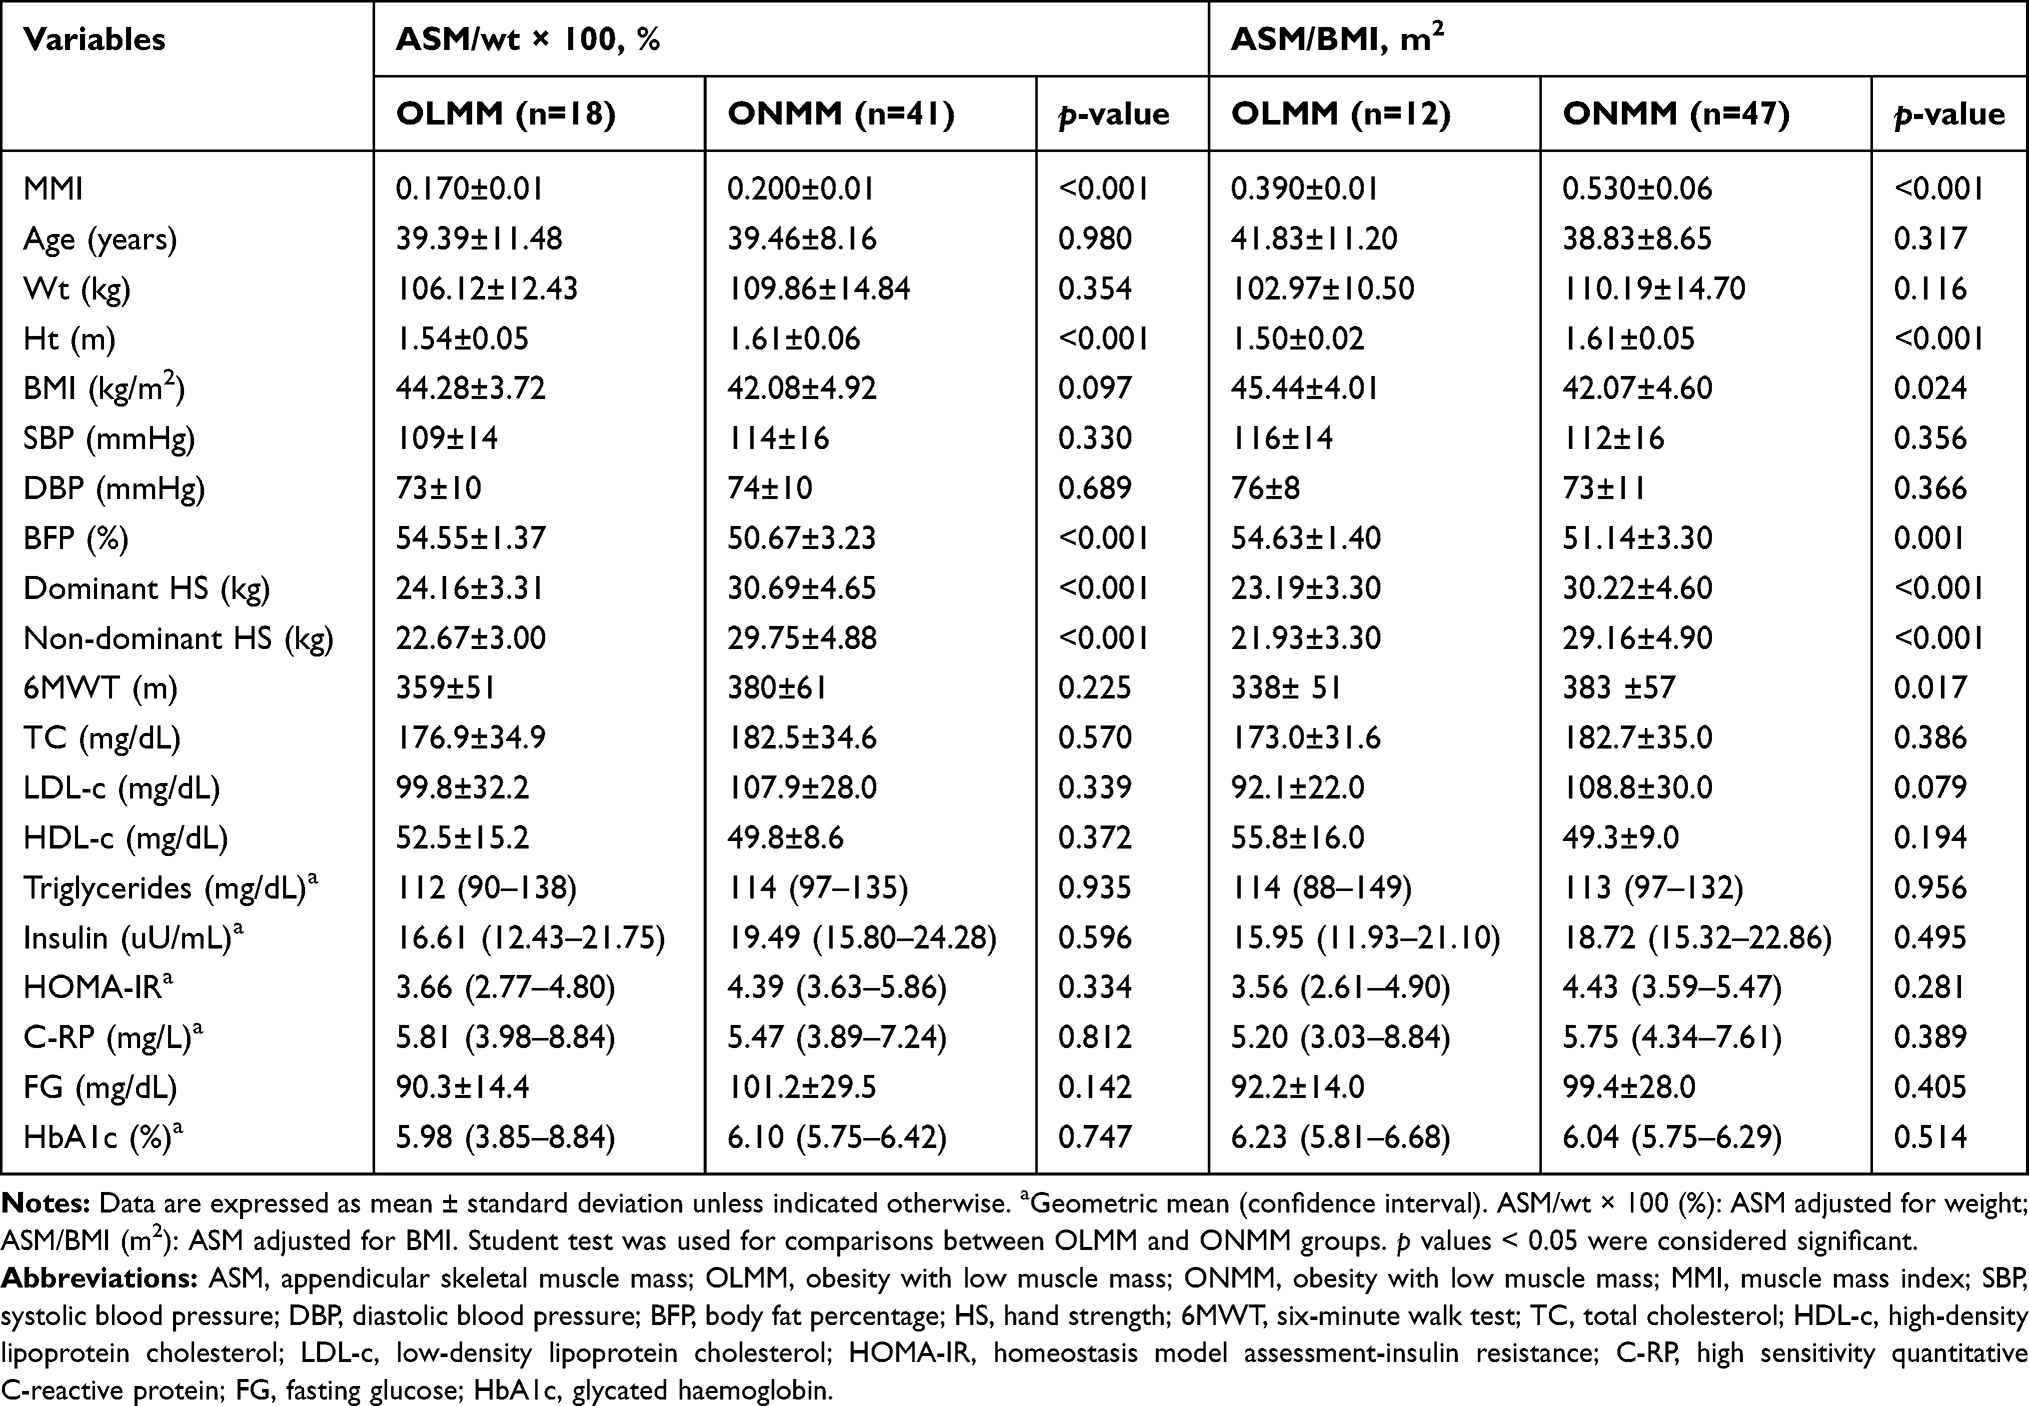 |
Table 3 Comparison Between Obesity with Low Muscle Mass and obesity with Normal Muscle Mass Groups Regarding Clinical, Anthropometric, Muscle Function Variables and Metabolic Profile for Each MMI Evaluated |
Differences in BMD between OLMM and ONMM groups according to each MMI are shown in Table 4. OLMM group by ASM/wt × 100 presented lower BMD at all evaluated sites (L1-L4, FN and TF), while OLMM and ONMM groups by ASM/BMI exhibited similar BMD (Table 4).
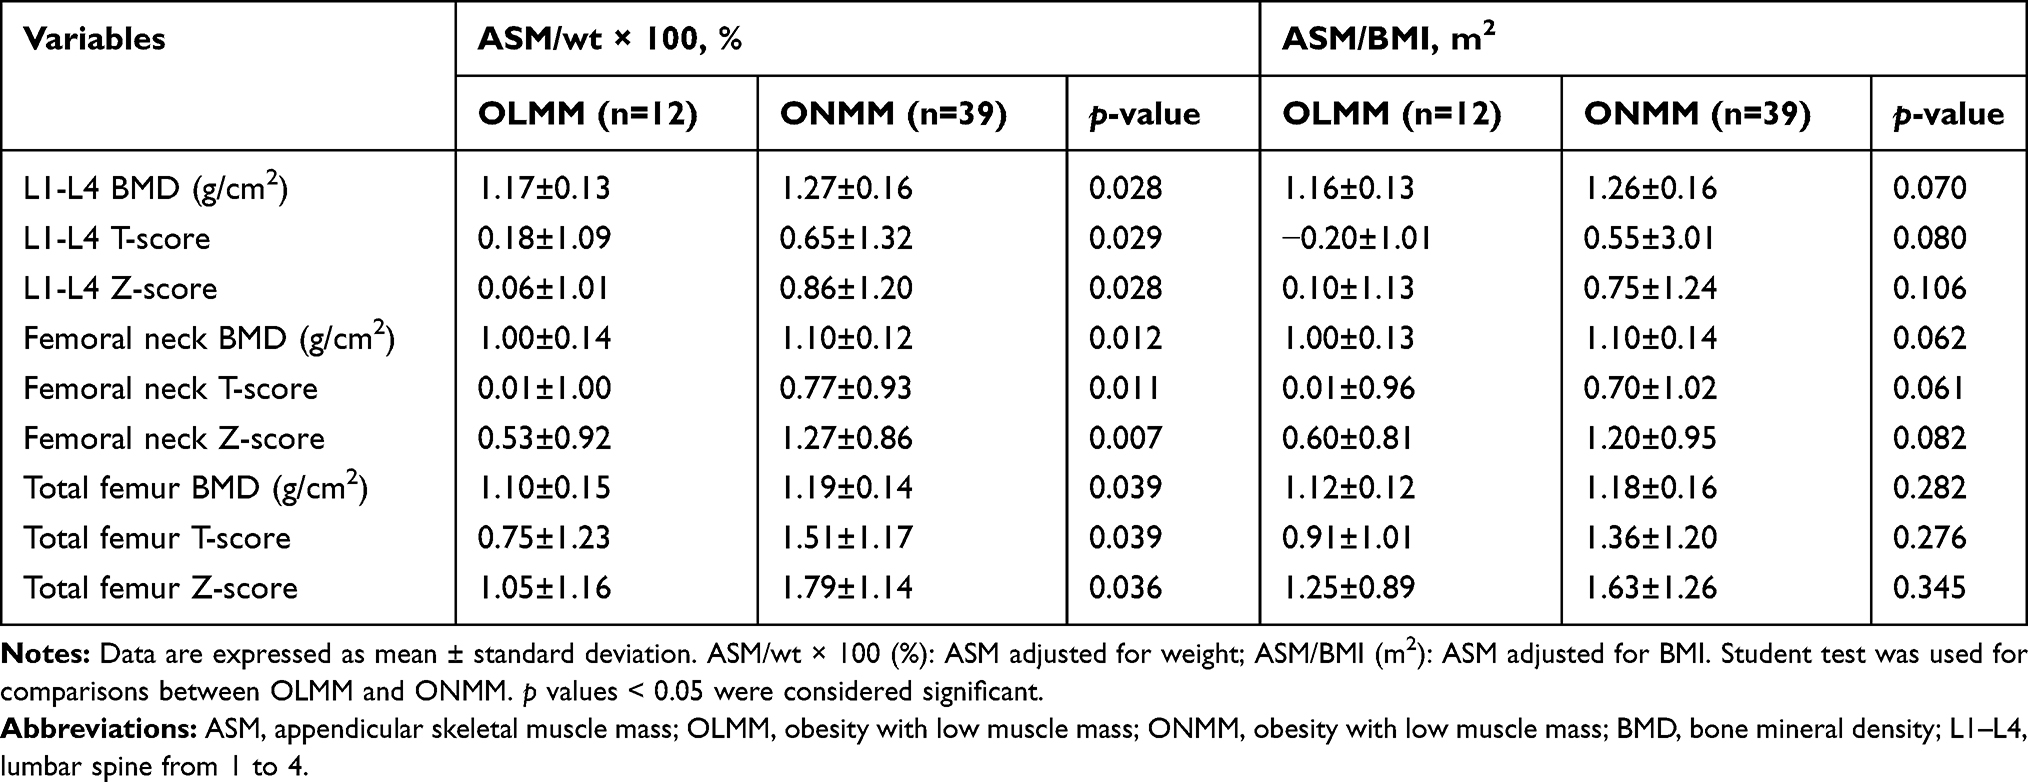 |
Table 4 Comparison Between Obesity with Low Muscle Mass and Obesity with Normal Muscle Mass Groups Regarding Bone Mineral Density for Each Muscle Mass Index Evaluated |
Associations of ASM/Wt × 100 and ASM/BMI with Variables Studied
None of the MMIs were associated with age. In relation to anthropometric measures, all MMIs; ASM/wt × 100 and ASM/BMI were positively associated with ht. ASM/wt × 100 and ASM/BMI had negative and significant association with BMI (Table 5).
 |
Table 5 Correlation Between Skeletal Muscle Mass Indexes (Adjusted for Body Mass Index and Weight) and Age, Anthropometric, Muscular Function, Body Composition and Laboratory Parameters |
Regarding body composition, ASM/wt × 100 and ASM/BMI were negatively associated with BFP. As expected, all MMIs was positively correlated with statistical significance with SMM of arms, legs and trunk. In addition, ASM/wt × 100 obtained negative and significant association with fat mass of upper limbs (Table 5).
ASM/wt × 100 and ASM/BMI were positively and significantly associated with HS, while none of them had any association with 6MWT and laboratory parameters (Table 5). With respect to BMD, its correlations with MMIs are shown in Table 5. Only the ASM/wt × 100 correlated positively and significantly with all sites (L1-L4, FN and TF) of BMD evaluated (Table 5). When correlating the MMIs between them, there was significant correlation between ASM/wt × 100 and ASM/BMI (Table 5).
Multiple regression analyses showed that HS is the most important variable to predict ASM/wt × 100 (Beta = 0.562, p < 0.05) and ASM/BMI (Beta = 0.562, p< 0.05) (Table 6). The total variability of the ASM/wt × 100 and ASM/BMI with HS regression model was 47% (Adjusted R2 = 0.473, p < 0.001) and 42% (Adjusted R2 = 0.427, p < 0.001), respectively.
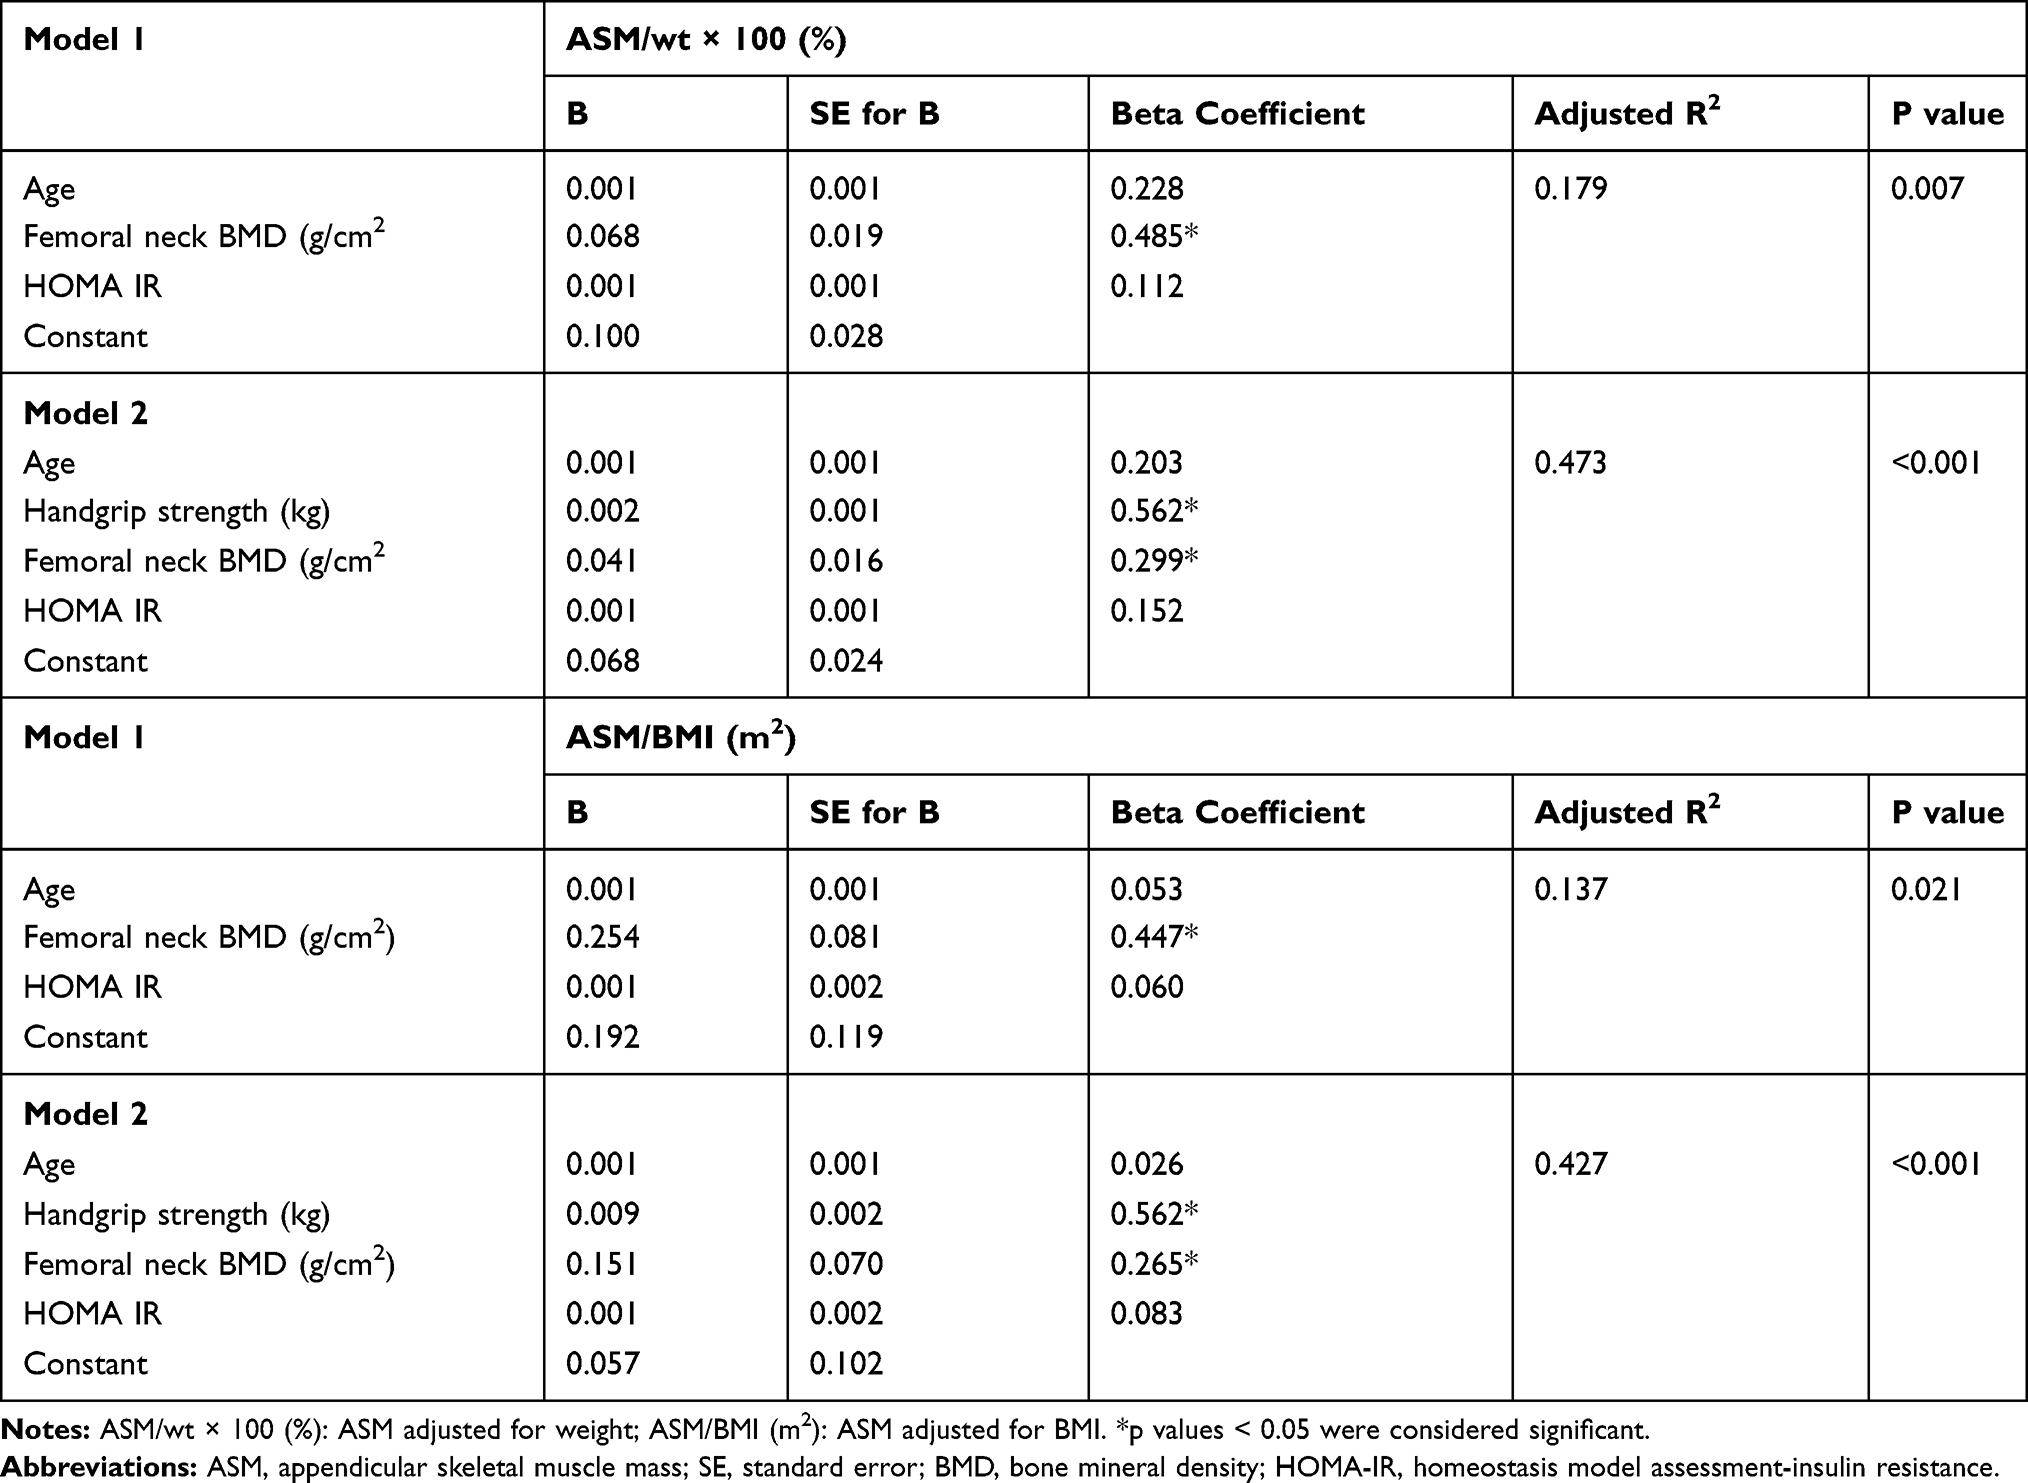 |
Table 6 Analysis of Multiple Regression Predicting Skeletal Muscle Mass Indexes |
Discussion
Our study evaluated LMM, one of the parameters involved in the diagnosis of sarcopenia, in obese women with BS recommendation through two MMIs (ASM/wt × 100 and ASM/BMI). We used the lowest quintile of each studied MMI to diagnose LMM because we did not have well-established cut-off points in this subgroup.12,14,15,21 In this way, OLMM was found in 30.5% by ASM/wt × 100 and 20.3% by ASM/BMI.
There is a paucity of literature on the prevalence of sarcopenic in adults with class II/III obesity and the comparison between them is difficult due to the heterogeneity of methods of estimation of SMM, definition of sarcopenia to be used, ethnicities, peculiarities of each studied population and cut-off points used.
Several definitions of sarcopenia were evaluated in obese individuals with class II/III obesity. The prevalence of sarcopenia was higher when diagnosed through the following MMIs: ASM/wt × 100, ASM/BMI and ASM adjusted for fat mass, ranging from 12.6% to 84.5% for women.30 Our mean values and cut-off points using the lowest quintile for the MMIs derived from ASM/wt × 100 and ASM/BMI were: 19.76%/0.505 m2 and 18%/0.410 m2, respectively.
There are few reports comparing the clinical implication of sarcopenia through the ASM/wt x100 and ASM/BMI in the elderly21,22 and studies are even more scarce in obese individuals. In adults obese subjects, difficulties with activities of daily living were negatively associated with ASM/wt × 100 in relation to ASM/BMI and ASM adjusted for both, ht and fat mass.18
Definitions of sarcopenia based on a health outcome of interest are important and have been increasingly used. One of the advantages of our study was the characterization of OLMM in women with an indication for BS, seeking a clinical profile with a greater risk of complications before and after this surgery.
Some studies have shown that patients with OLMM are older, have a higher BMI, higher BFP.23,24 In our analysis, patients presented similar ages in the OLMM and ONMM groups. BMI was higher in the OLMM group by ASM/BMI, while BMI was negatively correlated with ASM/wt × 100, as well as for ASM/BMI, similarly to another study.25 In addition, the ASM/wt × 100 and ASM/BMI had a negative influence on body mass and were adequate for evaluating LMM in obese individuals.
It is known that body fat has better predictive validity on the development of the metabolic syndrome and cardiovascular disease risk than BMI.35,36 Our patients were defined as obese by BMI, however, they also had high adiposity by BFP.26 OLMM group by ASM/wt × 100 and ASM/BMI had higher BFP and this correlated negatively with these two indexes.
Low muscle function in obese people is called dynapenic obesity. It is associated with several negative clinical outcomes.6,27–29 Low HS is a clinical marker of poor mobility and a better predictor of clinical outcomes than low muscle mass.30 In our study, HS was lower in the OLMM group by the two MMIs. All MMIs were associated with HS and in the multiple regression analysis, the HS was the most important variable to predict ASM/wt × 100 and ASM/BMI. 6MWT was lower only in the OLMM group by ASM/BMI, and none MMI correlated with 6MWT. Thus, ASM/BMI seems to be the best index in the evaluation of low muscle function, besides being able to evaluate the severity of sarcopenia, due to identifying individuals with low physical performance.
Obesity is a risk factor for several metabolic and cardiovascular complications, and when associated with LMM, clinical outcomes are worse, increasing the risk of metabolic syndrome,13 insulin resistance and diabetes,31,32 difficulties in daily living activities and mortality.30,41 Conversely, we have demonstrated that metabolic profile was not so bad in OLMM than in the ONMM group by the two indexes studied. This result is similar to other studies evaluating obese young.31,32 However, we must consider that the participants involved in the study were already in multidisciplinary follow-up, using medication and with good control of comorbidities for BS. In addition, our patients were young and the control group had also severe obesity.
Currently, the relationship between obesity, muscle mass and bone mass has been studied.33 Obesity plays a double role, promoting the increase of bone mass and muscle mass through mechanical loading, and at the same time, excessive adiposity generates a pro-inflammatory state, favoring the accumulation of fat in bones and muscles and thus suppressing osteoblastogenesis and myogenesis. In our analysis, BFP was negatively correlated with BMD of all evaluated segments (data not shown) as in the study by Liu et al.34 On the other hand, C-RP did not differ between OLMM and ONMM groups, and also did not correlate with MMIs. We did not evaluate other inflammatory markers such as tumor necrosis factor-alpha, interleukins, leptin and adiponectin that would be important in this pathogenesis.
BMD was lower in all sites evaluated (L1-L4, FN and TF) by ASM/wt × 100. The ASM/wt × 100 was positively correlated with BMD of FN, TF and lumbar spine. This assessment is of great importance since patients submitted to BS lose muscle mass mainly in the first year after surgery,35 as well as loss of bone mass during follow-up.8 Furthermore, considering that obesity,36 weight loss37 and high BFP34 are risk factors for bone impairment and risk of fractures, obese patient and especially those obese after BS are involved in this context.
Actually, there is no formal recommendation to evaluate bone mass prior to BS in premenopausal women.26 However, identifying a profile of patients with a greater tendency to BMD loss is necessary.
Potential Limitations
This study is from a particular population and generalizability or transportability might not apply. We evaluated a subpopulation of obese women with a recommendation for BS, so we did not have a large sample, besides the limitation to gender. In addition, we did not evaluate traumatic bone fracture by imaging method nor biochemical markers of bone metabolism. The fact that we included women at menopause should be considered, but only 8% of them had osteopenia.
Conclusion
The frequency of low skeletal muscle mass in women with the recommendation for bariatric surgery was greater when using ASM/wt × 100 than ASM/BMI. In addition, women with low muscle mass by ASM/wt × 100 and ASM/BMI had higher adiposity and lower handgrip strength than women with normal muscle mass. ASM/BMI was the only one to identify a poor physical performance, while the ASM/wt × 100 identified a lower bone mineral density at all sites.
Abbreviations
ASM, appendicular skeletal muscle mass; ASM/BMI (m2), ASM adjusted for body mass index; ASM/wt × 100 (%), ASM adjusted for weight; BFP, body fat percentage; BMD, bone mineral density; BMI, body mass index; BS, bariatric surgery; C-RP, high sensitivity quantitative C-reactive protein; DBP, diastolic blood pressure; FN, femoral neck; HS, handgrip strength; HbA1c, glycated hemoglobin; HDL-c, high-density lipoprotein cholesterol; HOMA, homeostasis model assessment-insulin resistance; ht, height; LDL-c, low-density lipoprotein cholesterol; LMM, low skeletal muscle mass; MMI, skeletal muscle mass index; MMIs, skeletal muscle mass indexes; 6MWT, six-minute walk test; SBP, systolic blood pressure; SMM, skeletal muscle mass; OLMM, obesity with low skeletal muscle mass; ONMM, obesity with normal skeletal muscle mass; TF, total femur; wt, weight.
Author Contributions
All authors contributed to data analysis, drafting or revising the article, gave final approval of the version to be published, and agree to be accountable for all aspects of the work.
Disclosure
The authors report no conflicts of interest in this work.
References
1. Bhupathiraju SN, Hu FB. Epidemiology of obesity and diabetes and their cardiovascular complications. Circ Res. 2016;118(11):1723–1735. doi:10.1161/CIRCRESAHA.115.306825
2. Anderson JW, Konz EC, Frederich RC, Wood CL. Long-term weight-loss maintenance: a meta-analysis of US studies. Am J Clin Nutr. 2001;74(5):579–584. doi:10.1093/ajcn/74.5.579
3. Sjostrom L. Bariatric surgery and reduction in morbidity and mortality: experiences from the SOS study. Int J Obes (Lond). 2008;32(Suppl 7):S93–97. doi:10.1038/ijo.2008.244
4. Fried M, Yumuk V, Oppert JM, et al. Interdisciplinary European guidelines on metabolic and bariatric surgery. Obes Surg. 2014;24(1):42–55. doi:10.1007/s11695-013-1079-8
5. Collins KH, Herzog W, MacDonald GZ, et al. Obesity, metabolic syndrome, and musculoskeletal disease: common inflammatory pathways suggest a central role for loss of muscle integrity. Front Physiol. 2018;9:112. doi:10.3389/fphys.2018.00112
6. Scott D, Chandrasekara SD, Laslett LL, Cicuttini F, Ebeling PR, Jones G. Associations of sarcopenic obesity and dynapenic obesity with bone mineral density and incident fractures over 5-10 years in community-dwelling older adults. Calcif Tissue Int. 2016;99(1):30–42. doi:10.1007/s00223-016-0123-9
7. Batsis JA, Mackenzie TA, Barre LK, Lopez-Jimenez F, Bartels SJ. Sarcopenia, sarcopenic obesity and mortality in older adults: results from the National Health and Nutrition Examination Survey III. Eur J Clin Nutr. 2014;68(9):1001–1007. doi:10.1038/ejcn.2014.117
8. Davidson LE, Yu W, Goodpaster BH, et al. Fat-free mass and skeletal muscle mass five years after bariatric surgery. Obesity (Silver Spring). 2018;26(7):1130–1136. doi:10.1002/oby.v26.7
9. Menegati GC, de Oliveira LC, Santos AL, et al. Nutritional status, body composition, and bone health in women after bariatric surgery at a university hospital in Rio de Janeiro. Obes Surg. 2016;26(7):1517–1524. doi:10.1007/s11695-015-1910-5
10. Gomez-Ambrosi J, Andrada P, Valenti V, et al. Dissociation of body mass index, excess weight loss and body fat percentage trajectories after 3 years of gastric bypass: relationship with metabolic outcomes. Int J Obes (Lond). 2017;41(9):1379–1387. doi:10.1038/ijo.2017.134
11. Mancia G, Fagard R, Narkiewicz K, et al. 2013 ESH/ESC practice guidelines for the management of arterial hypertension. Blood Press. 2014;23(1):3–16. doi:10.3109/08037051.2014.868629
12. Jang IY, Jung HW, Lee CK, Yu SS, Lee YS, Lee E. Comparisons of predictive values of sarcopenia with different muscle mass indices in Korean rural older adults: a longitudinal analysis of the Aging Study of PyeongChang Rural Area. Clin Interv Aging. 2018;13:91–99. doi:10.2147/CIA.S155619
13. Sartorio A, Malavolti M, Agosti F, et al. Body water distribution in severe obesity and its assessment from eight-polar bioelectrical impedance analysis. Eur J Clin Nutr. 2005;59(2):155–160. doi:10.1038/sj.ejcn.1602049
14. Newman AB, Kupelian V, Visser M, et al. Sarcopenia: alternative definitions and associations with lower extremity function. J Am Geriatr Soc. 2003;51(11):1602–1609. doi:10.1046/j.1532-5415.2003.51534.x
15. Chen LK, Lee WJ, Peng LN, Liu LK, Arai H, Akishita M. Recent advances in sarcopenia research in Asia: 2016 update from the Asian working group for sarcopenia. J Am Med Dir Assoc. 2016;17(8):767 e761–767. doi:10.1016/j.jamda.2016.05.016
16. Beriault K, Carpentier AC, Gagnon C, et al. Reproducibility of the 6-minute walk test in obese adults. Int J Sports Med. 2009;30(10):725–727. doi:10.1055/s-0029-1231043
17. Friedewald WT, Levy RI, Fredrickson DS. Estimation of the concentration of low-density lipoprotein cholesterol in plasma, without use of the preparative ultracentrifuge. Clin Chem. 1972;18(6):499–502.
18. Kanis JA, Cooper C, Rizzoli R, Reginster JY. European guidance for the diagnosis and management of osteoporosis in postmenopausal women. Osteoporosis Int. 2019;30(1):3–44.
19. Lin LI. A concordance correlation coefficient to evaluate reproducibility. Biometrics. 1989;45(1):255–268. doi:10.2307/2532051
20. Bland JM, Altman DG. Measuring agreement in method comparison studies. Stat Methods Med Res. 1999;8(2):135–160. doi:10.1177/096228029900800204
21. Johnson Stoklossa CA, Sharma AM, Forhan M, Siervo M, Padwal RS, Prado CM. Prevalence of sarcopenic obesity in adults with class II/III obesity using different diagnostic criteria. J Nutr Metab. 2017;2017:7307618. doi:10.1155/2017/7307618
22. Papageorgiou M, Sathyapalan T, Schutte R. Muscle mass measures and incident osteoporosis in a large cohort of postmenopausal women. J Cachexia Sarcopenia Muscle. 2019;10(1):131–139. doi:10.1002/jcsm.v10.1
23. Kreidieh D, Itani L, El Masri D, Tannir H, Citarella R, El Ghoch M. Association between sarcopenic obesity, Type 2 diabetes, and hypertension in overweight and obese treatment-seeking adult women. J Cardiovasc Dev Dis. 2018;5(4). doi:10.3390/jcdd5040051
24. Srikanthan P, Hevener AL, Karlamangla AS. Sarcopenia exacerbates obesity-associated insulin resistance and dysglycemia: findings from the National Health and Nutrition Examination Survey III. PLoS One. 2010;5(5):e10805. doi:10.1371/journal.pone.0010805
25. Nascimento DDC, Oliveira SDC, Vieira DCL, et al. The impact of sarcopenic obesity on inflammation, lean body mass, and muscle strength in elderly women. Int J Gen Med. 2018;11:443–449. doi:10.2147/IJGM.S187285
26. Mechanick JI, Youdim A, Jones DB, et al. Clinical practice guidelines for the perioperative nutritional, metabolic, and nonsurgical support of the bariatric surgery patient–2013 update: cosponsored by American Association of Clinical Endocrinologists, The Obesity Society, and American Society for Metabolic & Bariatric Surgery. Obesity (Silver Spring). 2013;21(Suppl 1):S1–S27. doi:10.1002/oby.20461
27. Rossi AP, Bianchi L, Volpato S, et al. Dynapenic abdominal obesity as a predictor of worsening disability, hospitalization, and mortality in older adults: results from the InCHIANTI study. J Gerontol. 2017;72(8):1098–1104. doi:10.1093/gerona/glw203
28. Maximo RO, Santos JLF, Perracini MR, Oliveira C, Duarte YAO, Alexandre TDS. Abdominal obesity, dynapenia and dynapenic-abdominal obesity as factors associated with falls. Br j Phys Ther. 2018;23:497–505.
29. Cruz-Jentoft AJ, Bahat G, Bauer J, et al. Sarcopenia: revised European consensus on definition and diagnosis. Age Ageing. 2019;48:601. doi:10.1093/ageing/afz046
30. Lauretani F, Russo CR, Bandinelli S, et al. Age-associated changes in skeletal muscles and their effect on mobility: an operational diagnosis of sarcopenia. J Appl Physiol. 2003;95(5):1851–1860.
31. Moon SS. Low skeletal muscle mass is associated with insulin resistance, diabetes, and metabolic syndrome in the Korean population: the Korea National Health and Nutrition Examination Survey (KNHANES) 2009-2010. Endocr J. 2014;61(1):61–70. doi:10.1507/endocrj.EJ13-0244
32. Johnson Stoklossa CA, Ghosh SS, Forhan M, et al. Poor physical function as a marker of sarcopenia in adults with class II/III obesity. Curr Dev Nutr. 2018;2(3):nzx008.
33. Szlejf C, Parra-Rodriguez L, Rosas-Carrasco O. Osteosarcopenic obesity: prevalence and relation with frailty and physical performance in middle-aged and older women. J Am Med Dir Assoc. 2017;18(8):733 e731–733 e735. doi:10.1016/j.jamda.2017.02.023
34. Liu PY, Ilich JZ, Brummel-Smith K, Ghosh S. New insight into fat, muscle and bone relationship in women: determining the threshold at which body fat assumes negative relationship with bone mineral density. Int J Prev Med. 2014;5(11):1452–1463.
35. Maimoun L, Lefebvre P, Jaussent A, Fouillade C, Mariano-Goulart D, Nocca D. Body composition changes in the first month after sleeve gastrectomy based on gender and anatomic site. Surg Obesity Relat Dis. 2017;13(5):780–787. doi:10.1016/j.soard.2017.01.017
36. Tang X, Liu G, Kang J, et al. Obesity and risk of hip fracture in adults: a meta-analysis of prospective cohort studies. PLoS One. 2013;8(4):e55077. doi:10.1371/journal.pone.0055077
37. Johnson KC, Bray GA, Cheskin LJ, et al. The effect of intentional weight loss on fracture risk in persons with diabetes: results from the look AHEAD randomized clinical trial. J Bone Miner Res. 2017;32(11):2278–2287. doi:10.1002/jbmr.3214
 © 2019 The Author(s). This work is published and licensed by Dove Medical Press Limited. The
full terms of this license are available at https://www.dovepress.com/terms
and incorporate the Creative Commons Attribution
- Non Commercial (unported, 3.0) License.
By accessing the work you hereby accept the Terms. Non-commercial uses of the work are permitted
without any further permission from Dove Medical Press Limited, provided the work is properly
attributed. For permission for commercial use of this work, please see paragraphs 4.2 and 5 of our Terms.
© 2019 The Author(s). This work is published and licensed by Dove Medical Press Limited. The
full terms of this license are available at https://www.dovepress.com/terms
and incorporate the Creative Commons Attribution
- Non Commercial (unported, 3.0) License.
By accessing the work you hereby accept the Terms. Non-commercial uses of the work are permitted
without any further permission from Dove Medical Press Limited, provided the work is properly
attributed. For permission for commercial use of this work, please see paragraphs 4.2 and 5 of our Terms.