Back to Journals » Diabetes, Metabolic Syndrome and Obesity » Volume 14
Relationship Between Sclerostin (SOST) Expression and Genetic Loci rs851056, rs1230399 Polymorphisms and Bone Mineral Density in Postmenopausal Women with Type 2 Diabetes in Xinjiang
Authors Li J, Ren Y, Li S, Li J
Received 12 February 2021
Accepted for publication 1 October 2021
Published 4 November 2021 Volume 2021:14 Pages 4443—4450
DOI https://doi.org/10.2147/DMSO.S305831
Checked for plagiarism Yes
Review by Single anonymous peer review
Peer reviewer comments 2
Editor who approved publication: Professor Ming-Hui Zou
Jun Li,1,* YanXia Ren,1,* SiYuan Li,2 JiaJia Li3
1Endocrinology and Metabolism Department, First Affiliated Hosptital, School of Medicine, Shihezi University, Shihezi, Xinjiang Uygur Autonomous Region, People’s Republic of China; 2Shihezi University School of Medicine, Shihezi, Xinjiang Uygur Autonomous Region, People’s Republic of China; 3Endocrinology and Metabolism Department, Second People’s Hospital of Nanyang, Nanyang, Henan Province, People’s Republic of China
*These authors contributed equally to this work
Correspondence: Jun Li Email [email protected]
Background: The Wnt signaling pathway plays a valuable role in bone metabolism. SOST is a major inhibitor of the Wnt signaling pathway. The expression of SOST and genetic polymorphism might be associated with bone mineral density in postmenopausal women with type 2 diabetes mellitus (T2DM).
Objective: This study aims to explore whether SOST protein expression and genetic locus rs851056, rs1230399 polymorphism is associated with bone mineral density in postmenopausal women with T2DM in Xinjiang.
Methods: A total of 136 Xinjiang postmenopausal women were divided into four groups: A (-/-), B (±), C (-/+), and D (+/+) by assessing their OGTT and bone mass. Genetic polymorphisms were determined using the mass ARRAY mass spectrometer.
Results: 1) Genotypes and allele frequencies at rs851056 were statistically significant differences in groups B and D patients compared to group A, respectively. 2) Individuals carrying the GG genotype had lower HDL, Ca, and ALP as compared to those carrying the GC/CC genotypes in group C. In contrast, individuals carrying the GG genotype had higher BMD (L1-4) as compared to those carrying the GC/CC genotypes in group D. 3) SOST protein expression levels were higher in groups C and D than in group A. 4). BMD (L1-4) was negatively correlated with SOST protein. 5) Multiple linear regression analysis for BMD-dependent variables showed that the decrease of BMI and TG were risk factors for BMD (L1-4), besides, the decrease of BMI, ALP, and extended years of menopause were all risk factors for BMD (femoral neck).
Conclusion: SOST protein expression and genetic locus rs851056, rs1230399 polymorphism are associated with bone mineral density in postmenopausal women with type 2 diabetes mellitus in Xinjiang.
Keywords: SOST gene polymorphism, gene mutation, type 2 diabetes mellitus, osteoporosis, bone mineral density, SOST protein
Introduction
Type 2 diabetes mellitus (T2DM) is a chronic systemic metabolic disease. The characteristic of osteoporosis (OP) is loss of bone mineral mass, leading to an increased risk of bone fractures and a decreased bone mineral density.1,2 The prevalence of OP in patients with T2DM can range from 30% to 60%. In addition, the incidence of OP in aging postmenopausal women is even three times higher than that in men of the same age.3–5 The Wnt signaling pathway plays a valuable role in bone metabolism and other metabolic diseases.4 SOST is a major inhibitor of the Wnt signaling pathway. A study aiming to explore the relationship between serum SOST and the risk of T2DM shows there is a weak positive correlation between SOST and fasting glucose.3 In addition, Starup et al have found that there is an association between SOST and fracture risk in diabetic patients, suggesting that SOST might play a significant role in the regulation of glucose and bone metabolism,6 but the role that SOST plays in this is less clear and requires subsequent in-depth study. Sclerostin is usually found with inactivating mutations in the sclerostin SOST gene with high bone mass, but there is a difference between various loci of polymorphisms in a single nucleotide. There have been studies on the relationship between rs851056 locus polymorphism and OP in Mexican-Mestizo postmenopausal women.7 However, there were few reports on the relationship between SOST protein expression, rs851056, rs1230399 sites polymorphisms and bone mineral density in postmenopausal women with T2DM. The purpose of this study is to explore the relationship between SOST levels, rs851056, rs1230399 polymorphisms and bone mineral density in postmenopausal women with T2DM in Xinjiang.
Materials and Methods
Participants
We recruited 136 postmenopausal women from The First Affiliated Hospital of Shihezi University. Based on the inclusion and exclusion criteria, they were divided into the normal glucose tolerance group (NGT group) and the type 2 diabetes group (T2DM group) according to their OGTT results. Then, based on their BMD results, the above two groups were further divided into four groups: group A (NGT+ Normal bone mass); group B (T2DM+ Normal bone mass); group C (NGT+OP); and group D (T2DM +OP). In the following description, these groups are represented by A (-/-), B (±), C (-/+), and D (+/+) (- represents NGT or normal bone mass; + represents T2DM or OP). Inclusion criteria: conscious and healthy postmenopausal women. The diagnostic criteria for T2DM and OP refer to guidelines established by WHO in 1999 and 1994, respectively: (1) Patients with FPG≧7.0mmol/L or those who suffer from diabetic symptoms with random blood glucose≧11.1 mmol/L; or patients with OGTT2-hour blood glucose≧11.1 mmol/L. (2) T value≤-2.5SD for OP, −2.5SD<T value<-1.0SD represents reduced bone mass; if T value≧-1.0SD, the bone mass is normal. Exclusion criteria: patients with unnatural menopause caused by other factors; patients with other types of diabetes mellitus; patients with a history of using drugs that can affect bone metabolisms such as sex hormones and glucocorticoids; patients with a history of other bone diseases such as hyperparathyroidism and rheumatoid arthritis; patients with severe diseases or malignant tumors in heart, liver, and kidney; patients with idiopathic osteoporosis; no recent history of fracture. The ethics committee of The First Affiliated Hospital of Shihezi University approved the research, and all patients signed the consent form. This study was conducted in accordance with the Declaration of Helsinki.
Methods
Clinical Data
We collected basic information on 136 subjects: age of patients, year of menopause, height, weight, waist circumference, hip circumference, waist-to-hip ratio (WHR), and body mass index (BMI). The indexes of their glucose, lipid and bone metabolism were determined by the automatic biochemical instruments: (FPG), glycated hemoglobin (HbA1c), high-density lipoprotein cholesterol (HDL-C), low-density lipoprotein cholesterol (LDL-C), triglyceride (TG), blood calcium (Ca), blood phosphorus (P) and alkaline phosphatase (ALP).
Measurement of Bone Mineral Density
We used dual-energy X-ray (DEXA) to measure bone mineral density levels in the lumbar spine (L1-4) and femoral neck.
Extraction of Genomic DNA
2 mL of venous blood was drawn from the subject in the morning under fasting conditions, anticoagulated and then DNA was extracted using the DNA Extraction Kit.
Genomic Sequencing
After the PCR amplification reaction, the gene polymorphism at the SOST gene loci of rs851065 and rs1230399 was determined by Mass ARRAY mass spectrometer.
SOST Protein Assay
Enzyme-linked immunosorbent assay (ELISA) was used to determine the expression levels of SOST protein in serum.
Statistical Methods
We analyzed the data using SPSS 22.0 software. All data were tested for normality by the K-S method. Data for continuous variables were expressed as the mean±standard and dichotomous variables were expressed as frequencies or composition ratios. The independent-sample-t-test was used to compare the general data and biochemical indicators in two groups. ANOVA was used to compare means between multiple groups (analysis of covariance was required if the baseline data were not inconsistent). The genotype distribution was tested for Hardy-Weinberg equilibrium coincidence. The comparative analyses of genotype and allele frequency at each locus were conducted using the chi-square test. Spearman correlation test was used to measure correlations between SOST and BMD. Multiple stepwise linear regression was performed to identify the factors influencing BMD. P-value<0.05 indicates the difference is statistically significant.
Results
Comparison of Baseline Indicators Among the Four Groups
When group C (-/+) and D (+/+), respectively, compared with control group A (-/-), the differences in the age and year of menopause among patients were statistically significant (p < 0.05); the analysis of covariance was used to analyze each biochemical index so as to exclude the above influencing factors (Table 1).
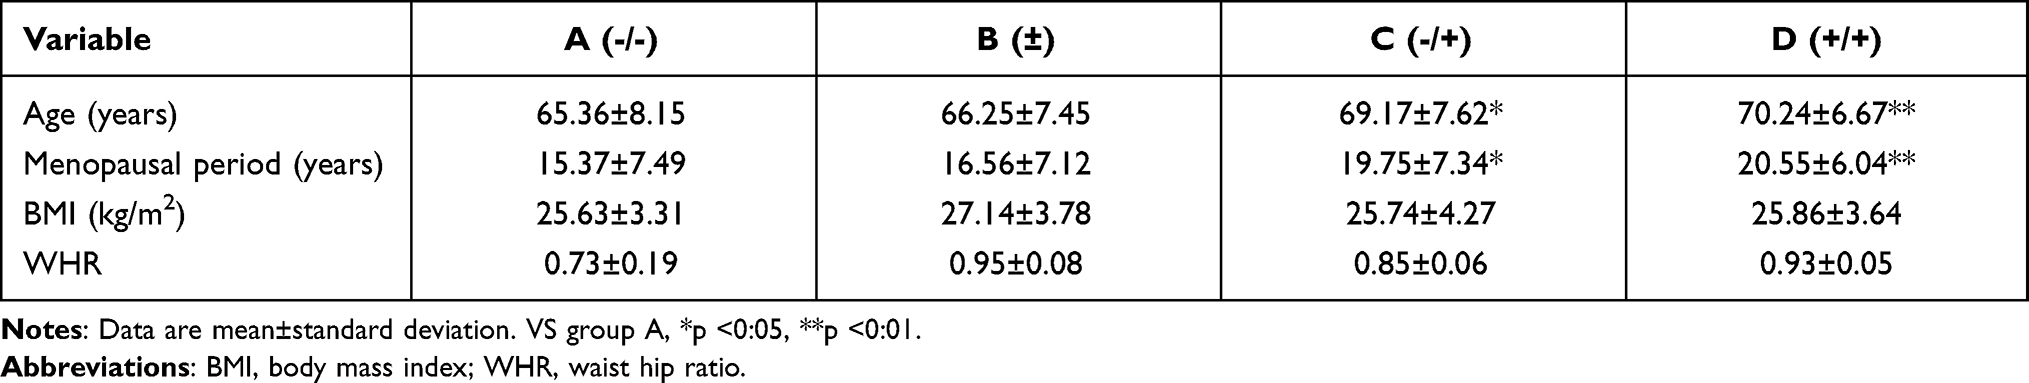 |
Table 1 Comparison of Baseline Indexes Among Four Groups ( |

A (-/-):A (NGT+ Normal bone mass); B (±):B (T2DM+ Normal bone mass); C (-/+):C (NGT+OP); D (+/+): D (T2DM +OP); (- for NGT or normal bone mass; + for T2DM or OP)
Comparison of Biochemical Indexes Among Four Groups
The results of covariance analysis showed: both FPG and HbA1c% increased in group B (±) and group D (+/+) when compared with those in the control group A (-/-) and the differences were statistically significant (p<0.01); TG, BMD (femoral neck) and BMD (L1-4) decreased in group C (-/+) and group D (+/+) when compared with those in the control group A (-/-) and the differences were statistically significant (p<0.01) (Table 2).
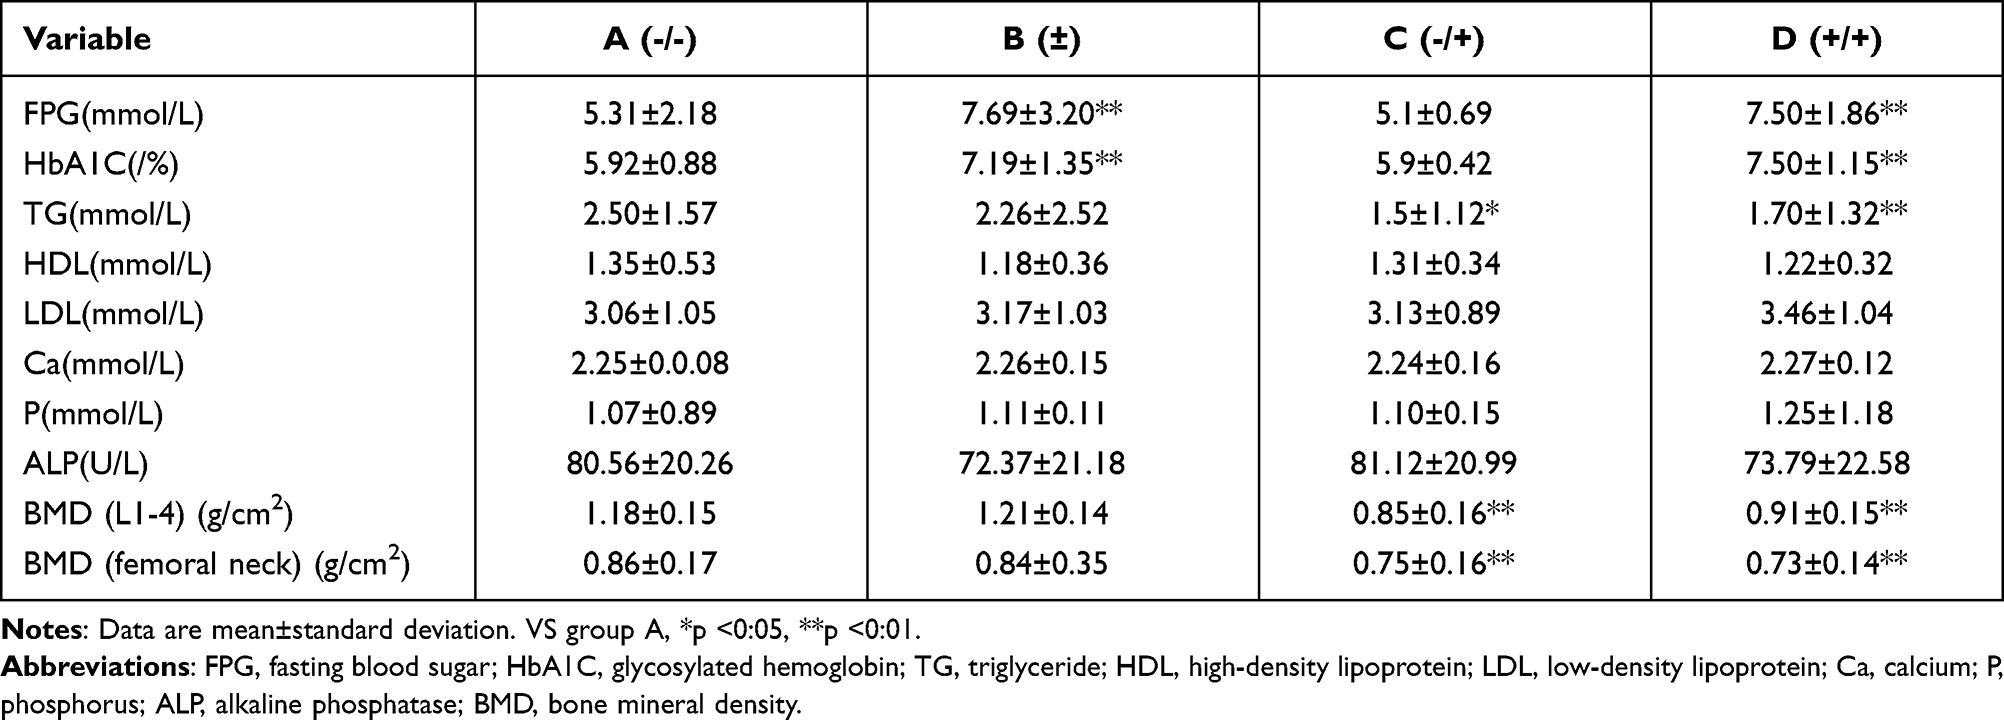 |
Table 2 Comparison of Biochemical Indices Among Patients Groups After the Analysis of Covariance ( |

A (-/-):A (NGT+ Normal bone mass); B (±):B (T2DM+ Normal bone mass); C (-/+):C (NGT+OP); D (+/+): D (T2DM +OP); (- for NGT or normal bone mass; + for T2DM or OP).
Genotype and Allele Distribution Frequency of SOST Gene
The test shows that the genotype frequencies of both loci follow Hardy-Weinberg equilibrium (p > 0.05). No statistically significant differences were found at the rs1230399 locus in the SOST gene (p>0.05). We analyzed the genotype and allele frequency of four groups of rs851056 locus, the genotypes were CC, CG, and GG, with frequencies of 9.9% (13 cases), 51.5% (68 cases), and 38.6% (51 cases), respectively, and allele frequencies of 35.6% for C and 64.4% for G, respectively. Compared with group A (-/-), the differences in genotype and allele frequencies of rs851056 in the SOST gene were statistically significant in group B (±) and group D (+/+) (p<0.01) (Table 3).
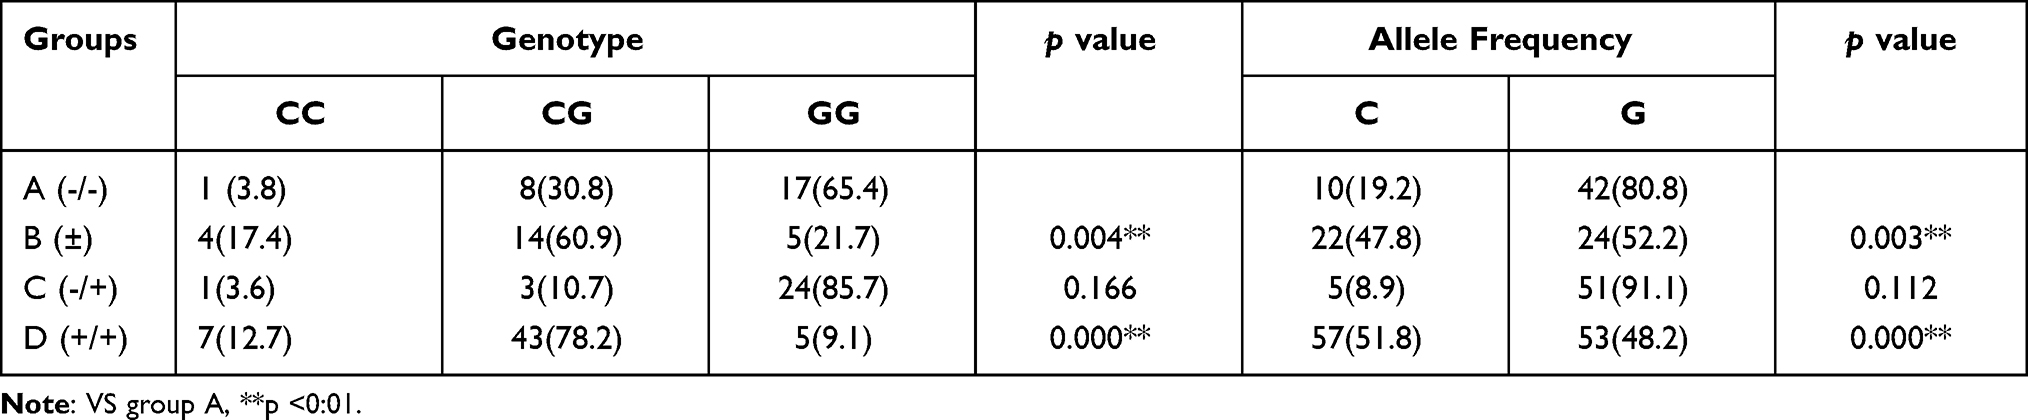 |
Table 3 Genotype and Allele Distribution Frequencies of the SOST Gene Rs851056 Locus [n(%)] |
A (-/-):A (NGT+ Normal bone mass); B (±):B (T2DM+ Normal bone mass); C (-/+):C (NGT+OP); D (+/+): D (T2DM +OP); (- for NGT or normal bone mass; + for T2DM or OP).
Comparison of Biochemical Indexes and BMD Among Different Genotypes at the SOST Gene rs851056 Loci in Each Group
In group C (-/+), HDL, Ca, and ALP of GG type were lower than those of GC/CC type, and the differences were statistically significant (p < 0.05). In group D (+/+), BMD (L1-4) of GG type was higher than those of GC/CC type, and the differences were statistically significant (p < 0.05) (Table 4).
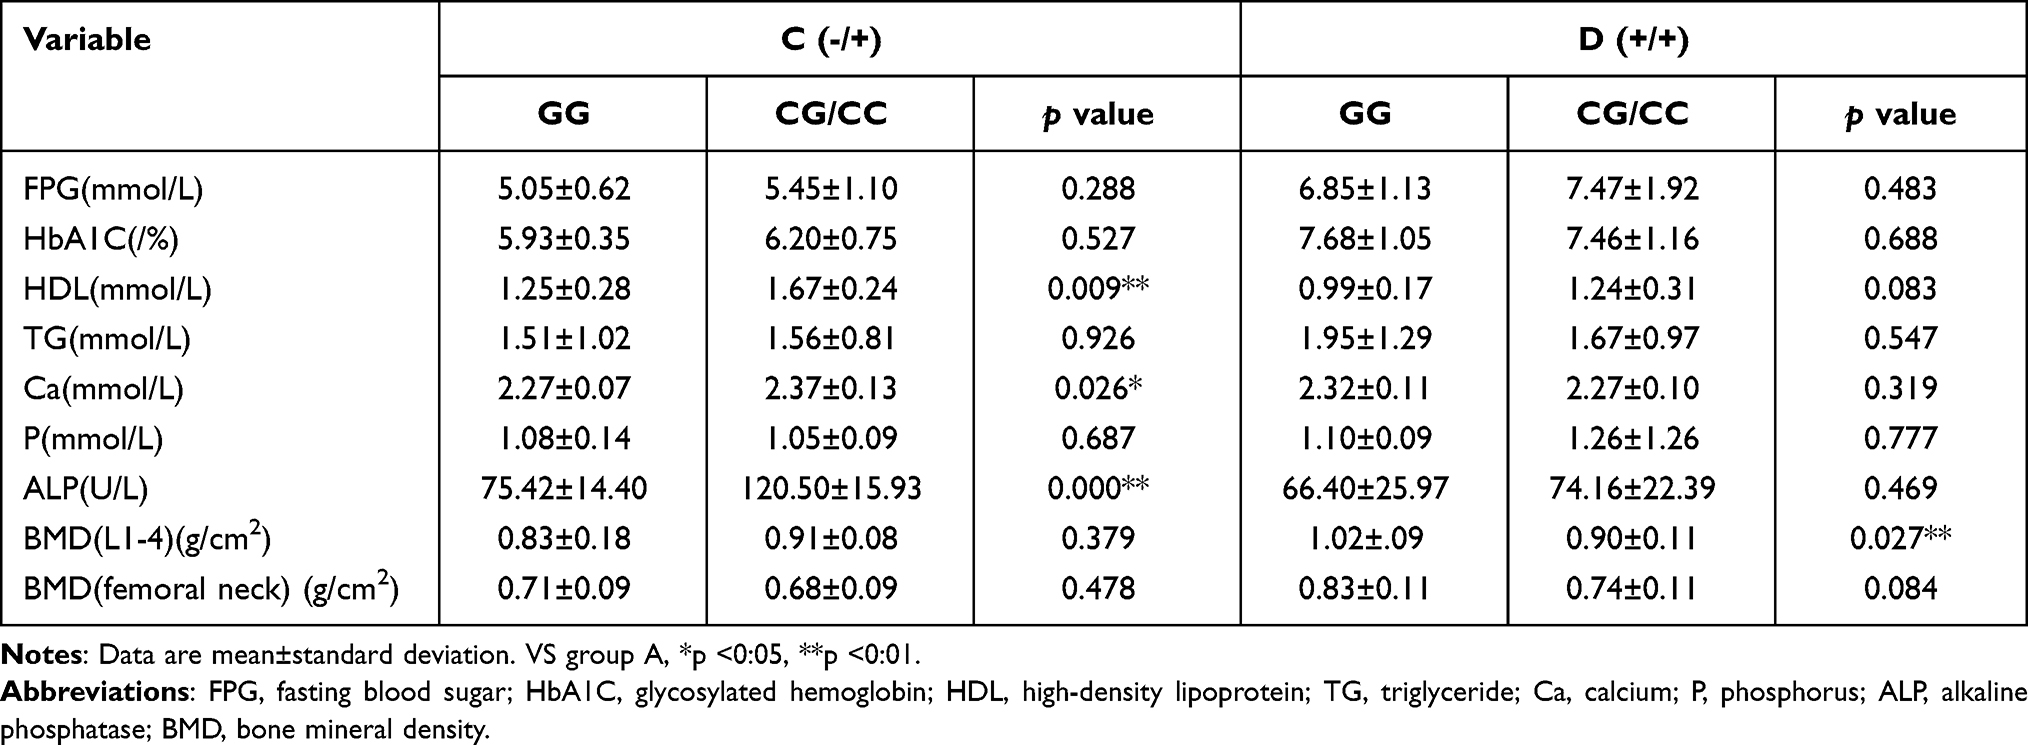 |
Table 4 Comparison of Biochemical Indexes and BMD Between Genotypes at the SOST Gene Rs851056 Locus in Each Group ( |

A (-/-):A (NGT+ Normal bone mass); B (±):B (T2DM+ Normal bone mass); C (-/+):C (NGT+OP); D (+/+): D (T2DM +OP); (- for NGT or normal bone mass; + for T2DM or OP).
Comparison of SOST Protein Results Among Four Groups
Compared with those in the control group A(-/-), the SOST protein expression levels were elevated in group C(-/+) and group D(+/+), and the differences were statistically significant (p < 0.01) (Table 5).
 |
Table 5 SOST Protein Expression Levels in the Four Groups |
A (-/-):A (NGT+ Normal bone mass); B (±):B (T2DM+ Normal bone mass); C (-/+):C (NGT+OP); D (+/+): D (T2DM +OP); (- for NGT or normal bone mass; + for T2DM or OP).
Analysis of Correlation Between SOST Protein Levels and BMD
The correlation research was conducted on all research subjects and the results showed that SOST protein levels were weakly correlated with BMD (L1-4), with a negative correlation (p<0.05) (Table 6).
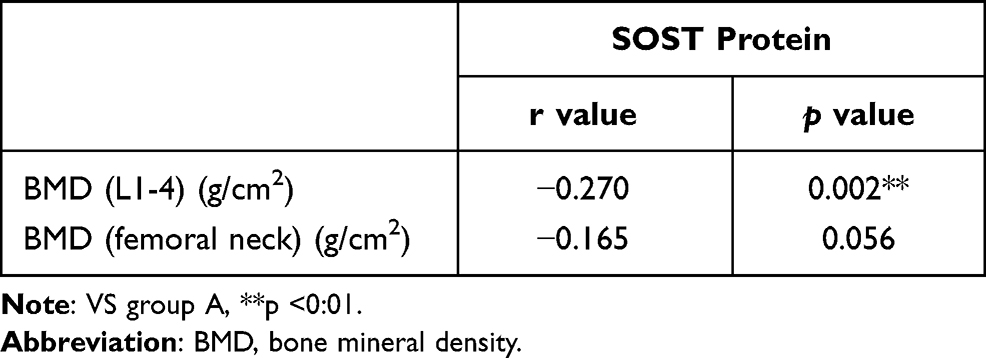 |
Table 6 Correlation Analysis of SOST Protein and BMD |
A (-/-):A (NGT+ Normal bone mass); B (±):B (T2DM+ Normal bone mass); C (-/+):C (NGT+OP); D (+/+): D (T2DM +OP); (- for NGT or normal bone mass; + for T2DM or OP).
Multiple Linear Regression Analysis of BMD and Corresponding Indexes
In group D(+/+), multiple linear regression analysis was conducted with BMD (L1-4) and BMD (femoral neck) as the response variables and BMI (X1), FPG (X2), HbA1c (X3), genotype (X4), WHR (X5), age (X6), year of menopause (X7), LDL (X8), HDL (X9), TG (X10), ALP (X11), P (X12), Ca (X13), and SOST protein (X14) as independent variables, respectively.
The results of multiple stepwise regression analysis of BMD and SOST gene polymorphisms showed that the decreases in BMI and TG, as well as the mutation of rs851056 locus, were the risk factors for the decrease of BMD (L1-4). Moreover, the decrease of BMI, an increase in ALP, and extended menopausal years were the risk factors for the decrease of BMD (femoral neck) (Table 7).
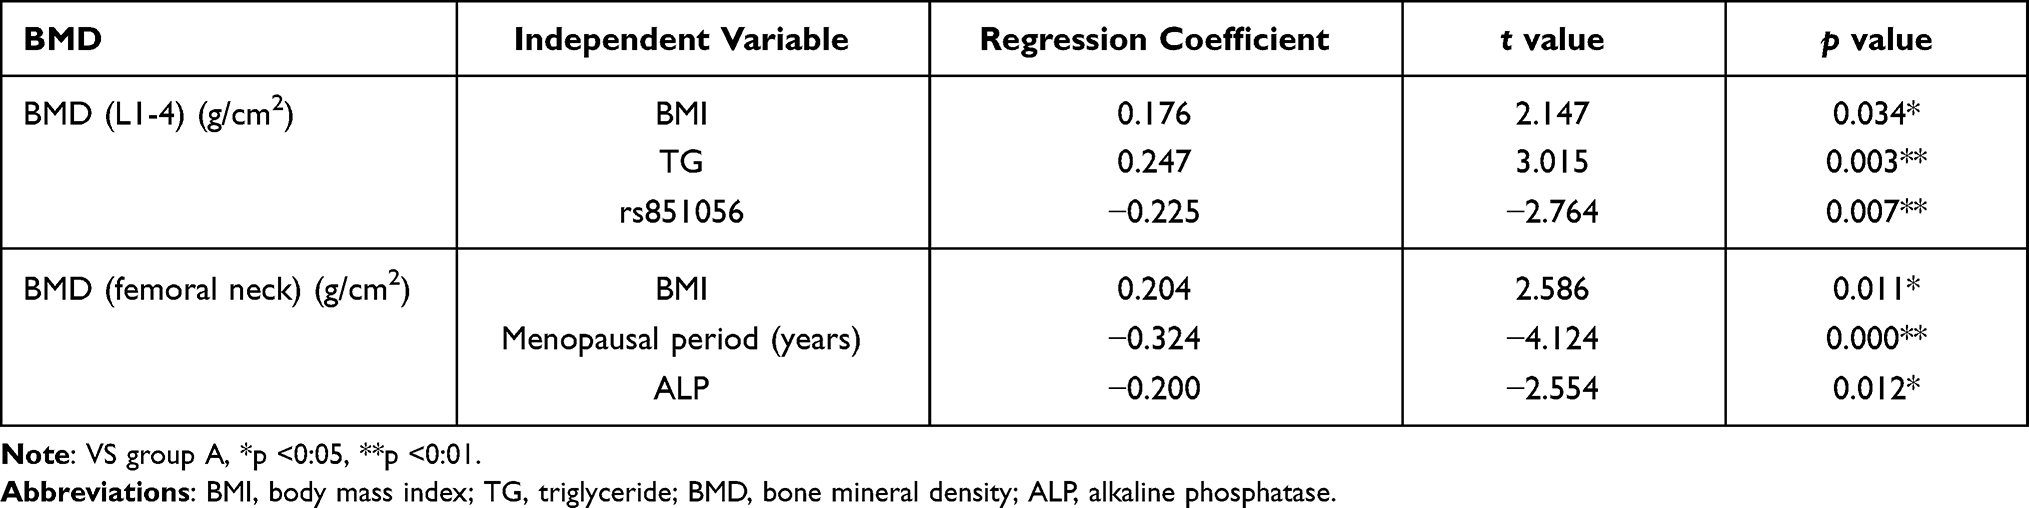 |
Table 7 Multiple Linear Regression Analysis of BMD Influencing Factors |
A (-/-):A (NGT+ Normal bone mass); B (±):B (T2DM+ Normal bone mass); C (-/+):C (NGT+OP); D (+/+): D (T2DM +OP); (- for NGT or normal bone mass; + for T2DM or OP).
Discussion
The high incidence and fracture rate of OP seriously affect the quality of life of patients.7 Studies have shown that estrogen can limit bone turnover, inhibit bone resorption, and increase bone density. For postmenopausal women, the incidence of OP increases significantly due to decreased estrogen production as a result of decreased ovarian function.4 Several factors have been attributed to the occurrence of OP in patients with T2DM, of which environmental and genetic are the essential factors. At present, the conclusions on the influence of T2DM on BMD are inconsistent. Several studies have reported a significant increase in the incidence of both bone fragility and osteoporosis in patients with T2DM,8–10 whereas other studies have reported that T2DM patients have a higher or normal bone density.11,12 Based on the results of this study, it was found that Ca and ALP in type GG were lower than those in type GC/CC in patients in group NGT+OP (-/+) at rs851056 locus, indicating that the rs851056 locus gene polymorphism possibly exerted a negative effect on bone metabolism. However, this mutation also caused an increase in BMD (L1-4) in patients in group T2DM +OP (+/+). The reasons for these contradictory results may be 1. It is unclear whether the effect of type 2 diabetes on bone mass is a positive protective factor or a risk factor, for the results of the present study, it is considered that it may be a protective factor, which is antagonistic to the risk factor brought about by the rs851056 locus gene, leading to an increase in bone mineral density in this study; however, the specific theory related to this needs further study. 2. The number of cases in this study is small, and various confounding biases cannot be excluded, such as sampling bias, leading to errors in the results, and more extensive, high-quality studies are needed.
In the present study, we found that the genotype and allele frequencies of SOST genes rs851056 and rs1230399 were consistent with the Hardy-Weinberg genetic balance law, indicating that the subjects were from the same natural population and were representative. The rs851056 locus was located at the 5ʹ UTR end of the SOST gene, and the genotypes were CC, CG, and GG, respectively. In the present study, the minor allele frequency (MAF) of rs851056 was 0.356, which was comparable to that of postmenopausal women in Korea (0.38),13 Australia (0.33),14 Spain (0.38),15 and Africa (0.350),16 but lower than the population of postmenopausal women in Shanghai, China (0.391),17 and the difference of MAF in different studies may be related to ethnic differences, regions, different detection methods and other factors.
The rs851056 locus is located approximately 1100 bp upstream of the SOST transcription initiation site, so it can be hypothesized that its allele variation can affect gene transcription. In this study of Xinjiang postmenopausal women with T2DM, we found that the genotype frequency and allele frequency of this locus was statistically significant in group B (±) and group D (+/+) compared with group A (-/-), among them, the frequencies of rs851056-C allele (47.8%) in group B and rs851056-C allele (51.8%) in group D were higher than those in group A(19.2%), suggesting that rs851056-C allele may increase the risk of T2DM and T2DM complicated with abnormal bone mass in postmenopausal women in Xinjiang. Furthermore, in group D, BMD (L1-4) of patients with CG/CC genotype was lower than that of patients with GG genotype, verifying that mutation in G/C allele at rs851056 site of SOST gene might cause differential expression of BMD, and multiple stepwise regression results also showed that mutations at the rs851056 locus were involved in the decrease of the BMD. These findings indicate that polymorphisms at this locus and its mutations may be involved in the development of OP in postmenopausal women with T2DM. Our findings are consistent with some previous reports. For example, Carmen Valero et al found that polymorphisms at the rs851056 locus were associated with BMD (lumbar spine) in the two groups of Spaniards,15 but the research shows that the BMD with the G allele was lower, which was significantly different from the present study, possibly due to the differences of ethnic and regional in the study population. In addition, Sims et al also found that rs851056 polymorphism is related to BMD in various parts of Australian women.14 However, Lee et al reported that this site may not be a related factor of BMD.13 Our research data further support the argument that the allelic variation of the rs851056 locus is related to BMD, suggesting that the rs851056 locus may be a susceptible gene locus for T2DM complicated with abnormal bone mass, which may predict changes in bone metabolism index and BMD.
SOST protein can inhibit bone differentiation and bone formation,14 and the results are inconsistent with domestic and international studies on the relationship between the SOST protein and BMD. For example, Koide et al18 found that the SOST protein was positively correlated with the BMD of the lumbar spine in T2DM patients. Still, Mirza19 surveyed 20 postmenopausal women in the United States and found that the SOST protein was negatively correlated with the femoral neck and lumbar spine BMD. This study found an increased level of SOST protein expressions in patients with T2DM + OP. Through relative analyses, it was revealed that the serum SOST protein level was negatively correlated with BMD (L1-4), suggesting that the high SOST protein is a risk factor for OP.
Research on the relationship between SOST protein and diabetes has received considerable attention in recent years.20–22 When Daniele G studied the relationship between serum osteosclerotic protein and fasting glucose, they found a strong positive correlation between fasting glucose and serum osteosclerotic protein;23, this conclusion is consistent with some previous literature reports. The result of Faienza et al showed that SOST level was increased in children with type 1 diabetes,24 while Sundararaghavan et al found that the incidence of osteoporosis was increased in patients with type 1 diabetes,25 suggesting that SOST may play an essential role in diabetes-related orthopedic complications. In our study, we found that there was no statistical significance between the T2DM+ Normal bone mass(±) group and the NGT+ Normal bone mass (-/-) group, the reasons may be related to factors such as different races and testing methods. Besides, we found statistical significance in comparing discrepancies of genotype and allele frequency of the rs851056 locus by comparing the T2DM+ Normal bone mass (±) group with the NGT+ Normal bone mass (-/-) group, from this we can consider that rs851056 gene polymorphism and gene frequency distribution may be related to abnormal glucose metabolism. No previous reports of association studies of the relationship between the polymorphism and mutations of the rs851056 locus and glucose metabolism have been published, and there needs to be further study in the future.
Conclusion
To sum up, SOST protein expression and genetic locus rs851056, rs1230399 polymorphism are associated with bone mineral density in postmenopausal women with type 2 diabetes mellitus in Xinjiang. While several have been attributed to OP, the effect of SOST polymorphism on bone mineral density needs to be confirmed by prospective studies with larger sample sizes.
Abbreviations
BMI, body mass index; WHR, waist hip ratio; FPG, fasting blood sugar (3.9–6.1 mmol/L); HbA1C, glycosylated hemoglobin (4.0–6.1%); TG, triglyceride (0–1.7 mmol/L); HDL, high-density lipoprotein (1.29–1.55 mmol/L); LDL, low-density lipoprotein (0–3.37 mmol/L); Ca, calcium (2.2–2.7 mmol/L); P, phosphorus (0.85–1.51 mmol/L); ALP, alkaline phosphatase (45–125U/L); BMD, bone mineral density (T value≧-1.0SD).
Data Sharing Statement
All data, models, or code used during the study are available from the corresponding author by request.
Ethical Approval and Considerations
The project was reviewed and approved by the First Affiliated Hospital of Shihezi. We briefly explained the risks, benefits and objective to each participant. Finally, those who signed the consent form were included.
Acknowledgments
This work was supported by the funding of the Project of Regional innovation guidance plan (2018BB040); Achievement transformation and technology popularization project of Shihezi University (CGZH201911).
Disclosure
The authors declare that they have no competing interests in this work.
References
1. Sapir-Koren R, Livshits G. Postmenopausal osteoporosis in rheumatoid arthritis: the estrogen deficiency-immune mechanisms link. Bone. 2017;103:102–115. doi:10.1016/j.bone.2017.06.020
2. Gourlay ML, Overman RA, Fine JP, et al.; Women’s Health Initiative Investigators. Baseline age and time to major fracture in younger postmenopausal women. Menopause (New York, N Y). 2015;22(6):589–597. doi:10.1097/GME.0000000000000356
3. Rawshani A, Rawshani A, Franzén S, et al. Mortality and cardiovascular disease in type 1 and type 2 diabetes. N Engl journalJ Med. 2017;376(15):1407–1418. doi:10.1056/NEJMoa1608664
4. Katoh M, Katoh M. Molecular genetics and targeted therapy of WNT-related human diseases (Review). Int J Mol Med. 2017;40(3):587–606. doi:10.3892/ijmm.2017.3071
5. Wongdee K, Charoenphandhu N. Update on type 2 diabetes-related osteoporosis. World J Diabetes. 2015;6(5):673–678. doi:10.4239/wjd.v6.i5.673
6. Starup-Linde J, Lykkeboe S, Gregersen S, et al. Bone structure and predictors of fracture in type 1 and type 2 diabetes. J Clin Endocrinol Metab. 2016;101(3):928–936. doi:10.1210/jc.2015-3882
7. Vazquez-Villegas M, Rodriguez-Jimenez N, Contreras-Haro B, et al. Genotypic analyses of the sclerostin rs851056 and Dickkopf rs1569198 polymorphisms in Mexican-Mestizo postmenopausal osteoporosis: a case-control study. Genet Test Mol Biomarkers. 2021;25(3):211–217. doi:10.1089/gtmb.2020.0199
8. Mohd-Tahir NA, Li SC. Economic burden of osteoporosis-related hip fracture in Asia: asystematic review. Osteoporosis Int. 2017;28(7):2035–2044. doi:10.1007/s00198-017-3985-4
9. Yamamoto M, Yamauchi M, Sugimoto T, Vashishth D. Prevalent vertebral fracture is dominantly associated with spinal microstructural deterioration rather than bone mineral density in patients with type 2 diabetes mellitus. PLoS One. 2019;14(9):e0222571. doi:10.1371/journal.pone.0222571
10. Parle E, Tio S, Behre A, et al. Bone mineral is more heterogeneously distributed in the femoral heads of osteoporotic and diabetic patients: a pilot study. JBMR Plus. 2019;4(2):e10253. doi:10.1002/jbm4.10253
11. Lekkala S, Taylor EA, Hunt HB, et al. Effects of diabetes on bone material properties. Curr Osteoporos Rep. 2019;17(6):455–464. doi:10.1007/s11914-019-00538-6
12. Oz SG, Guven GS, Kilicarslan A, et al. Evaluation of bone metabolism and bone mass in patients with type-2 diabetes mellitus. J Natl Med Assoc. 2006;98(10):1598–1604.
13. Lee D, Kim H, Ku S, et al. Association between polymorphisms in sclerostin, dickkopfs and secreted frizzled-related protein genes and bone mineral density in postmenopausal Korean women. Gynecol Obstet Invest. 2014;77(3):186–193. doi:10.1159/000358389
14. Sims A, Shephard N, Carter K, et al. Genetic analyses in a sample of individuals with high or low BMD shows association with multiple Wnt pathway genes. J Bone Mineral Res. 2008;23(4):499–506. doi:10.1359/jbmr.071113
15. Valero C, Zarrabeitia M, Hernández J, et al. Relationship of sclerostin and secreted frizzled protein polymorphisms with bone mineral density: an association study with replication in postmenopausal women. Menopause (New York, N Y). 2011;18(7):802–807. doi:10.1097/gme.0b013e3182091664
16. Kuipers A, Zhang Y, Yu S, et al. Relative influence of heritability, environment and genetics on serum sclerostin. Osteoporosis Int. 2014;25(3):905–912. doi:10.1007/s00198-013-2517-0
17. He J, Zhang H, Wang C, et al. Associations of serum sclerostin and polymorphisms in the SOST gene with bone mineral density and markers of bone metabolism in postmenopausal Chinese women. J Clin Endocrinol Metab. 2014;99(4):E665–E673. doi:10.1210/jc.2013-2086
18. Koide M, Yamashita T, Murakami K, et al. Sclerostin expression in trabecular bone is downregulated by osteoclasts. Sci Rep. 2020;10(1):13751. doi:10.1038/s41598-020-70817-1
19. Mirza FS, Padhi ID, Raisz LG, et al. Serum sclerostin levels negatively correlate with parathyroid hormone levels and free estrogen index in postmenopausal women. J Clin Endocrinol Metab. 2010;95(4):1991–1997. doi:10.1210/jc.2009-2283
20. Wu Y, Xu SY, Liu SY, et al. Upregulated serum sclerostin level in the T2DM patients with femur fracture inhibits the expression of bone formation/remodeling-associated biomarkers via antagonizing Wnt signaling. Eur Rev Med Pharmacol Sci. 2017;21(3):470–478. PMID: 28239825.
21. Yu OH, Richards B, Berger C, et al. The association between sclerostin and incident type 2 diabetes risk: a cohort study. Clin Endocrinol (Oxf). 2017;86(4):520–525. doi:10.1111/cen.13300
22. Tsentidis C, Gourgiotis D, Kossiva L, et al. Sclerostin distribution in children and adolescents with type 1 diabetes mellitus and correlation with bone metabolism and bone mineral density. Pediatr Diabetes. 2016;17(4):289–299. doi:10.1111/pedi.12288
23. Daniele G, Winnier D, Mari A, et al. Sclerostin and insulin resistance in prediabetes: evidence of a cross talk between bone and glucose metabolism. Diabetes Care. 2015;38(8):1509–1517. doi:10.2337/dc14-2989
24. Faienza MF, Ventura A, Delvecchio M, et al. High sclerostin and Dickkopf-1 (DKK-1) serum levels in children and adolescents with type 1 diabetes mellitus. J Clin Endocrinol Metab. 2017;102(4):1174–1181. doi:10.1210/jc.2016-2371
25. Sundararaghavan V, Mazur M, Evans B, et al. Diabetes and bone health: latest evidence and clinical implications. Ther Adv Musculoskelet Dis. 2017;9(3):67–74. doi:10.1177/1759720X16687480
 © 2021 The Author(s). This work is published and licensed by Dove Medical Press Limited. The
full terms of this license are available at https://www.dovepress.com/terms
and incorporate the Creative Commons Attribution
- Non Commercial (unported, 3.0) License.
By accessing the work you hereby accept the Terms. Non-commercial uses of the work are permitted
without any further permission from Dove Medical Press Limited, provided the work is properly
attributed. For permission for commercial use of this work, please see paragraphs 4.2 and 5 of our Terms.
© 2021 The Author(s). This work is published and licensed by Dove Medical Press Limited. The
full terms of this license are available at https://www.dovepress.com/terms
and incorporate the Creative Commons Attribution
- Non Commercial (unported, 3.0) License.
By accessing the work you hereby accept the Terms. Non-commercial uses of the work are permitted
without any further permission from Dove Medical Press Limited, provided the work is properly
attributed. For permission for commercial use of this work, please see paragraphs 4.2 and 5 of our Terms.