Back to Journals » International Journal of General Medicine » Volume 14
Relationship Between Masked Hypertension Measured by Ambulatory Blood Pressure Monitoring and Left Ventricular Global Longitudinal Strain: A Retrospective Study
Authors Fu M, Hu X, Sun S, Yi S, Zhang Y, Feng Y, Zhou Y, Geng Q ![]() , Dong H
, Dong H ![]()
Received 18 March 2021
Accepted for publication 5 May 2021
Published 25 May 2021 Volume 2021:14 Pages 2053—2061
DOI https://doi.org/10.2147/IJGM.S310414
Checked for plagiarism Yes
Review by Single anonymous peer review
Peer reviewer comments 3
Editor who approved publication: Dr Scott Fraser
Ming Fu,1,* Xiangming Hu,2,* Shuo Sun,1 Shixin Yi,1 Ying Zhang,1 Yingqing Feng,1 Yingling Zhou,1 Qingshan Geng,1 Haojian Dong1
1Department of Cardiology, Guangdong Cardiovascular Institute, Guangdong Provincial People’s Hospital, Guangdong Academy of Medical Sciences, Guangzhou, Guangdong, People’s Republic of China; 2The Second School of Clinical Medicine, Southern Medical University, Guangzhou, Guangdong, China.; Department of Cardiology, Guangdong Provincial People’s Hospital, Guangdong Academy of Medical Sciences, Guangzhou, Guangdong, People’s Republic of China
*These authors contributed equally to this work
Correspondence: Haojian Dong
Department of Cardiology, Guangdong Cardiovascular Institute, Guangdong Provincial People’s Hospital, Guangdong Academy of Medical Sciences, Guangzhou, Guangdong, People’s Republic of China
Email [email protected]
Purpose: Masked hypertension (MHT), as an independent clinical entity, the cardiac dysfunction caused by it can be early detected through left ventricular global longitudinal strain (GLS), yet the quantitative relation between MHT and GLS is still unclear. Therefore, we tried to conduct a community-based retrospective study to define this relationship.
Patients and Methods: A total of 308 enrolled participants from Dongguan, China, were divided into non-hypertension (NHT) and MHT groups. Baseline characteristics were recorded, and echocardiography and 24-hour ambulatory blood pressure monitoring were performed. Linear regression analysis and receiver-operating characteristic (ROC) curve analysis were used to assess the associations between MHT and GLS in univariate and multivariate models, and the dose–response curve was plotted to demonstrate their relationship.
Results: The mean age of the NHT and MHT groups was 57 and 60 years, respectively. Signs of left ventricular diastolic function, E/A was reduced and E/e’ was increased in the MHT group while those of the NHT group were nearly normal. The MHT group also showed a significantly lower (“worse”) GLS than NHT (− 15.2% vs − 19.9%, P < 0.001) while left ventricular ejection fraction (LVEF) did not differ between the groups. Worse GLS was independently and significantly associated with MHT both in univariate (odds ratio [OR]: 1.97, P < 0.001) and stepwise multivariate regression analysis (OR: 1.99, P < 0.001). Comparison of ROC curve results showed that area under curve of GLS was larger than that of E/e’ both in unadjusted (0.8673 vs 0.6831) and adjusted model (0.9178 vs 0.8284). Further analysis showed adjusted nonlinear correlation between MHT and GLS.
Conclusion: Based on the relationship between MHT and GLS, in clinical practice, GLS measurement could facilitate diagnosis for suspected MHT patients and could define the extent of left ventricular dysfunction for diagnosed MHT patients.
Keywords: masked hypertension, left ventricular dysfunction, global longitudinal strain, nonlinear relation
Introduction
Masked hypertension (MHT) is characterized by normal blood pressure (BP) readings in the office and increased out-of-office BP readings.1 With the wide use of ambulatory blood pressure monitoring (ABPM) and home blood pressure monitoring, this phenomenon has been increasing in routine health care. The prevalence of MHT in the general population ranges from 8% to 30%.2 Unlike office hypertension, the target organ damage caused by MHT is insidious. Recent comparative studies have shown that MHT has 67% higher risk of all-cause mortality and a 71% higher risk of fatal and nonfatal cardiovascular events compared with normotensive individuals.3,4 Early recognition of cardiac dysfunction in MHT patients would be of great significance for timely treatment and improved prognosis of these patients.5
Since most community residents lack routine health screening, most patients with MHT are not discovered until they develop symptoms caused by persistent hypertension, at which time there has already been significant cardiac structural remodeling and eventually irreversible decrease in left ventricular ejection fraction (LVEF).6 Recently, assessment of global longitudinal strain (GLS) with the use of 2-dimensional speckle-tracking echocardiography technique has shown the ability to recognize minor injury in cardiac function before the decrease in LVEF. However, the association between MHT and impaired GLS has not yet been extensively discussed. Furthermore, it is also unknown whether their relation is affected by common hypertension-related factors including individual behavior and coexisting diseases. Therefore, we launched a community-based retrospective study to try to address this issue.
Materials and Methods
This study was approved by the Ethical Committee of Guangdong Provincial People’s Hospital and was conducted in accordance with the principles of the Declaration of Helsinki II. All participants gave orally informed consent for study participation, which was also approved by the Ethical Committee of Guangdong Provincial People’s Hospital.
Study Population
This study was designed as a retrospective study in the population that had participated in the High-Risk Cardiovascular Screening For Chronic Disease Management Program in Dongguan carried out by Guangdong Cardiovascular Institute in 2012.7 The Community Health Centers involved in the program opened to community people for physical examination, blood pressure monitoring, cardiac ultrasound examination, blood sample analysis, diabetes evaluation, as well as provided health education. In this study, the inclusion criteria were as follows: 1) age 30–75 years; 2) sinus rhythm at ECG; 3) LVEF (Simpson’s) > 50%; 4) finishing ABPM test. The exclusion criteria were as follows: 1) sustained hypertension; 2) secondary hypertension; 3) history of using antihypertensive drugs used or stopped taking antihypertensive drugs for more than 2 weeks before the study; 4) history of myocardial infarction; 5) history of myocarditis; 6) structural heart disease; 7) peripheral artery disease; 8) chronic kidney disease; 9) autoimmune disease or tumor.
ABPM was performed in Community Health Centers for screening people with suspected cardiovascular risk factors. According to the results of ABPM, patients with MHT were selected as case group while patients with NHT in the same screening period were matched as control group. All experimental data were collected from the database of the medical center and recorded by two authors.
Blood Pressure and Laboratory Measurements
Office BP measurements in the clinic were performed by experienced community doctors and nurses using a calibrated OMRON Upper Arm Electronic Sphygmomanometer (Model HBP1100U). After the participants had taken a seat and rested for at least 5 minutes, the cuff BP measurement obtained three consecutive readings that were averaged for the analysis. ABPM was performed uniformly using the verified and qualified TM2430 Oscillometric Ambulatory Blood Pressure Monitor of AND Company. The participants’ BP was continuously monitored for 24 hours, for every 20 minutes during the waking period and every 30 minutes during the sleeping period. Unqualified data (including less than 70% success rate of BP measurement or < 20 readings during waking period or < 7 readings during sleep period) were repeatedly measured. According to the 2013 European Society of Hypertension criteria,8 MHT was defined as office BP (average of three readings) < 140/90mmHg, but ambulatory BP 24-h average BP ≥ 130/80mmHg and/or daytime (waking period) average BP ≥ 135/85mmHg and/or nighttime (sleeping period) average BP ≥ 120/70mmHg. Otherwise, non-hypertension (NHT) was considered.
Low-density lipoprotein cholesterol (LDL-C), uric acid, and creatinine were detected using a BackmanAU5800 spectrophotometer via colorimetry or immunoturbidimetry.
Echocardiographic Analysis
A comprehensive transthoracic echocardiography examination was performed by experienced sonographers after finishing ABPM test, using the Vivid S6 M4S-RS Probe (GE Medical System) interfaced with a 2.5- to 3.5-MHz phased-array probe. With the subject in the left decubitus position and breathing normally, the observer obtained images and synchronized ECG signals from the apical four-chamber and two-chamber long-axis views along the parasternal long and short axes. All records included at least three cardiac cycles and were digitally stored for offline analysis. All recordings and measurements were recorded in accordance with the guidelines of the American Society of Echocardiography.9,10
GLS was measured through the 2 dimensional-STE technology developed by GE company. We imported the complete dynamic images into the Echo PAC ultrasound workstation and used Q-Analysis to enter the 2 dimensional-strain analysis module. After positioning, tracking, and adjustment, the region of interest with a specific width is automatically calculated. According to the 17-segment model, in the apical four-chamber, two-chamber heart, and three-chamber plane, the myocardial motion of each segment at each cardiac cycle in the region of interest was tracked frame by frame to obtain the longitudinal strain as well as the corresponding curve.11 Finally, the left ventricular GLS was calculated based on the average value derived from all segment’s longitudinal strain.
Left ventricular diastolic dimension (LVDd), interventricular septal depth (IVSd) and left ventricular posterior wall depth (LVPWd) were made in the parasternal long axis with the M-mode cursor positioned just beyond the mitral leaflet tips, perpendicular to the long axis of the ventricle. The mitral flow velocities were recorded with pulsed-wave Doppler with the sample volume placed at the tip of the mitral valve tips from the apical four-chamber view. Myocardial velocities were recorded using a standard pulsed-wave Doppler technique. Left ventricular (LV) diastolic function was assessed by mitral inflow E and A wave sand early diastolic velocity e’ at the septal and lateral mitral annulus as an indicator of LV relaxation.12,13 LVEF was measured by Simpson’s method. LV mass was calculated indirectly from the thickness of the ventricular wall:
LV mass (g) = {1.04*(IVSd+LVDd+LVPWd)3-(LVDd)3}*0.8+0.6.
Body surface area (BSA) was expressed by:
BSA (m2)=0.0061×height (cm)+0.0128×weight (kg)-0.1529.
LV mass index (LVMI) was calculated as:
LVMI = LV mass/BSA.
Statistical Analysis
Statistical analysis was performed in four steps. First, the baseline characteristics of the participants divided into two groups (MHT and NHT) were measured based on the following principles: (1) continuous variables were expressed as the means ± standard deviations (for normal distribution) or medians/quartiles (for skewed distribution), and categorical variables were shown as the frequencies with percentages; (2) t test for normally distributed data, Mann–Whitney U-test for skewed distribution data, and chi-square test/Fisher’s exact test for categorical variables were used to identify significant differences between the groups. Next, univariate and multivariate logistic analyses of common hypertension-related factors and GLS were conducted to evaluate their effect on MHT. After that, based on the logistic analysis model, receiver operating characteristic curve (ROC) and area under the curve (AUC) were obtained to explore the relationships between MHT and GLS, as well as between MHT and other traditional cardiac ultrasound index. Then, the interaction analysis was conducted to assess whether the relation between GLS and MHT was affected by other factors. Finally, all hypertension-related factors were pooled for multivariate adjustment by logistic analysis and used to assemble generalized additive models (GAM) to identify relationship between GLS and MHT. If an incremental effect model was present, the inflection point of the curve was taken as the threshold for stratification. The inter-observer (two independent observers) and intra-observer variabilities were evaluated by the intraclass correlation coefficients (ICCs) with all of GLS measurements.
Comparisons with P < 0.05 (two-sided) were considered to be statistically significant. All analyses were performed with Stata 15.0, R(version 3.4.3) and EmpowerStats (http://www.empowerstats.com, X&Y Solutions, Inc., Boston, MA).
Results
Baseline Characteristics
Descriptive characteristics of the study population are shown in Table 1 dichotomized by the presence or absence of MHT. The study included 308 consecutive participants, representing a range of community populations. The mean age was 57 years in the NHT group and 59 years in the MHT group. BMI, uric acid and smoking status were significantly different between the two groups.
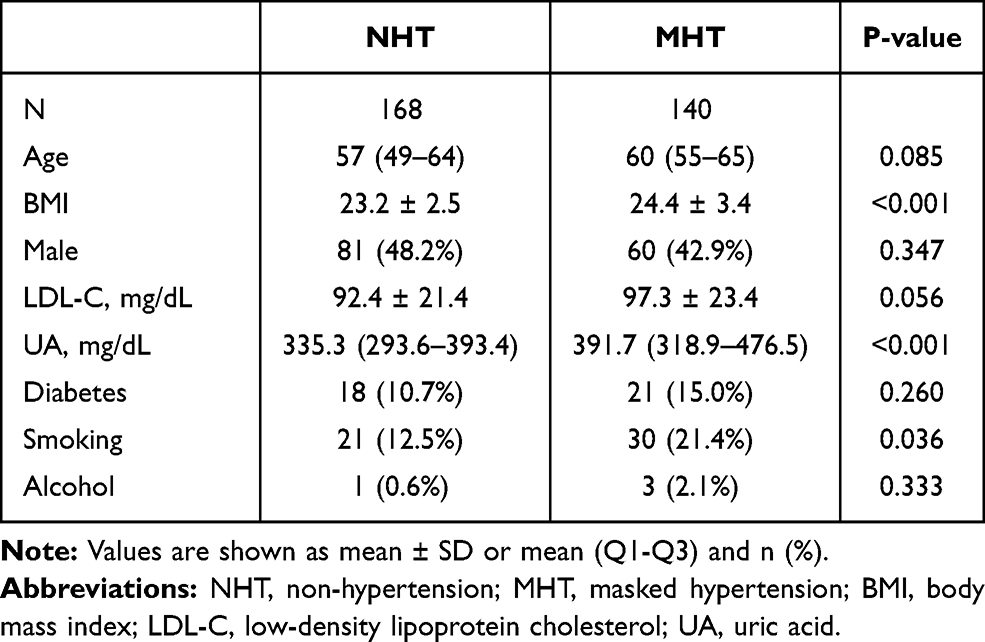 |
Table 1 Baseline Characteristics of the Study Population |
Echocardiographic and Imaging Parameters
Table 2 lists the M-mode, 2-dimensional and speckle-tracking echocardiographic parameters of the study participants. The MHT group showed thicker IVSd and LVPWd. For LV diastolic function indicators, E/A was reduced and E/e’was increased in the MHT group while those of the NHT group were basically normal. LVMI was significantly enlarged in the MHT group, while GLS was lower (“worse”) (−19.9% vs −15.2%, P < 0.001; Figure 1). Besides, LVEF was not significantly different between the groups.
 |
Table 2 Echocardiographic Data of the Study Population |
 |
Figure 1 Bee chart of difference in GLS between NHT and MHT groups. |
Relationship Between MHT and GLS
Parameters associated MHT were evaluated with logistic regression analysis, with univariate and multivariate analysis. As shown in Figure 2, GLS was significantly associated with MHT in both univariate (OR: 1.97, P <0.001) and stepwise multivariate regression analysis (OR: 1.99, P <0.001). In order to find out whether GLS would better reflect the relationship with MHT than with other traditional cardiac ultrasound index, we plotted ROC curve based on logistic regression analysis. As shown in Figure 3, the AUC of GLS was higher than E/e’ both in univariate (0.8673 vs 0.6831) and multivariate analysis (0.9178 vs 0.8284). In the existing and exploratory subgroups of the research entity, no interaction between the various factors was observed, which demonstrated that the relation between GLS and MHT was consistently significant (Supplementary Table 1).
 |
Figure 2 Forest plot of association between MHT and related factors in the study subjects. Abbreviations: BMI, body mass Index; LDL-C, low-density lipoprotein cholesterol; UA, uric acid; LVMI, left ventricular mass index; GLS, global longitudinal strain. CI, confidence interval. |
 |
Figure 3 Values of parameters on ROC curve to show the relationship between variable and MHT. Notes: (A) Univariate analysis for GLS or E/e’; (B) Multivariate analysis for GLS or E/e’, adjusted for gender, age, BMI, LDL-C, UA, diabetes, smoking, alcohol and LVMI. |
The Nonlinear Trend Between MHT and GLS
After adjusting for individual and clinical factors of MHT, we obtained the nonlinear correlation between MHT and GLS (Figure 4). People without MHT had higher GLS than −20%, and when GLS was lower than −20%, the potential risk of MHT gradually increased. The threshold of GLS measurement for left ventricular dysfunction caused by diagnosed MHT was −14%.
 |
Figure 4 Non-linear relationship between GLS and MHT after adjustment for covariates. Notes: The x-axis shows GLS, and the y-axis shows the incidence of MHT, with the dotted lines area representing 95% confidence intervals (Linear trend: P < 0.001); Adjusting for gender, age, BMI, LDL-C, UA, diabetes, smoking, alcohol and LVMI. |
Interobserver and Intraobserver Variability
As it has been shown in Table 3, inter-observer and intra-observer correlation were high for GLS measurement.
 |
Table 3 Intra- and Inter-Observer Variability |
Discussion
In the present study, we used GAM to quantitatively elucidate the non-linear relationship between MHT and GLS among participants. As the probability of MHT arises, GLS gradually decreases. In the fully adjusted model, −14% of GLS was considered the critical value to represent left ventricular dysfunction caused by MHT.
First, we evaluated the relationship between MHT and GLS through univariate regression analysis, and further confirmed the relation by multivariate regression after adjusting for the influence of the confounding factors. Since a previous study suggested that LVMI had a reduced GLS,14 we also adjusted LVMI for analysis. Next, the AUC values of the ROC curves at different models provided a favorable supporting evidence for the strong correlation between MHT and GLS. And then, interaction analysis indicated that MHT and GLS had a strong relation in various situations. Finally, since GLS was a continuous variable, we plotted the fitting curve based on the dose–response relationship and found a nonlinear trend. With the help of the inflection point of the curve, we identified the risk threshold of GLS based on different MHT risk levels. To the best of our knowledge, this is the first description of the non-linear relation between MHT and GLS in a community-dwelling population.
Pickering proposed the concept of MHT and emphasized the hazard of it.15 Since then, many studies have been done on the prognosis of MHT. A substudy of PAMELA cohort focusing on MHT patients showed that after follow-up for 10 years, the risk of new-onset left ventricular hypertrophy was high even after adjusting for confounding factors (OR: 2.22, P=0.025), suggesting an increased risk of cardiac structural change caused by MHT.16 Histologically, the damage of MHT occurs at early stage as it elongates the longitudinal fibers, thickens myocardial fibers and ventricular wall, and remodels myocardium due to long-term increased afterload.17 Compared with persistent hypertension, the attack of MHT is more insidious and poorly controllable; therefore, early recognition of MHT-related left ventricular dysfunction is not only helpful for the identification of MHT, but also can measure the degree of impaired left ventricular function.
Two-dimensional (2D) speckle-tracking echocardiography technique, which can quantify myocardial strain by GLS measurement, has been validated by tagged cardiac magnetic resonance imaging.18–20 The latest guidelines also suggests that for patients with near-normal EF, global longitudinal strain has shown prognostic value, while prognostic information from EF is relatively less useful.21 Pathophysiologically, high levels of end-systolic wall stress, hypertrophic myocardium, and increased left ventricular stiffness play an important role in reducing the shortening of longitudinal subepicardial myocardial fibers, correspond to the cardiac histological impairment by MHT.22 Santos compared baseline GLS in 91 patients with pre-hypertension (systolic BP 120–139 mm Hg or diastolic BP 80–89 mm Hg, and not taking antihypertensive medication) and 105 patients with stage I hypertension (BP 140–159 or 90–99 mm Hg, and no current use of BP‐lowering medication); the result showed that stage I hypertension already has an impaired GLS accounting to about 1%.23 Although the 1% difference in GLS appears insignificant, studies have shown that a small decrease in GLS is a powerful indicator of hospitalization for heart failure, cardiovascular death, or cardiac arrest.24 In terms of GLS evaluation in MHT, Tadicet al previously retrospected 56 MHT patients and found that longitudinal strains was progressively deteriorated from normotensive group, particularly in the endocardial and midmyocardial layers.25 Luo studied 40 young MHT patients and also concluded the similar results.26 Both two studies compared the GLS difference between MHT and NHT, confirming the role of GLS in the assessment of cardiac function in MHT, but the correlation between MHT and GLS as well as potential cut-off value were not well defined. Our study included more MHT patients and strengthened the lower GLS in MHT than NHT by excluding disturbance or interaction from confounding factors. More importantly, we quantitatively described the dose–response relationship and defined a critical value of −14% as MHT-related left ventricular dysfunction. One explanation for this trend is that the pathology of MHT analogous to the early damage of hypertension, the changes of extracellular matrix and myocardial fibrosis mainly affect the subendocardium. Longitudinal fibers are more prone to fibrosis and hemodynamic overload due to their prominent subendocardial position. The more fibers damage, the less GLS. Previously, large-scale community population cohort studies shown that GLS assessment of left ventricular function can improve the cardiovascular risk stratification of patients.27 From the perspective of early identification to monitoring of left ventricular disorder, it is very necessary to promote GLS assessment in the routine clinical practice for MHT patients. So far, ABPM has been recommended by clinical guidelines for many years as the standard diagnostic method of MHT. Along with widely use of ABPM, factors that may cause inconsistent blood pressure readings and lead to miss diagnosis have been brought into focus, such as different activity levels, sensitive exposures (such as caffeine, alcohol), sleep quality, and emotional factors.28 In order to diagnose accurately and treat appropriately, the method of identifying MHT could not be limited to ABPM. Therefore, based on the special relation between MHT and GLS in our finding, turning to early identification of subtle myocardial remodelling by means of GLS in clinical practice may be a better way to provide diagnostic aid in identification of MHT in patients with normal office BP and discern potential victims thus make further treatment decision. Although we discussed the advantages of GLS as a quantitative indicator in identifying early left ventricular dysfunction, previous studies suggested that the measurement of GLS in diabetes with chronic heart failure was also affected by inflammatory activity and biomechanical stress indicators, such as NT-proBNP, high sensitivity C reactive protein and osteoprotegerin, which could affect the tension and flexibility of the myocardial wall.29 Using these biomarkers as predictors or risk stratification tools is also critical for comprehensive evaluation of left ventricular function in patients in the future.
Our research also has limitations. First, the single-center retrospective study design prevents us from detecting causal relationships. Second, with the fact that the participants were from one community with unique population characteristics, life style and dietary culture, the extrapolation of our conclusions is limited. But our findings provide an inspiration for the evaluation and application of GLS in MHT-related left ventricular dysfunction. Third, we did not collect information about microalbuminuria which is also a cardiovascular risk factor. In multivariate analysis model, the relationship between GLS and MHT might be more convincing when considering microalbuminuria. Fourth, since the study was retrospective, information about NT-proBNP, high sensitivity C reactive protein and osteoprotegerin that may have an impact on the measurement of GLS were missing. But the LVEF of the study population did not show signs of chronic heart failure, so the impact may be relatively small. Finally, further follow-up studies are needed to explore whether the decrease in GLS in MHT patient group is associated with adverse events.
Conclusion
Based on the relationship between MHT and GLS, in clinical practice, GLS measurement could facilitate diagnosis for suspected MHT patients and could define the extent of left ventricular dysfunction for diagnosed MHT patients.
Abbreviations
MHT, masked hypertension; GLS, global longitudinal strain; NHT, non-hypertension; ROC, receiver-operating characteristic; LVEF, left ventricular ejection fraction; OR, odds ratio; BP, blood pressure; ABPM, ambulatory blood pressure monitoring; LDL-C, low-density lipoprotein cholesterol; LVDd, left ventricular diastolic dimension; IVSd, interventricular septal depth; LVPWd, left ventricular posterior wall depth; LV, left ventricular; LVMI, left ventricular mass index; BSA, body surface area; AUC, area under the curve; GAM, generalized additive models; ICCs, intraclass correlation coefficients; BMI, body mass index; CI, confidence interval.
Acknowledgments
We thank LetPub for language editing assistance.
Funding
Our research was supported by The National Key Research and Development Program of China (No. 2016YFC1301202).
Disclosure
The authors declare that they have no competing interests.
References
1. Williams B, Mancia G, Spiering W, et al. 2018 ESC/ESH Guidelines for the management of arterial hypertension. Eur Heart J. 2018;39(33):3021–3104.
2. Peacock J, Diaz KM, Viera AJ, et al. Unmasking masked hypertension: prevalence, clinical implications, diagnosis, correlates and future directions. J Hum Hypertens. 2014;28:521–528. doi:10.1038/jhh.2014.9
3. Booth JN
4. Zhang DY, Guo QH, An DW, et al. A comparative meta analysis of prospective observational studies on masked hypertension and masked uncontrolled hypertension defined by ambulatory and home blood pressure. J Hypertens. 2019;37:1775–1785.
5. Anstey DE, Pugliese D, Abdalla M, et al. An update on masked hypertension. Curr Hypertens Rep. 2017;19(12):94. doi:10.1007/s11906-017-0792-4
6. Aronow WS. Masked hypertension. Ann Transl Med. 2017;5(23):456. doi:10.21037/atm.2017.09.24
7. Zhou D, Huang Y, Fu M, et al. Prognostic value of tissue Doppler E/e’ ratio in hypertension patients with preserved left ventricular ejection fraction. Clin Exp Hypertens. 2018;40(6):554–559. doi:10.1080/10641963.2017.1407332
8. O’Brien E, Parati G, Stergiou G, et al. European Society of Hypertension Working Group on Blood Pressure Monitoring. European Society of Hypertension position paper on ambulatory blood pressure monitoring. J Hypertens. 2013;31:1731–1768. doi:10.1097/HJH.0b013e328363e964
9. Lang RM, Bierig M, Devereux RB, et al. Recommendations for chamber quantification: a report from the American Society of Echocardiography’s Guidelines and Standards Committee and the Chamber Quantification Writing Group, developed in conjunction with the European Association of Echocardiography, a branch of the European Society of Cardiology. J Am Soc Echocardiogr. 2005;18:1440–1463. doi:10.1016/j.echo.2005.10.005
10. Nagueh SF, Smiseth OA, Appleton CP, et al. Recommendations for the evaluation of left ventricular diastolic function by echocardiography: an update from the American Society of Echocardiography and the European Association of Cardiovascular Imaging. J Am Soc Echocardiogr. 2016;29:277–314. doi:10.1016/j.echo.2016.01.011
11. Lang RM, Badano LP, Mor-Avi V, et al. Recommendations for cardiac chamber quantification by echocardiography in adults: an update from the American Society of Echocardiography and the European Association of Cardiovascular Imaging. J Am Soc Echocardiogr. 2015;28(1):1–39.e14. doi:10.1016/j.echo.2014.10.003
12. Sohn DW, Chai IH, Lee DJ, et al. Assessment of mitral annulus velocity by Doppler tissue imaging in the evaluation of left ventricular diastolic function. J Am Coll Cardiol. 1997;30(2):474–480. doi:10.1016/S0735-1097(97)88335-0
13. Ommen SR, Nishimura RA, Appleton CP, et al. Clinical utility of Doppler echocardiography and tissue Doppler imaging in the estimation of left ventricular filling pressures: a comparative simultaneous Doppler-catheterization study. Circulation. 2000;102(15):1788–1794. doi:10.1161/01.CIR.102.15.1788
14. Soufi Taleb Bendiab N, Meziane-Tani A, Ouabdesselam S, et al. Factors associated with global longitudinal strain decline in hypertensive patients with normal left ventricular ejection fraction. Eur J Prev Cardiol. 2017;24(14):1463–1472. doi:10.1177/2047487317721644
15. Pickering TG, Davidson K, Gerin W, et al. Masked hypertension. Hypertension. 2002;40(6):795–796. doi:10.1161/01.HYP.0000038733.08436.98
16. Cuspidi C, Facchetti R, Quarti-Trevano F, et al. Incident left ventricular hypertrophy in masked hypertension. Hypertension. 2019;74(1):56–62. doi:10.1161/HYPERTENSIONAHA.119.12887
17. Ishizu T, Seo Y, Kameda Y, et al. Left ventricular strain and transmural distribution of structural remodeling in hypertensive heart disease. Hypertension. 2014;63(3):500–506. doi:10.1161/HYPERTENSIONAHA.113.02149
18. Amundsen BH, Helle-Valle T, Edvardsen T, et al. Noninvasive myocardial strain measurement by speckle tracking echocardiography: validation against sonomicrometry and tagged magnetic resonance imaging. J Am Coll Cardiol. 2006;47(4):789–793. doi:10.1016/j.jacc.2005.10.040
19. Marcus KA, Mavinkurve-Groothuis AM, Barends M, et al. Reference values for myocardial two-dimensional strain echocardiography in a healthy pediatric and young adult cohort. J Am Soc Echocardiogr. 2011;24(6):625–636. doi:10.1016/j.echo.2011.01.021
20. Luo XX, Fang F, Lee AP, et al. What can three-dimensional speckle-tracking echocardiography contribute to evaluate global left ventricular systolic performance in patients with heart failure? Int J Cardiol. 2014;172(1):132–137. doi:10.1016/j.ijcard.2013.12.314
21. Marwick TH, Gillebert TC, Aurigemma G, et al. Recommendations on the use of echocardiography in adult hypertension: a report from the European Association of Cardiovascular Imaging (EACVI) and the American Society of Echocardiography (ASE). Eur Heart J Cardiovasc Imaging. 2015;16(6):577–605. doi:10.1093/ehjci/jev076
22. Lee WH, Liu YW, Yang LT, et al. Prognostic value of longitudinal strain of subepicardial myocardium in patients with hypertension. J Hypertens. 2016;34(6):1195–1200. doi:10.1097/HJH.0000000000000903
23. Santos ABS, Foppa M, Bertoluci C, et al. Stage I hypertension is associated with impaired systolic function by strain imaging compared with prehypertension: a report from the prever study. J Clin Hypertens (Greenwich). 2019;21(11):1705–1710. doi:10.1111/jch.13695
24. Shah AM, Claggett B, Sweitzer NK, et al. Prognostic importance of impaired systolic function in heart failure with preserved ejection fraction and the impact of spironolactone. Circulation. 2015;132(5):402–414. doi:10.1161/CIRCULATIONAHA.115.015884
25. Tadic M, Cuspidi C, Vukomanovic V, et al. Does masked hypertension impact left ventricular deformation? J Am Soc Hypertens. 2016;10(9):694–701. doi:10.1016/j.jash.2016.06.032
26. Luo XX, Zhu Y, Sun Y, et al. Does masked hypertension cause early left ventricular impairment in youth? Front Pediatr. 2018;6:167. doi:10.3389/fped.2018.00167
27. Russo C, Jin Z, Elkind MS, et al. Prevalence and prognostic value of subclinical left ventricular systolic dysfunction by global longitudinal strain in a community-based cohort. Eur J Heart Fail. 2014;16(12):1301–1309. doi:10.1002/ejhf.154
28. Cohen JB. Masked hypertension: fragile in more ways than one. Hypertension. 2020;76(4):1079–1080. doi:10.1161/HYPERTENSIONAHA.120.15859
29. Kruzliak P, Berezin A, Kremzer A, et al. Global longitudinal strain and strain rate in type two diabetes patients with chronic heart failure: relevance to osteoprotegerin. Folia Med (Plovdiv). 2016;58(3):164–173. doi:10.1515/folmed-2016-0021
 © 2021 The Author(s). This work is published and licensed by Dove Medical Press Limited. The
full terms of this license are available at https://www.dovepress.com/terms
and incorporate the Creative Commons Attribution
- Non Commercial (unported, 3.0) License.
By accessing the work you hereby accept the Terms. Non-commercial uses of the work are permitted
without any further permission from Dove Medical Press Limited, provided the work is properly
attributed. For permission for commercial use of this work, please see paragraphs 4.2 and 5 of our Terms.
© 2021 The Author(s). This work is published and licensed by Dove Medical Press Limited. The
full terms of this license are available at https://www.dovepress.com/terms
and incorporate the Creative Commons Attribution
- Non Commercial (unported, 3.0) License.
By accessing the work you hereby accept the Terms. Non-commercial uses of the work are permitted
without any further permission from Dove Medical Press Limited, provided the work is properly
attributed. For permission for commercial use of this work, please see paragraphs 4.2 and 5 of our Terms.