
Back to Journals » Diabetes, Metabolic Syndrome and Obesity » Volume 18
Relationship Between Fat-to-Muscle Ratio and Nonalcoholic Fatty Liver Disease in Middle-Aged and Older Adults with Type 2 Diabetes: Cross-Sectional Study
Authors Zhang L, Sun Y, Zhao Y, Wu X, Han X
Received 5 March 2025
Accepted for publication 21 June 2025
Published 30 June 2025 Volume 2025:18 Pages 2067—2076
DOI https://doi.org/10.2147/DMSO.S526335
Checked for plagiarism Yes
Review by Single anonymous peer review
Peer reviewer comments 2
Editor who approved publication: Professor Jae Woong Sull
Lei Zhang,1,2 Yulu Sun,1,2 Yiran Zhao,1,2 Xin Wu,1,2 Xiaofang Han1,2
1Department of Endocrinology, The Second People’s Hospital of Hefei, Hefei Hospital Affiliated to Anhui Medical University, Hefei, Anhui, 230011, People’s Republic of China; 2The Fifth Clinical School of Medicine, Anhui Medical University, Hefei, Anhui, 230032, People’s Republic of China
Correspondence: Xiaofang Han, Email [email protected]
Purpose: The fat-to-muscle mass ratio (FMR) is an innovative metric that integrates fat and muscle constituents. The aim of this study was to examine the efficacy of FMR in predicting non-alcoholic fatty liver disease (NAFLD) in individuals with T2DM.
Methods: This cross-sectional study enrolled 307 hospitalized patients aged 50 years and older with T2DM. NAFLD was identified during ultrasound examination. Fat mass and muscle mass were quantified using dual-energy X-ray absorptiometry (DXA), with FMR calculated as fat mass (kg) divided by muscle mass (kg).
Results: FMR was markedly elevated in the NAFLD patient group compared to the healthy control group (p< 0.001). Sex-specific analysis demonstrated notable sex differences in the diagnostic efficacy of this indicator for fatty liver: the area under the curve (AUC) of the subject’s work characteristics was significantly greater in females compared to males (0.860 vs 0.805), and the optimal threshold was also significantly elevated in females relative to males (0.563 vs 0.363). FMR was established as an independent predictor of fatty liver through multifactorial regression modeling, revealing a risk ratio of 28.171 (95% CI 7.008– 113.248, p< 0.001) in males, while the risk ratio for females was 3.259 (95% CI 1.221– 8.700, p=0.018), indicating higher predictive value in males.
Conclusions: FMR was significantly and independently linked to an increased risk of NAFLD in middle-aged and elderly individuals with T2DM, a discovery that underpins the rationale for enhancing targeted interventions and prognostic management for patients with diabetes mellitus and fatty liver disease.
Keywords: type 2 diabetes mellitus, fat-to-muscle ratio, non-alcoholic fatty liver disease, body composition
Graphical Abstract:

Introduction
Non-alcoholic fatty liver disease (NAFLD), a highly common hepatic condition, impacts more than 30% of the global population.1 The frequency of NAFLD is higher in overweight and obese populations (approximately 40–60%), especially if metabolic health is impaired,2 and the global prevalence of NAFLD is highest in patients with diabetes mellitus (approximately 55–70%).3 Recent reports indicate a reciprocal association between NAFLD and Type 2 diabetes mellitus (T2DM).3,4 T2DM significantly elevates the risk of mortality from end-stage liver disease by 5–14 times due to the combined impacts of metabolic disorders and chronic inflammation, and it also directly facilitates the irreversible progression of hepatic fibrosis to cirrhosis.5 NAFLD adversely influences the incidence of T2DM and its related complications. In a meta-analysis involving 501,022 adults, NAFLD was linked to a two-fold higher risk of type 2 diabetes after controlling for age, sex, obesity metrics, and other traditional metabolic risk variables.6 Therefore, an early-identified NAFLD population, especially in patients with T2DM, is essential to postpone the onset of fatty liver and liver-related progression.
In adults over 60 with T2DM, obesity is not only widespread but also functions as an independent contributor to disease development.7 A primary attribute of NAFLD and a contributing cause to its onset is obesity.8 Sarcopenia has garnered a lot of attention lately, not just in those with T2DM, but also because it is strongly linked to the occurrence and advancement of NAFLD.9 Furthermore, sarcopenic obesity, which is defined as a rise in fat mass and a fall in muscle mass, may raise the risk of insulin resistance (IR). Decreased muscle mass and increased fat mass cause anomalies in glucose oxidation and lipid consumption, which exacerbate IR and mediate the emergence and advancement of NAFLD.10 However, the complex changes in body composition in the T2DM population are challenging for two indicators—skeletal muscle mass and body fat—to properly capture. Combining the two anthropometric measurements, the fat-to-muscle ratio (FMR) has become a cutting-edge substitute for evaluating fat and muscle imbalances.11
In recent years, FMR as an indicator of body composition reflecting the relative proportion of fat to muscle, has been increasingly utilized in the risk assessment of metabolic diseases. Research indicates that FMR is significantly linked to metabolic abnormalities, metabolic syndrome, and insulin resistance in individuals with T2DM,12,13 and has been shown to be an independent predictor of NAFLD.14 However, existing research has primarily focused on the general population or individuals with isolated metabolic abnormalities, while systematic investigations into the relationship between FMR and NAFLD in middle-aged and elderly individuals with T2DM—a high-risk group—remain limited. Therefore, the present study aims to elucidate the association between FMR and NAFLD in middle-aged and elderly patients with T2DM and to determine sex-specific cutoff values to enhance early identification of NAFLD. Moreover, existing studies have suggested that improvements in body composition are associated with the resolution of hepatic steatosis, and FMR may guide clinical interventions.15
Research Design and Methods
Research Participants: This cross-sectional observational study included 307 patients aged 50 years or older with T2DM, all of whom were diagnosed and treated at the Department of Endocrinology at the Second People’s Hospital of Hefei City between December 2023 and October 2024.
Inclusion and Exclusion Criteria
Inclusion criteria: (1) Adherence to the 1999 World Health Organization (WHO) diagnostic guidelines for diabetes mellitus, (2) age ≥50 years, (3) refinement of body composition measurements.
Exclusion criteria: (1) severe heart, brain, and kidney disease and acute complications of diabetes (2) exclusion of chronic medical history such as hyperthyroidism or history of adrenal disease (3) medications that may affect the metabolism of bones or soft tissues, such as anti-osteoporosis medications or medications to control body weight; and (4) exclusion of liver damage due to problems such as large amounts of alcohol, viral infections, medication damage, and autoimmunity.
Anthropometric and Biochemical Indicators
A trained physician physically examined each participant, measuring their waist circumference, height, and weight. Body mass index (BMI) was determined using the formula: BMI = weight (kg) / height² (m²). Measurements were taken by a licensed and trained technician using a whole-body DXA. Data from the DXA includes values for body fat and muscle mass for the entire body and extremities. The FMR was calculated as body fat (kg) divided by muscle mass (kg).
A nurse from the Department of Endocrinology collected venous blood samples from the patients the following morning, after a fasting period of at least 8 hours. Laboratory analyses encompassed quantitative assessments across three physiological domains: (1) glycemic regulation markers including fasting plasma glucose, hemoglobin A1c levels, fasting serum insulin concentrations, and basal C-peptide measurements; (2) hepatic function parameters represented by serum transaminase activities (ALT and AST); (3) lipid metabolic profiles comprising triglyceride levels, total cholesterol concentration, along with lipoprotein subfractions (HDL and LDL cholesterol). The homeostasis model assessment (HOMA) formula is utilized to determine the insulin resistance (IR) index (HOMA2-IR): HOMA2-IR = fasting insulin (µIU/mL) × fasting blood glucose (mmol/L)/22.5. Experienced ophthalmologists and electromyographers conducted fundus examinations and electromyography at our hospital.
Definition of NAFLD
The diagnostic criteria for NAFLD include: (1) enhanced diffuse echoes of the liver in the near field, characterized as a “bright liver”, which are stronger than renal echoes; (2) unclear ductal morphology and structures within the liver; and (3) a tendency for echoes in the liver to diminish in the far field. The diagnosis is established when two of the specified criteria are fulfilled.
Statistical Analysis
Based on the normality test results, continuous baseline characteristics were shown as mean ± standard deviation or median (interquartile range). Categorical variables, on the other hand, were shown as absolute counts and percentages. Differences between groups for normally distributed data were assessed using Student’s t-test, while the Mann–Whitney U-test was utilized for non-normally distributed data. We employed the chi-square test to analyze categorical data. Receiver operating characteristic (ROC) curves were generated to assess the ability of FMR to identify NAFLD, considering the gender differences between men and women. We then used the Youden index maximization principle to find the best FMR threshold. After that, we put the patients into groups based on the FMR thresholds and compared the biochemical and anthropometric parameters within each group. We conducted a Spearman correlation analysis to examine the relationships between FMR and various other variables. We used logistic regression modeling to look into the significant links between FMR (based on threshold division) and NAFLD after taking into account confounding variables such as age, diabetes history, BMI, waist circumference, HbA1c, HOMA2-IR, ALT, AST, high blood pressure, high cholesterol, and cardiovascular disease (CVD). The risk associated with the presence of NAFLD was evaluated using the odds ratio (OR) and its corresponding 95% confidence interval (CI). Statistical analyses were conducted using SPSS software version 25.0 (IBM Corporation, Armonk, NY, USA). Bar graphs were generated using GraphPad Prism V8.0 software (San Diego, CA, USA). Statistical significance was established at a p-value threshold of less than 0.05.
Results
The study included 307 patients with T2DM aged over 50 years, comprising 47.6% (n = 146) men and 52.4% (n = 161) women. Table 1 presents the features of participants categorized by fatty liver status. Patients with NAFLD exhibited a higher likelihood of dyslipidemia and hypertension compared to those without NAFLD, although the prevalence of cardiovascular disease did not differ significantly between the two groups. Patients with NAFLD exhibited increased lipid accumulation, characterized by elevated BMI, PBF, WC, TC, TG, and FBG, and decreased HDL-C levels. Patients with NAFLD exhibit elevated ALT and AST levels, suggesting a degree of liver function impairment. The FMR of NAFLD patients was significantly elevated compared to that of non-NAFLD patients (p < 0.001).
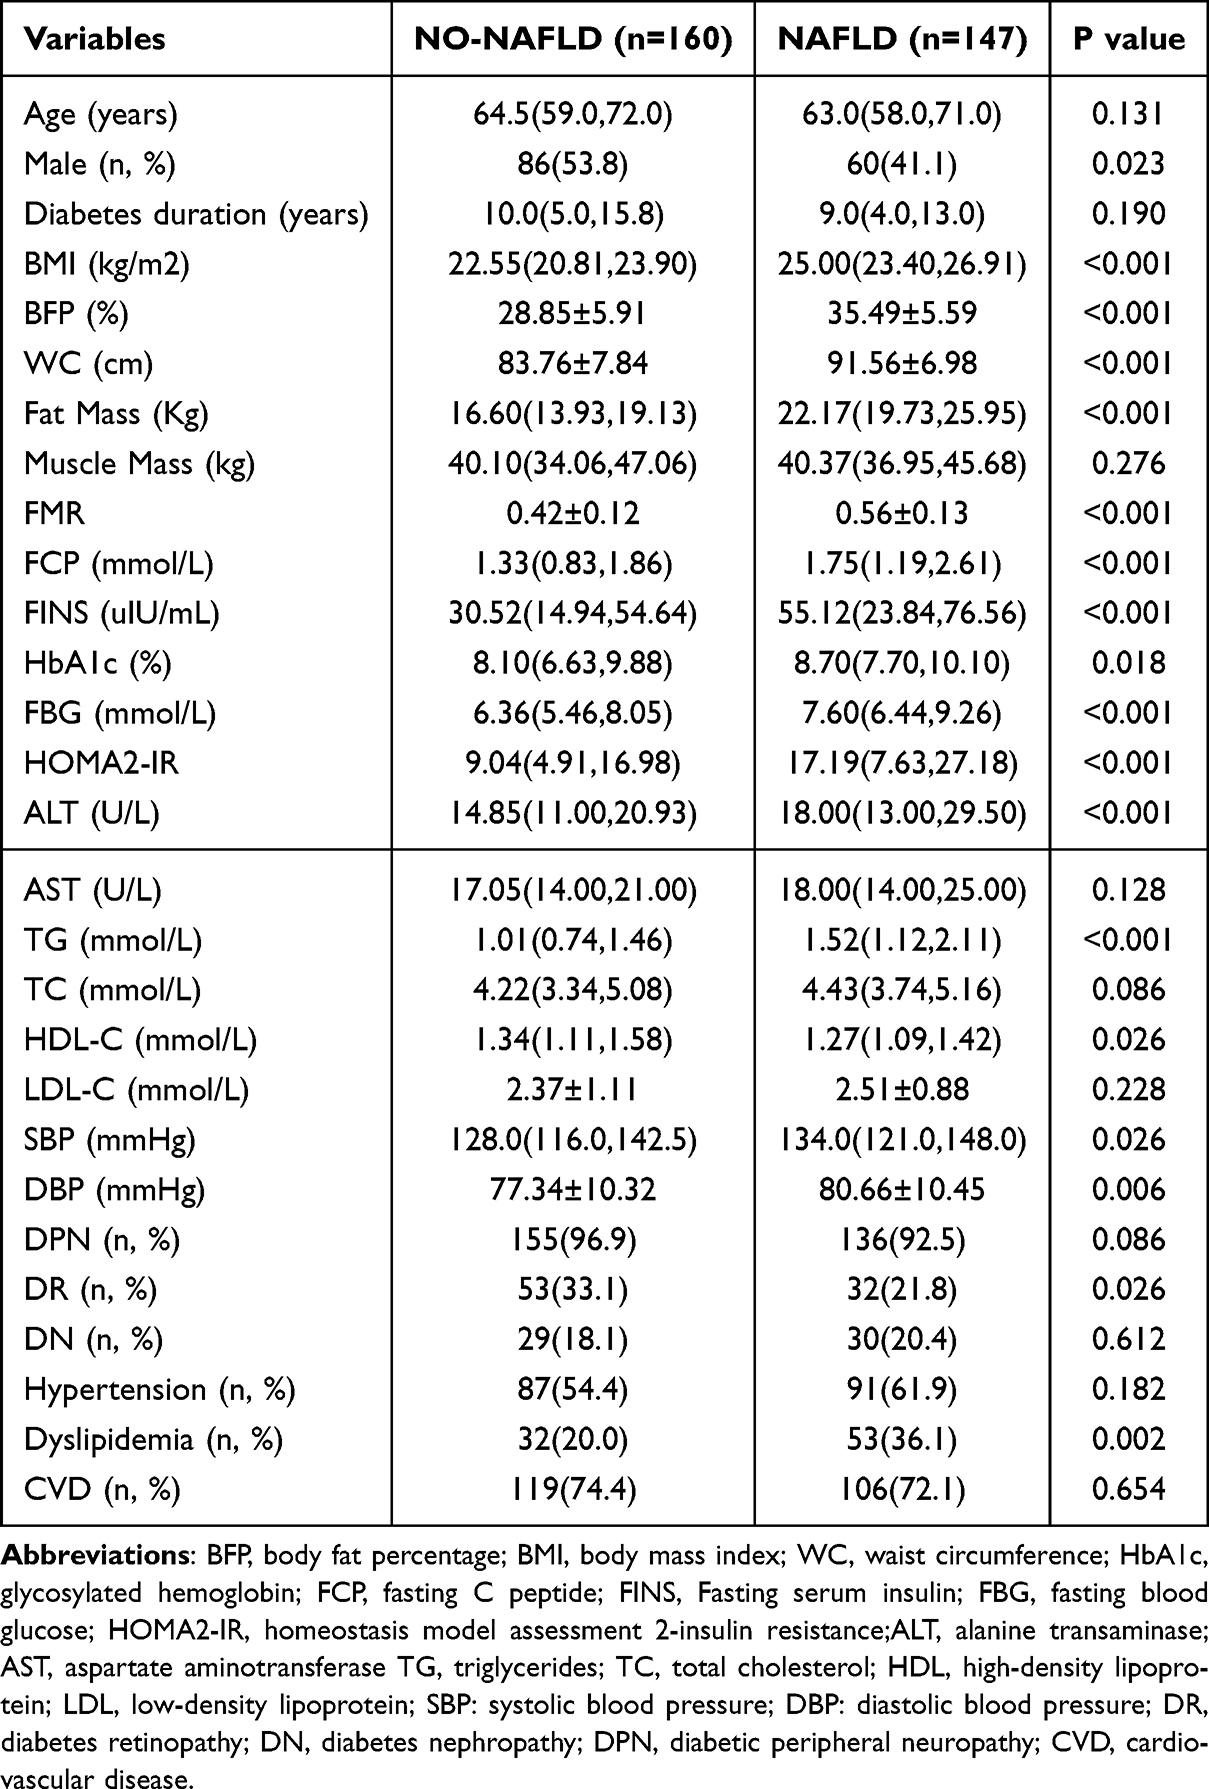 |
Table 1 Baseline Characteristics of Patients with Type 2 Diabetes with or Without NAFLD |
Figure 1 illustrates this point. FMR was markedly elevated in NAFLD compared to non-NAFLD in both sexes (0.445 ± 0.083 vs 0.344 ± 0.082, p < 0.001 for men; 0.646 ± 0.097 vs 0.500 ± 0.091, p < 0.001 for women).
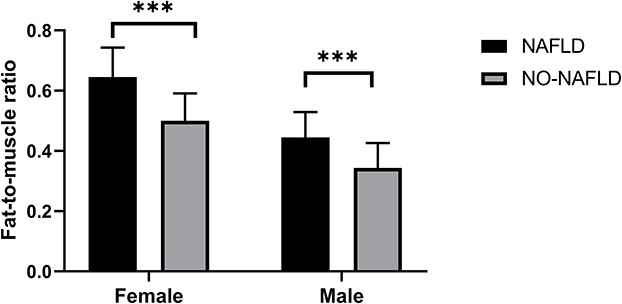 |
Figure 1 Comparison of fat-to-muscle ratio in T2DM patients with and without NAFLD. The symbol “***” represents “statistically significant difference (p < 0.001)”. |
Figure 2 presents the ROC curves for FMR in identifying NAFLD in T2DM, categorized by gender. The optimal cutoff point for FMR, determined by the maximum Yordon index, was greater in females than in males (0.563 vs 0.363). The AUC was 0.860 for women (sensitivity 81.6%, specificity 73.0%) and 0.805 for men (sensitivity 91.7%, specificity 64.0%), with both results being statistically significant (p < 0.001).
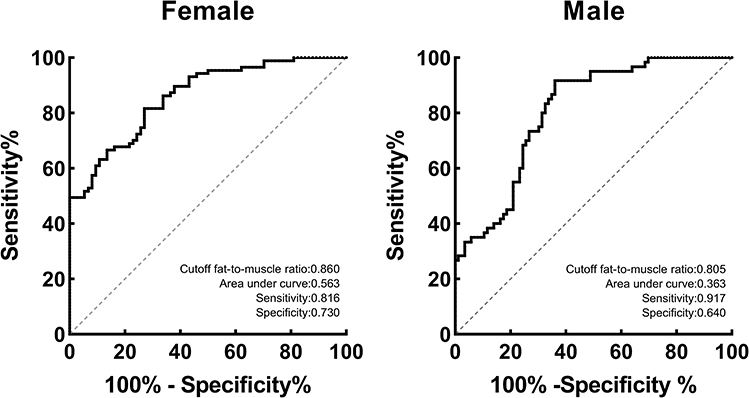 |
Figure 2 Fat-to-muscle ratio predicts ROC curves for NAFLD in men and women. |
The patient population was categorized into high and low FMR groups based on the identified FMR cutoff values. Table 2 provides an overview of the fundamental characteristics of T2DM patients categorized according to sex-specific FMR thresholds. Significant differences were observed in anthropometric parameters, ALT, TG, HDL-C, and HOMA2-IR (all p < 0.05). In contrast, no significant differences were observed in age, gender, muscle mass, AST, TC, and LDL-C (all p > 0.05). A comparative analysis of study participants revealed markedly distinct patterns in hepatic steatosis incidence between different fat-to-muscle ratio cohorts. Among subjects demonstrating elevated FMR values, the occurrence rate of non-alcoholic fatty liver disease reached 71.2% - nearly fourfold higher than the 16.2% prevalence observed in the low FMR population group. Statistical analysis confirmed this substantial disparity between cohorts (p<0.001). The prevalence of hypertension, dyslipidemia, and cardiovascular disease did not exhibit significant differences in the high FMR group (p > 0.05).
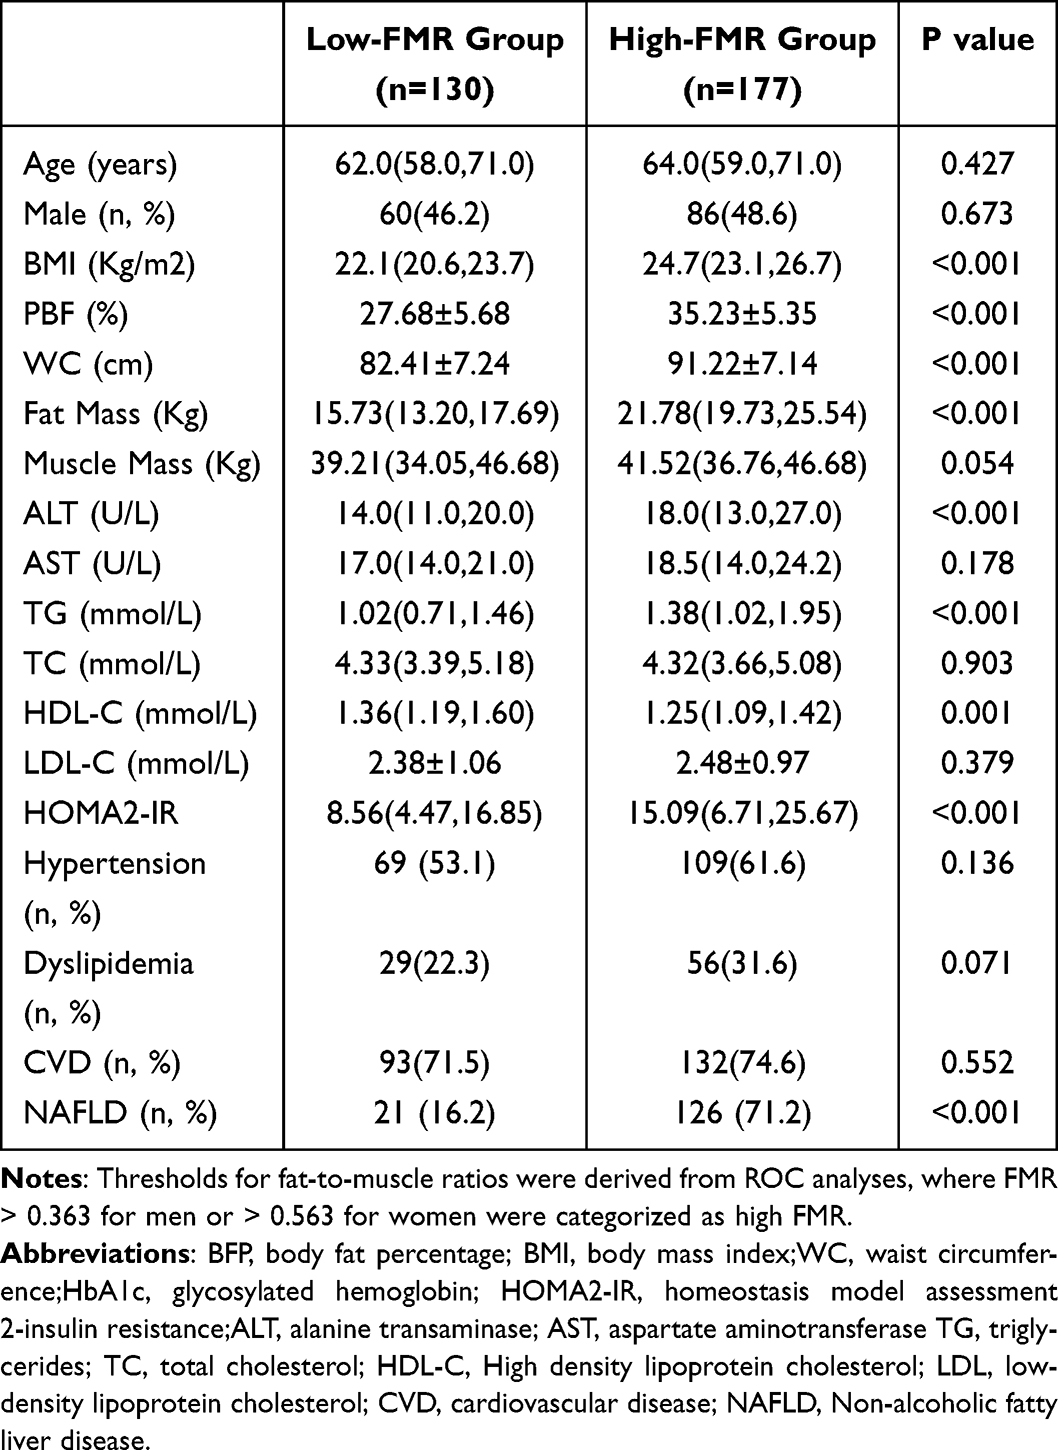 |
Table 2 Baseline Characteristics of Sex-Specific Thresholds According to Adipomuscular Ratio |
Analysis of metabolic parameters by Spearman’s rank correlation test revealed that FMR showed significant positive associations with a number of metabolic indices (p < 0.05). Specifically, variables such as waist size, BMI, TG, and HOMA2-IR showed a strong correlation with FMR. A negative correlation between FMR and HDL-C was observed exclusively in women (r = −0.265, p = 0.001). Furthermore, FMR and HbA1c were not assessed in relation to the duration of diabetes for both men and women (Table 3).
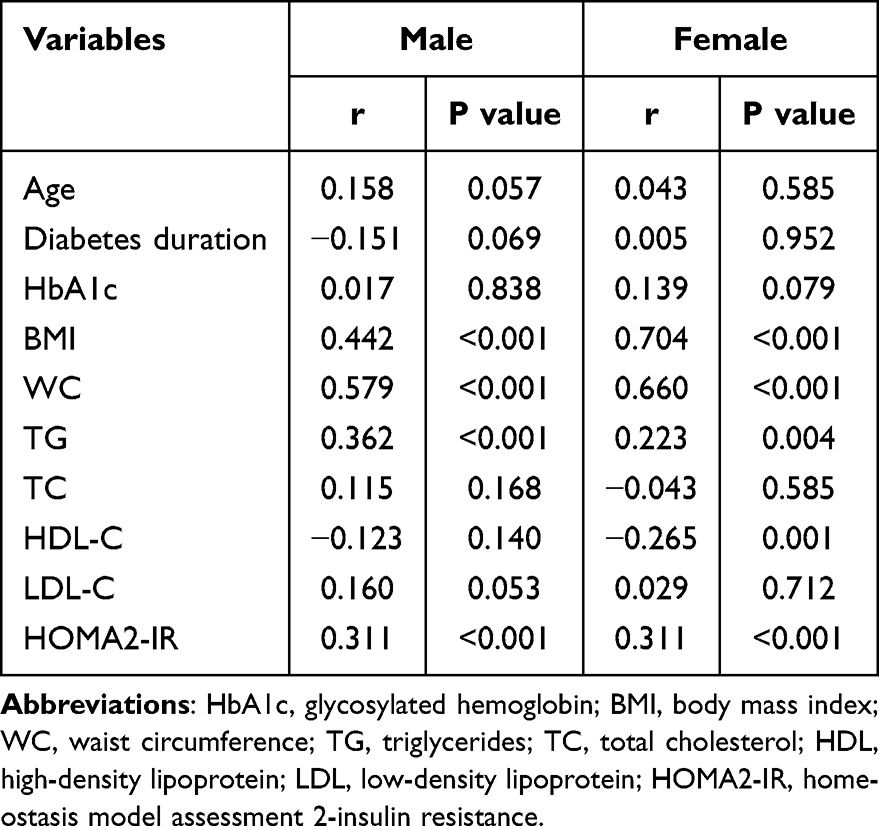 |
Table 3 Correlation Analysis of Fat Mass Ratio with Other Variables |
Table 4 presents the correlation between FMR, determined by cut-off value, and NAFLD in patients with T2DM. In logistic regression analysis, with the low FMR group serving as the reference, the high FMR group was found to have a relative risk for NAFLD of 19.516 (95% CI 7.067–53.897, p < 0.001) in men and 11.981 (95% CI 5.679–25.278, p < 0.001) in women. After adjusting for potential confounders such as age, duration of diabetes, waist circumference, BMI, HbA1c, HOMA2-IR, ALT, and AST, FMR continued to show a significant association with NAFLD. The relative risk of NAFLD was 28.171 (95% CI 7.008–113.248, p < 0.001) for males and 3.259 (95% CI 1.221–8.700, p = 0.018) in model 3 (Table 4).
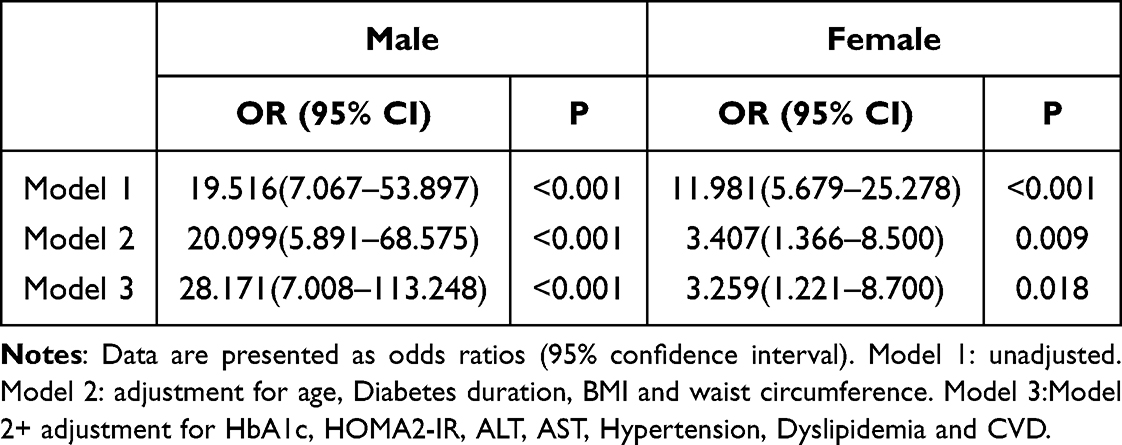 |
Table 4 Association Between Fat to Weight Ratio (by Critical Level) and NAFLD Analyzed by Logistic Regression by Gender |
Discussion
In the present study, the fat-to-muscle ratio (FMR) was significantly higher in the NAFLD group compared to the non-NAFLD group among patients with type 2 diabetes mellitus (T2DM). After adjusting for potential confounding factors, FMR remained independently and positively associated with the presence of NAFLD. Notably, males in the high FMR group had a 28.2-fold higher risk of NAFLD compared to those in the low FMR group, while the corresponding risk in females was 3.3-fold. To the best of our knowledge, this is the first study to investigate the association between FMR and NAFLD specifically in middle-aged and elderly patients with T2DM. The results are consistent with previous studies, indicating that the coexistence of high fat mass and low skeletal muscle mass is positively associated with the development of NAFLD.16,17 This phenomenon has been consistently observed across various Chinese populations. For instance, a study in Chinese patients with T2DM reported that low muscle mass combined with high visceral adiposity was closely linked to a higher prevalence of lean NAFLD.18 Furthermore, another study involving middle-aged and elderly Chinese individuals identified FMR as an independent risk factor for NAFLD.14 In addition, Guo et al concluded that individuals with higher muscle mass and lower fat levels were associated with a reduced risk of NAFLD.19 Several mechanisms may explain the combined impact of increased fat mass and reduced muscle mass on the risk of NAFLD. Skeletal muscle is a primary target tissue for glucose metabolism, accounting for approximately 70% of insulin-mediated glucose uptake.20 A decline in muscle mass can markedly reduce insulin sensitivity, leading to IR,21 and in our study, FMR was positively correlated with HOMA2-IR. In the context of IR, hepatic uptake of free fatty acids (FFA) increases, gluconeogenesis is enhanced, and hepatic lipid accumulation is aggravated. Moreover, excessive expansion of visceral adipose tissue results in the release of large quantities of FFA, which are transported to the liver via the portal vein, contributing to lipotoxicity. Dysfunctional adipose tissue further impairs FFA reutilization, thereby promoting NAFLD progression.22 Meanwhile, reduced muscle mass combined with increased adipose tissue is often accompanied by an imbalance in inflammatory regulation,23 characterized by the upregulation of pro-inflammatory cytokines such as TNF-α and IL-6. This inflammatory milieu can activate Kupffer cells, thereby promoting the progression of NAFLD toward a more inflammatory phenotype.24 Therefore, FMR may be linked to NAFLD in patients with T2DM through mechanisms involving insulin resistance, dysregulated lipid metabolism, and chronic inflammation.
T2DM is often accompanied by increased fat accumulation and reduced muscle mass, a phenotype commonly referred to as sarcopenic obesity.25,26 As an integrated indicator reflecting the relative proportion of adipose tissue and skeletal muscle, FMR has been shown to partially reflect metabolic alterations in body composition. A previous study based on a general hospitalized population identified FMR cutoff values for detecting NAFLD as 0.3244 in males and 0.5583 in females.14 In contrast, our study found higher FMR thresholds for identifying NAFLD in patients with T2DM—0.363 in males and 0.563 in females—suggesting more pronounced body composition abnormalities under diabetic conditions. This finding is consistent with previous reports indicating significant differences in body composition between diabetic and non-diabetic populations.27,28 Moreover, obesity is considered a major risk factor for the development of NAFLD.29 Our study further demonstrated that FMR is positively correlated with both body mass index (BMI) and waist circumference (WC) in T2DM patients. However, BMI is limited in its ability to accurately reflect visceral fat accumulation,30 and WC is subject to variability and lower reproducibility.31 Therefore, this study employed FMR as a more reliable index for body composition assessment to investigate its potential impact on NAFLD.
In the present study, the prevalence of NAFLD among female patients with T2DM) was 59.1%, notably higher than the 40.8% observed in male patients. Moreover, female patients with NAFLD exhibited significantly higher FMR levels compared to their male counterparts. While it is generally believed that NAFLD prevalence is higher in men than in premenopausal women, this sex difference tends to diminish or disappear after menopause.32,33 Given that the study population consisted of middle-aged and elderly individuals, the majority of female participants were likely postmenopausal, which may account for the discrepancy from previously reported findings. Sex-related differences in fat distribution are a key factor influencing the association between FMR and NAFLD. Men are more prone to accumulating visceral fat, whereas women predominantly store subcutaneous fat.34,35 Visceral adipose tissue is metabolically active and releases a greater amount of free fatty acids (FFAs) into the portal circulation, thereby inducing insulin resistance and exacerbating hepatic lipid accumulation.36,37 In addition, estrogen exerts a protective effect on the liver by improving insulin sensitivity through the activation of estrogen receptor alpha (ERα) in insulin-responsive tissues.38 Post-menopause, the reduction in estrogen levels facilitates the migration of adipose tissue to the visceral area, heightening insulin resistance and vulnerability to NAFLD.39
This study demonstrates that FMR is not only an effective indicator for assessing the risk of NAFLD, but also provides a basis for individualized management strategies. Individuals with elevated FMR, typically characterized by predominant fat accumulation, may benefit from energy intake restriction and increased aerobic exercise to reduce fat mass. In contrast, those with low FMR accompanied by reduced muscle mass require interventions focused on resistance training, protein supplementation, and nutritional support to enhance muscle quality.40 FMR-based stratified interventions may help improve metabolic profiles and slow the progression of NAFLD, highlighting the potential clinical utility of FMR in the management of T2DM patients with concurrent NAFLD.
Despite the above findings, several limitations of our study should be acknowledged. First, due to its cross-sectional design, causal relationships between FMR and NAFLD cannot be established. Prospective cohort studies are warranted to validate our results. Second, the subjects of this study are single-center middle-aged and elderly hospitalized patients with T2DM, which may represent patients with more severe metabolic disorders, and the applicability of the results to a wider range or different populations needs to be carefully extrapolated. Third, NAFLD was diagnosed using abdominal ultrasonography, which, although highly specific, has limited sensitivity for detecting mild steatosis and does not provide information on the degree of hepatic fibrosis,41 potentially introducing misclassification bias. Fourth, this study did not further explore the association between FMR and different stages of NAFLD (eg NASH, hepatic fibrosis) due to data limitations, preventing more detailed analysis. Additionally, potential confounding factors such as genetic predisposition and gut microbiota were not included, constrained by the current study design and data availability. Finally, the relatively small sample size may have introduced unavoidable bias. These limitations should be addressed in future research.
Conclusion
In this cross-sectional study, high FMR was significantly associated with the risk of combined NAFLD in middle-aged and elderly T2DM patients, suggesting FMR may be a potential indicator of metabolic imbalance. If further validated, FMR is expected to be used for risk stratification and to provide a reference for individualized lifestyle interventions for people at high risk of T2DM combined with NAFLD.
Statement of Ethics
The study conforms to the principles of the Helsinki Declaration. This research protocol was reviewed and approved by the Clinical Trial Ethics Committee of the Second People’s Hospital of Hefei City, and the approval number was approved. [2024-Research-048]. Written informed consent was obtained from all participants prior to the start of the study.
Acknowledgment
We would like to thank all those who participated in this study.
Author Contributions
All authors made a significant contribution to the work reported, whether that is in the conception, study design, execution, acquisition of data, analysis and interpretation, or in all these areas; took part in drafting, revising or critically reviewing the article; gave final approval of the version to be published; have agreed on the journal to which the article has been submitted; and agree to be accountable for all aspects of the work.
Funding
No funding or sponsorship was received for this study or the publication of this article.
Disclosure
All authors declare no competing interests.
References
1. Han SK, Baik SK, Kim MY. Non-alcoholic fatty liver disease: definition and subtypes. Clin Mol Hepatol. 2023;29(Suppl):S5–S16. doi:10.3350/cmh.2022.0424
2. Stefan N, Schick F, Häring HU. Causes, characteristics, and consequences of metabolically unhealthy normal weight in humans. Cell Metab. 2017;26(2):292–300. doi:10.1016/j.cmet.2017.07.008
3. Muzica CM, Sfarti C, Trifan A, et al. Nonalcoholic fatty liver disease and type 2 diabetes mellitus: a bidirectional relationship. Can J Gastroenterol Hepatol. 2020;2020:6638306. doi:10.1155/2020/6638306
4. Tai FWD, Syn WK, Alazawi W. Practical approach to non-alcoholic fatty liver disease in patients with diabetes. Diabet Med J Br Diabet Assoc. 2015;32(9):1121–1133. doi:10.1111/dme.12725
5. Zoppini G, Fedeli U, Gennaro N, Saugo M, Targher G, Bonora E. Mortality from chronic liver diseases in diabetes. Am J Gastroenterol. 2014;109(7):1020–1025. doi:10.1038/ajg.2014.132
6. Mantovani A, Petracca G, Beatrice G, Tilg H, Byrne CD, Targher G. Non-alcoholic fatty liver disease and risk of incident diabetes mellitus: an updated meta-analysis of 501 022 adult individuals. Gut. 2021;70(5):962–969. doi:10.1136/gutjnl-2020-322572
7. Malone JI, Hansen BC. Does obesity cause type 2 diabetes mellitus (T2DM)? Or is it the opposite? Pediatr Diabetes. 2019;20(1):5–9. doi:10.1111/pedi.12787
8. Patel AH, Peddu D, Amin S, et al. Nonalcoholic fatty liver disease in lean/nonobese and obese individuals: a comprehensive review on prevalence, pathogenesis, clinical outcomes, and treatment. J Clin Transl Hepatol. 2022;11(2):502. doi:10.14218/JCTH.2022.00204
9. Koo BK, Kim D, Joo SK, et al. Sarcopenia is an independent risk factor for non-alcoholic steatohepatitis and significant fibrosis. J Hepatol. 2017;66(1):123–131. doi:10.1016/j.jhep.2016.08.019
10. Hyeon HS, Choi KM. Sarcopenic obesity, insulin resistance, and their implications in cardiovascular and metabolic consequences. Int J Mol Sci. 2020;21(2):494. doi:10.3390/ijms21020494
11. Auyeung TW, Lee JSW, Leung J, Kwok T, Woo J. Adiposity to muscle ratio predicts incident physical limitation in a cohort of 3153 older adults--an alternative measurement of sarcopenia and sarcopenic obesity. Age Dordr Neth. 2013;35(4):1377–1385. doi:10.1007/s11357-012-9423-9
12. Liu D, Zhong J, Ruan Y, Zhang Z, Sun J, Chen H. The association between fat-to-muscle ratio and metabolic disorders in type 2 diabetes. Diabetol Metab Syndr. 2021;13:129. doi:10.1186/s13098-021-00748-y
13. Seo Y, Song HJ, Song YR. Fat‐to‐muscle ratio as a predictor of insulin resistance and metabolic syndrome in Korean adults. J Cachexia Sarcopenia Muscle. 2020;11(3):710–725. doi:10.1002/jcsm.12548
14. Yan F, Nie G, Zhou N, Zhang M, Peng W. Association of fat-to-muscle ratio with non-alcoholic fatty liver disease: a single-centre retrospective study. BMJ Open. 2023;13(10):e072489. doi:10.1136/bmjopen-2023-072489
15. Mátis D, Hegyi P, Teutsch B, et al. Improved body composition decreases the fat content in non-alcoholic fatty liver disease, a meta-analysis and systematic review of longitudinal studies. Front Med. 2023;10:1114836. doi:10.3389/fmed.2023.1114836
16. Song W, Yoo SH, Jang J, et al. Association between sarcopenic obesity status and nonalcoholic fatty liver disease and fibrosis. Gut Liver. 2023;17(1):130–138. doi:10.5009/gnl220041
17. Hsing JC, Nguyen MH, Yang B, et al. Associations between body fat, muscle mass, and nonalcoholic fatty liver disease: a population-based study. Hepatol Commun. 2019;3(8):1061–1072. doi:10.1002/hep4.1392
18. Zhang X, He Z, Si Q, et al. The association of sarcopenia and visceral obesity with lean nonalcoholic fatty liver disease in Chinese patients with type 2 diabetes mellitus. J Diabetes Res. 2022;2022:2229139. doi:10.1155/2022/2229139
19. Xu G, Wu Y, Chen J, Xiang D, Li D. The relationship between muscle mass and fat content in body composition and non-alcoholic fatty liver disease in the Chinese general population: a cross-sectional study. Front Med. 2024;11:1384366. doi:10.3389/fmed.2024.1384366
20. Teng S, Huang P. The effect of type 2 diabetes mellitus and obesity on muscle progenitor cell function. Stem Cell Res Ther. 2019;10:103. doi:10.1186/s13287-019-1186-0
21. Kuchay MS, Martínez-Montoro JI, Kaur P, Fernández-García JC, Ramos-Molina B. Non-alcoholic fatty liver disease-related fibrosis and sarcopenia: an altered liver-muscle crosstalk leading to increased mortality risk. Ageing Res Rev. 2022;80:101696. doi:10.1016/j.arr.2022.101696
22. Rana MN, Neeland IJ. Adipose tissue inflammation and cardiovascular disease: an update. Curr Diab Rep. 2022;22(1):27–37. doi:10.1007/s11892-021-01446-9
23. Shida T, Akiyama K, Oh S, et al. Skeletal muscle mass to visceral fat area ratio is an important determinant affecting hepatic conditions of non-alcoholic fatty liver disease. J Gastroenterol. 2018;53(4):535–547. doi:10.1007/s00535-017-1377-3
24. Cobbina E, Akhlaghi F. Non-alcoholic fatty liver disease (NAFLD) - pathogenesis, classification, and effect on drug metabolizing enzymes and transporters. Drug Metab Rev. 2017;49(2):197–211. doi:10.1080/03602532.2017.1293683
25. Kim JA, Hwang SY, Chung HS, et al. Proportion and characteristics of the subjects with low muscle mass and abdominal obesity among the newly diagnosed and drug-naïve type 2 diabetes mellitus patients. Diabetes Metab J. 2019;43(1):105–113. doi:10.4093/dmj.2018.0036
26. Khadra D, Itani L, Tannir H, Kreidieh D, El Masri D, El Ghoch M. Association between sarcopenic obesity and higher risk of type 2 diabetes in adults: a systematic review and meta-analysis. World J Diabetes. 2019;10(5):311–323. doi:10.4239/wjd.v10.i5.311
27. Pechmann LM, Jonasson TH, Canossa VS, et al. Sarcopenia in type 2 diabetes mellitus: a cross-sectional observational study. Int J Endocrinol. 2020;2020:7841390. doi:10.1155/2020/7841390
28. Park SW, Goodpaster BH, Strotmeyer ES, et al. Accelerated loss of skeletal muscle strength in older adults with type 2 diabetes: the health, aging, and body composition study. Diabetes Care. 2007;30(6):1507–1512. doi:10.2337/dc06-2537
29. Fabbrini E, Sullivan S, Klein S. Obesity and nonalcoholic fatty liver disease: biochemical, metabolic and clinical implications. Hepatol Baltim Md. 2010;51(2):679–689. doi:10.1002/hep.23280
30. Golabi P, Paik JM, Arshad T, Younossi Y, Mishra A, Younossi ZM. Mortality of NAFLD according to the body composition and presence of metabolic abnormalities. Hepatol Commun. 2020;4(8):1136–1148. doi:10.1002/hep4.1534
31. Finelli C, Tarantino G. Is visceral fat reduction necessary to favour metabolic changes in the liver? J Gastrointest Liver Dis JGLD. 2012;21(2):205–208.
32. Ballestri S, Nascimbeni F, Baldelli E, Marrazzo A, Romagnoli D, Lonardo A. NAFLD as a sexual dimorphic disease: role of gender and reproductive status in the development and progression of nonalcoholic fatty liver disease and inherent cardiovascular risk. Adv Ther. 2017;34(6):1291–1326. doi:10.1007/s12325-017-0556-1
33. DiStefano JK. NAFLD and NASH in postmenopausal women: implications for diagnosis and treatment. Endocrinology. 2020;161(10):bqaa134. doi:10.1210/endocr/bqaa134
34. Karastergiou K, Smith SR, Greenberg AS, Fried SK. Sex differences in human adipose tissues – the biology of pear shape. Biol Sex Differ. 2012;3:13. doi:10.1186/2042-6410-3-13
35. Lumish HS, O’Reilly M, Reilly MP. Sex differences in genomic drivers of adipose distribution and related cardiometabolic disorders: opportunities for precision medicine. Arterioscler Thromb Vasc Biol. 2020;40(1):45–60. doi:10.1161/ATVBAHA.119.313154
36. Milić S, Lulić D, Štimac D. Non-alcoholic fatty liver disease and obesity: biochemical, metabolic and clinical presentations. World J Gastroenterol WJG. 2014;20(28):9330–9337. doi:10.3748/wjg.v20.i28.9330
37. Stefan N, Kantartzis K, Häring HU. Causes and metabolic consequences of fatty liver. Endocr Rev. 2008;29(7):939–960. doi:10.1210/er.2008-0009
38. Handgraaf S, Riant E, Fabre A, et al. Prevention of obesity and insulin resistance by estrogens requires ERα activation function-2 (ERαAF-2), whereas ERαAF-1 is dispensable. Diabetes. 2013;62(12):4098–4108. doi:10.2337/db13-0282
39. Tian CY, hui ZW, Lou Y, et al. Sex- and reproductive status-specific relationships between body composition and non-alcoholic fatty liver disease. BMC Gastroenterol. 2023;23:364. doi:10.1186/s12876-023-02997-9
40. McKendry J, Currier BS, Lim C, Mcleod JC, Thomas ACQ, Phillips SM. Nutritional supplements to support resistance exercise in countering the sarcopenia of aging. Nutrients. 2020;12(7):2057. doi:10.3390/nu12072057
41. Esterson YB, Grimaldi GM. Radiologic imaging in nonalcoholic fatty liver disease and nonalcoholic steatohepatitis. Clin Liver Dis. 2018;22(1):93–108. doi:10.1016/j.cld.2017.08.005
 © 2025 The Author(s). This work is published and licensed by Dove Medical Press Limited. The
full terms of this license are available at https://www.dovepress.com/terms
and incorporate the Creative Commons Attribution
- Non Commercial (unported, 4.0) License.
By accessing the work you hereby accept the Terms. Non-commercial uses of the work are permitted
without any further permission from Dove Medical Press Limited, provided the work is properly
attributed. For permission for commercial use of this work, please see paragraphs 4.2 and 5 of our Terms.
© 2025 The Author(s). This work is published and licensed by Dove Medical Press Limited. The
full terms of this license are available at https://www.dovepress.com/terms
and incorporate the Creative Commons Attribution
- Non Commercial (unported, 4.0) License.
By accessing the work you hereby accept the Terms. Non-commercial uses of the work are permitted
without any further permission from Dove Medical Press Limited, provided the work is properly
attributed. For permission for commercial use of this work, please see paragraphs 4.2 and 5 of our Terms.