Back to Journals » Journal of Blood Medicine » Volume 12
Relationship Between Estradiol and Hemostasis Determined Through Thromboelastography Profile in Controlled Ovarian Stimulation Cycles
Authors Permadi W, Ritonga MA ![]() , Bayuaji H
, Bayuaji H ![]() , Helja N
, Helja N ![]() , Khoirunnisa CD
, Khoirunnisa CD ![]() , Djuwantono T
, Djuwantono T
Received 24 November 2020
Accepted for publication 20 April 2021
Published 27 May 2021 Volume 2021:12 Pages 361—368
DOI https://doi.org/10.2147/JBM.S293434
Checked for plagiarism Yes
Review by Single anonymous peer review
Peer reviewer comments 2
Editor who approved publication: Dr Martin H Bluth
Wiryawan Permadi, Mulyanusa Amarullah Ritonga, Hartanto Bayuaji, Niswan Helja, Corina Delarosa Khoirunnisa, Tono Djuwantono
Department of Obstetrics & Gynecology, Dr. Hasan Sadikin Hospital, Faculty of Medicine, Padjadjaran University, Bandung, Indonesia
Correspondence: Mulyanusa Amarullah Ritonga Email [email protected]
Purpose: We aimed to analyze the relationship between estradiol level and thromboelastography profile.
Patients and Methods: This prospective study with comparative analysis was performed on nineteen samples undergoing an IVF procedure in two fertility clinics in Bandung city. Blood samples taken on the second and twelfth days of the IVF cycle.
Results: There were significant differences in the value of estradiol, fibrin formation time (α), and coagulation index (CI) (p< 0.05). Correlation tests showed no relationship and no significant correlation between an increased level of estradiol and coagulation index (CI) (rs=0.054; p=0.827) and between an increased level of estradiol and fibrinolysis time (LY30) (rs=− 0.151; p=0.536). A moderate significant relationship was observed between age and coagulation index (CI) (rs=− 0.430; p=0.033) and between age and maximum amplitude (MA) (rs=− 0.494; p=0.032).
Conclusion: Supraphysiological estradiol levels in controlled ovarian stimulation cycles affect the coagulation index and change mainly the fibrin formation time.
Keywords: estradiol, hemostasis, thromboelastography, controlled ovarian cycles
Introduction
Recent technological advances and cultural conditions have started to cause fertility issues. These issues are increasing in number and have become a persistent problem. To date, the median prevalence of infertility is 9% worldwide, distributed evenly in both developing and developed countries. Statistics have shown recently that there are at least 72.4 million infertile couples and approximately 40.5 million were seeking health care solutions for infertility problems. Infertility’s current definition refers to a condition where couples of reproductive age have not achieved conception after one year of marriage and have regular sexual intercourse without contraception.
Data on Indonesia’s overall number of infertility cases are limited, as there has not been much literature covering this particular subject. The 2010 Basic Health Research Report stated that Indonesia’s infertility cases range from around 5.5 to 5.9%. Out of 67 million couples during their productive age in Indonesia, 10–15% or 8 million couples experienced infertility or had fertility issues that made it difficult for them to have children. According to 2013 Indonesia Statistic data, the prevalence rate of infertility in the country is increasing every year. In 2013, the prevalence rate was 15–25% among all couples.1,2
The increase in infertility is currently associated with the postponement of marriage, an increasing number of male-factor infertility, increasing prevalence of obesity, and sexual infectious diseases.3 Current advances in medical technology, providing a solution for infertility in assisted reproductive technology (ART),4,5 include controlled ovarian stimulation (COS), followed by intrauterine insemination (IUI), or in vitro fertilization (IVF).5,6
Assisted reproductive technology is principally divided into three main stages, namely: 1) controlled ovarian stimulation; 2) trigger ovulation; and 3) fertilization. At the controlled ovarian stimulation stage, many follicles containing oocytes are recruited, and estrogen is increased supraphysiologically. This process was associated with ovarian hyperstimulation syndrome (OHSS).3,7 Recent studies showed that the rapidly increasing plasma levels of estradiol due to the IVF cycle might lead to a procoagubility state in several hemostasis parameters.8–10 These supraphysiological conditions can increase the risk of arterial and venous thrombosis which, if it persists, is associated with venous thromboembolism (VTE), OHSS, implantation failure, or repeated abortion.11,12
Hemostasis was measured by several tests such as clotting time, bleeding time, prothrombin time (PT), and activated partial prothrombin time (aPTT). However, the current test is static and takes a long time; and this may cause a delay in the administration of the next phase of treatment.13 Another weakness of these tests is the fact that they have to be repeated to get a precise result. Although they provide information on platelet counts, they do not accurately describe the platelets’ functional aspects.
Thromboelastography (TEG) is a hemostasis examination technique known since 1948 to assess the global physiology of hemostasis by examining the components of complete blood elasticity. Initially, TEG was used for hemostasis assessment in cases of liver transplants, heart surgery, and obstetric procedures, especially for assessing the volume of blood loss and potential for thrombosis. TEG examination can also be used to determine the type of blood components needed for transfusion in bleeding. The test assesses the fibrin formation time, the strength of clots, and coagulation indices, and the results are obtained in the form of an overview chart. In interpreting TEG examination, experts review whether the patient has hypercoagulability and whether this was associated with fibrinogen or platelet factors.14,15
A study by Harnett et al in 200211 and by Westerlund in 201212 found that on the IVF cycles, there was a tendency toward hypercoagulability on TEG examination, mainly on the decreased time of clot formation. This was an interesting finding in terms of TEG use in ART, since due to its real-time principle, it can detect more quickly and precisely. In this study, we analyzed the relationship and influence of thromboelastography profile and estradiol on IVF cycles.
Materials and Methods
This was a comparative prospective analytic study, observing the changes in coagulation index on the second and twelfth days of short-protocol IVF due to increased levels of estradiol.
This study was conducted on women aged 20–45 years undergoing a short-cycle IVF protocol in the Aster Infertility Clinic of Hasan Sadikin General Hospital Bandung and in Bandung Fertility Centre of Limijati Hospital Bandung between October and December 2014. The inclusion criteria were women aged 20–45 years, who do not smoke, were healthy, able to do daily activities independently, can communicate well and have no prior history of cardiovascular disease, not taking medications that may affect coagulation balance such as vitamin C or vitamin K, salicylic acid, tranexamic acid or mefenamic acid in the last four weeks, and willing to participate in this study after receiving an explanation and signing an informed consent. Subjects may resign or withdraw from the study at any time for any reason. Subjects who stopped undergoing the IVF protocol in the middle of the cycle or subjects with incomplete data were excluded from the study.
After obtaining approval from Hasan Sadikin General Hospital’s ethics committee, the study team recruited nineteen people as subjects who will undergo the short-cycle IVF protocol. Recombinant FSH (Gonal F®, Merck-Serono Laboratories) was used for stimulation protocol, and Cetrorelix (Cetrotide® Merck-Serono Laboratories) was administered on the seventh day of stimulation. Around 4–5 mL of blood samples were taken on the second day of menstruation and put into Vacutainer® with citric acid (Becton Dickinson, Franklin Lakes, NJ, USA) to examine the levels of estradiol. For thromboelastography examination, 1 mL of sample was transferred into a 1% selit vial, and 2.34 mL of samples were then inserted into a TEG® analyzer cup (model 5000; Haemoscope Corp., Niles, IL, USA). In another cup, we inserted 5 μL ReoPro® (Eli lilly, Indianapolis, IN, USA), a platelet glycoprotein IIB/IIIa receptor antagonist. Both cups were then warmed at 37 °C and analyzed.
This study used a 5% significance rate (α = 1.65) and 90% power of test (Z = 1.28). We obtained a sample of nineteen subjects. The variables tested in this study were the levels of estradiol on the second day, and the dependent variables were the level of estradiol on the twelfth day, and the assessment of the TEG result in the form of the R value (time needed for the formation of fibrin), the K value (time needed to maintain the strength of the clot), the α angle (the speed of fibrin formation), MA value (maximum amplitude, a direct function of fibrin bond dynamic component and platelets), coagulation index (CI, a mathematical formula describing hemostasis coagulation), and LY 30 value (the rates of fibrinolysis after MA is reached). Confounding variables include age, basal FSH levels, recombinant FSH dose used, and antral follicle count (AFC).
Before performing statistical tests, numeric data were tested for normality using the Shapiro–Wilk test. Wilcoxon tests were performed to determine differences in estradiol levels and hemostasis between patients. Spearman tests were used to determine the relationship between risk factors and the thromboelastography profile. Results were confirmed statistically significant if the p-value was <0.05.
Results
The baseline characteristics of our nineteen samples can be seen in Table 1, and the complete data description can be seen in Table 2. The age variable shows that the mean age in these data is 33.6 years old, while the median is 33 years old with a range from 28 to 42 years old. The FSH dose variable obtained the mean dose as 202.6 IU, median 225 IU, ranging from 100 to 300 IU. The basal FSH variable mean level is 8.5 IU with median 7.5 IU. The range level is 4.5−16.2 IU, and the antral follicle count variable obtained mean number is 8.2, the median is 8 with range 3–11.
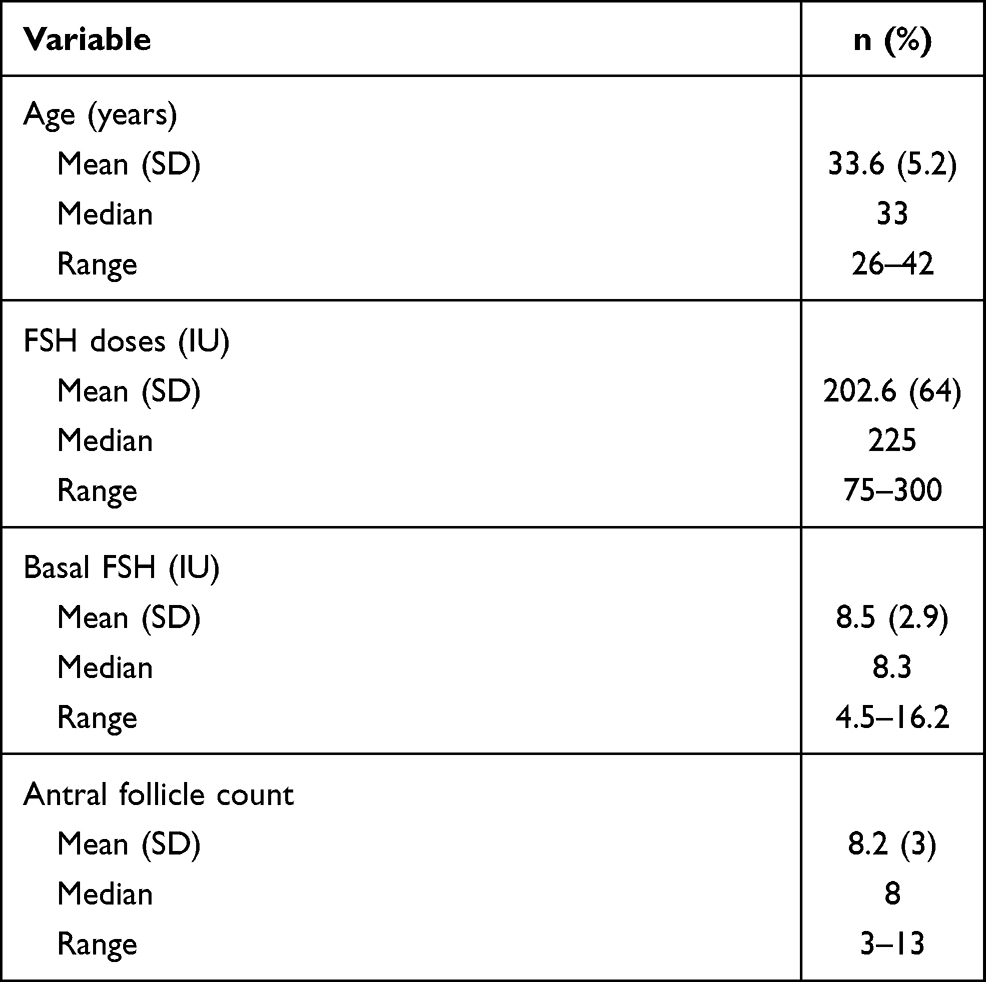 |
Table 1 Characteristic Data |
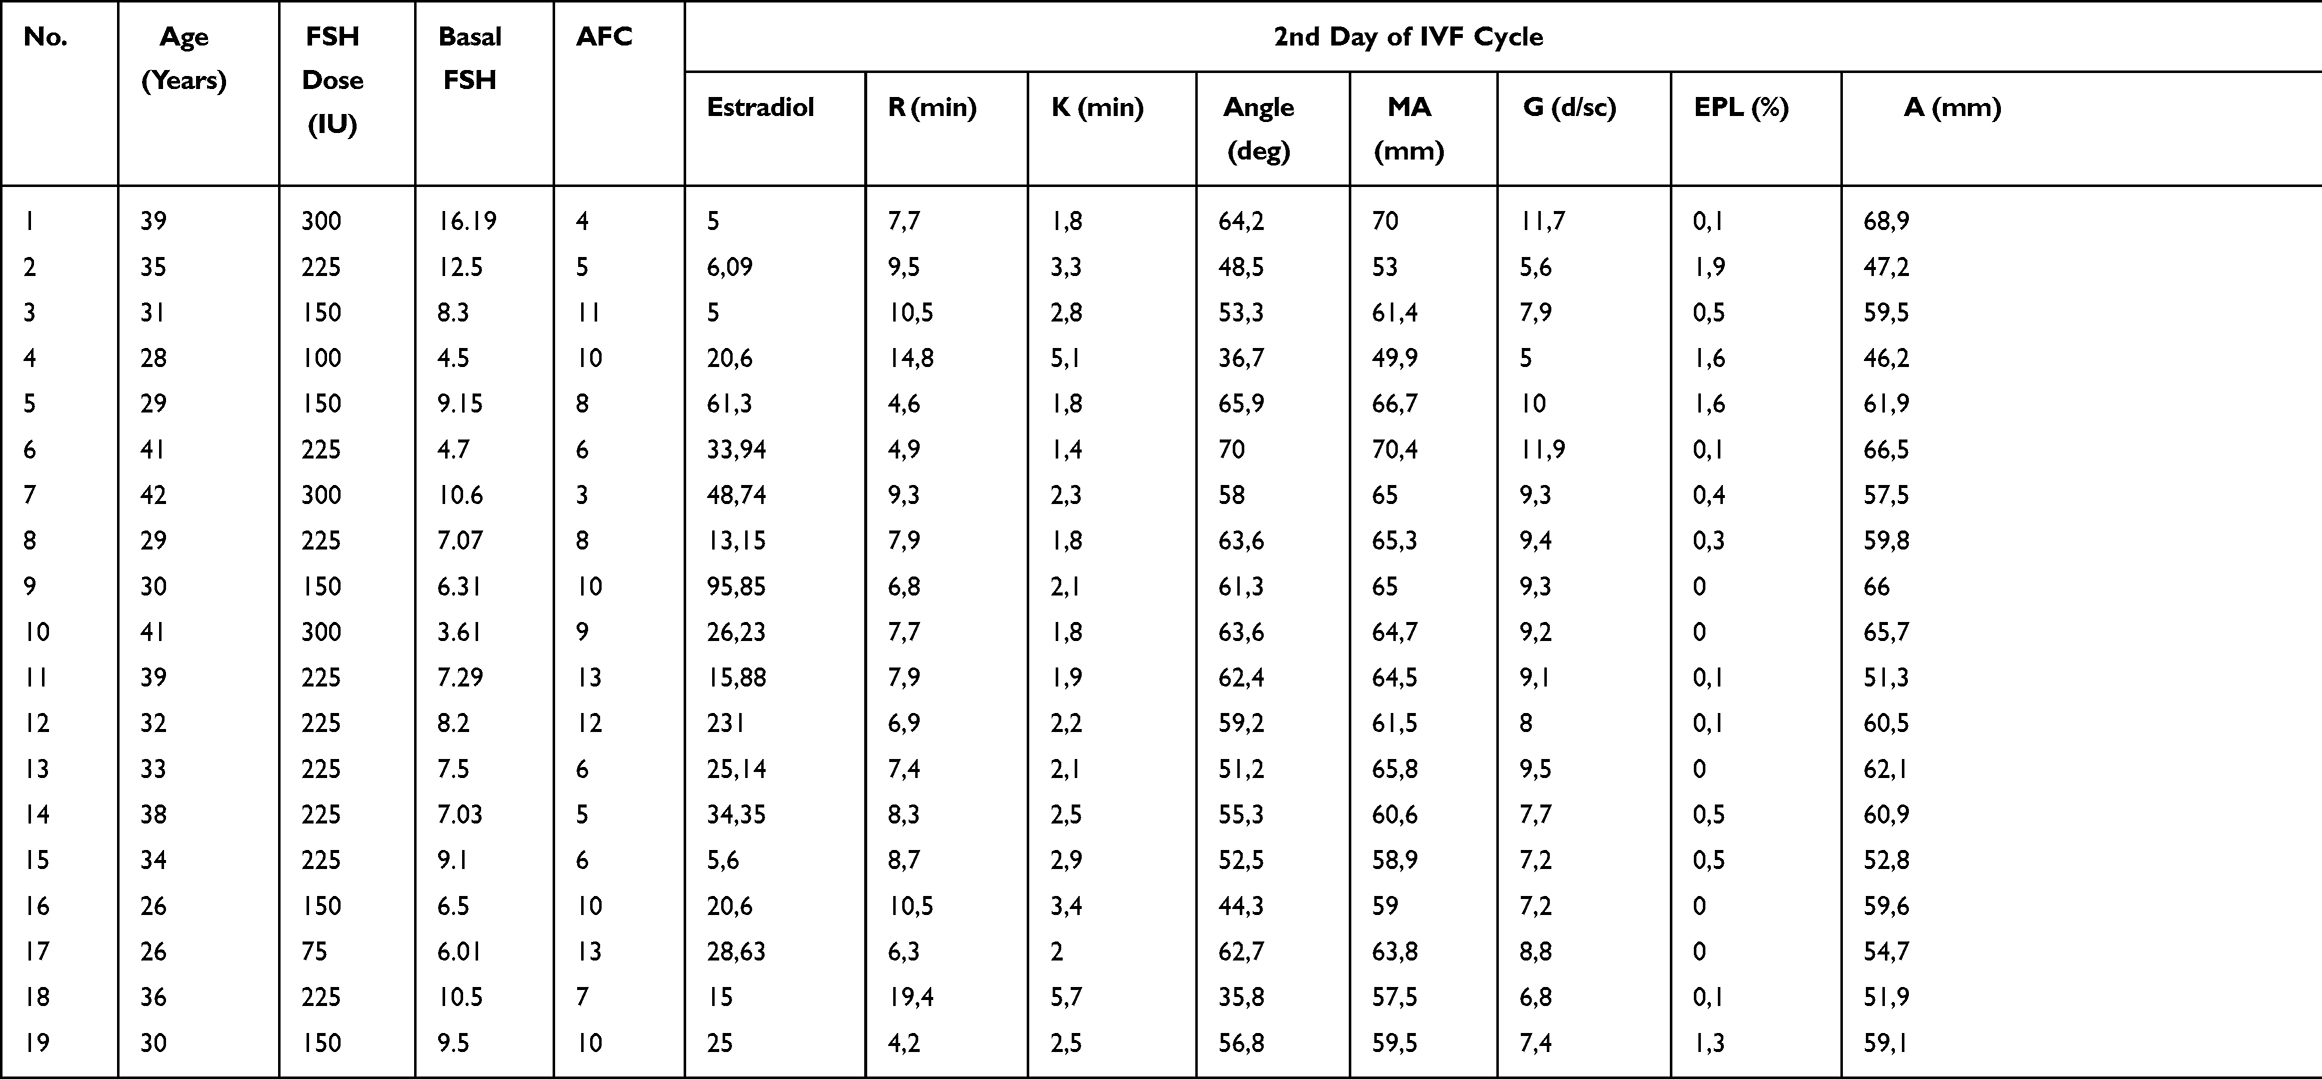 |
Table 2 Original Data Results |
Data obtained from the first and second measurements were calculated for their mean, median, standard deviation, and range. The results are presented in Table 3. Comparison between variables measured in two measurements in Table 3 shows the estradiol variable with a mean value on the second day of IVF cycle is 39.70 pg/mL and the twelfth day of IVF cycle is 2415.99 pg/mL, the median value on the second day of IVF cycle is 25 pg/mL and the twelfth day of IVF cycle is 2239 pg/mL, and range of the second day of IVF cycle is 5–231 pg/mL and the twelfth day of IVF cycle is 120–6290 pg/mL. The P-value in this variable is 0.001, which is statistically significant.
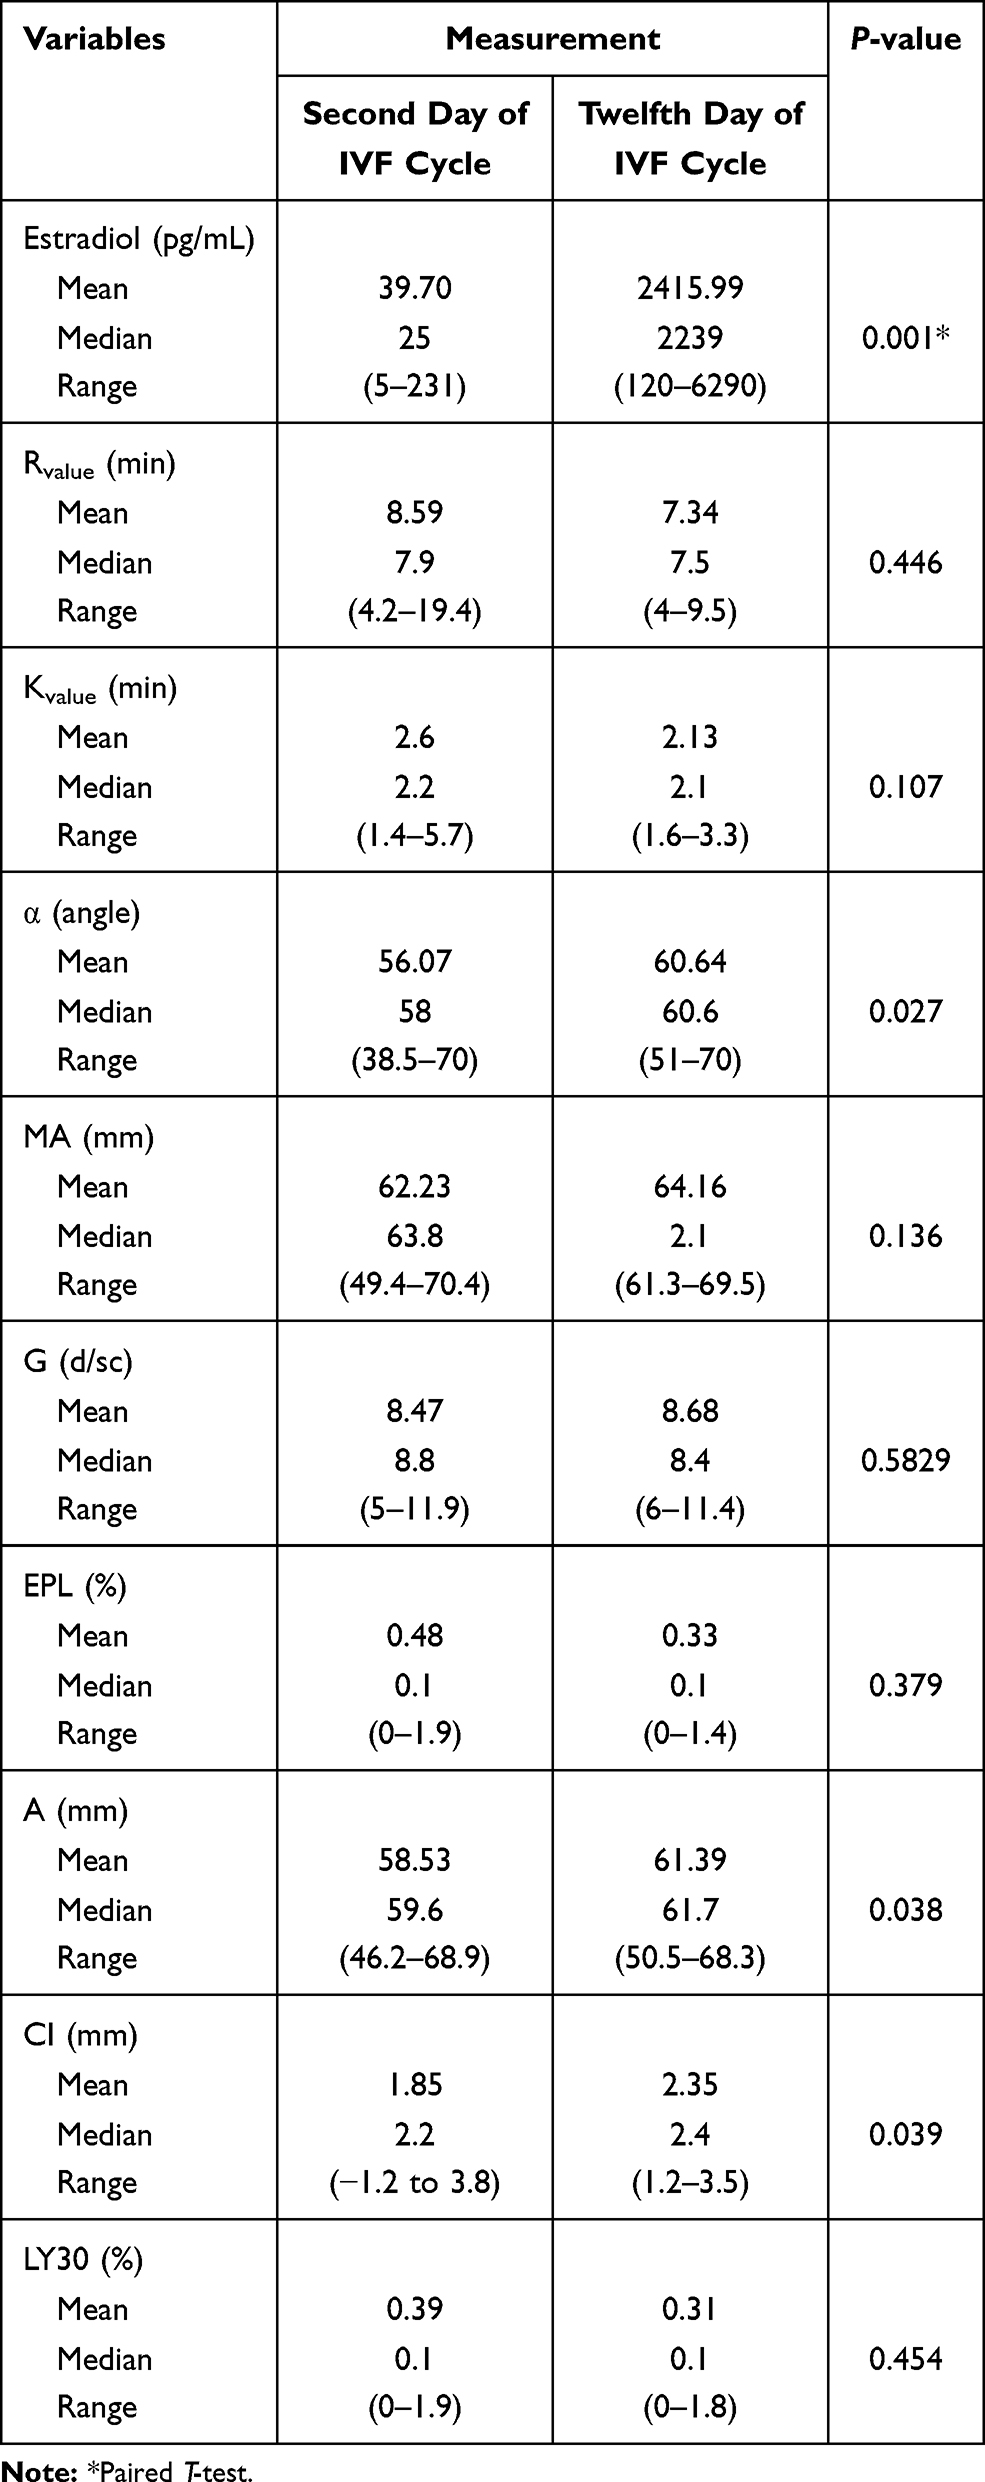 |
Table 3 Comparison Between Variables Measured in Two Measurements |
The Rvalue variable obtained the mean value on the second day of IVF cycle is 8.59 min and on the twelfth day of IVF cycle is 7.34 min, with the median value on the second day of IVF cycle is 7.9 min and on the twelfth day of IVF cycle is 7.5 min, and the range of minutes on the second day of IVF cycle is 4.2–19.4 min and the twelfth day of IVF cycle is 4–9.5 min. The P-value in this variable is 0.446 means no correlation statistically.
The Kvalue variable obtained the mean value on the second day of IVF cycle is 2.6 min and on the twelfth day of IVF cycle is 2.13 min, with the median value on the second day of IVF cycle is 2.2 min and on the twelfth day of IVF cycle is 2.1 min, and the range of the value on the second day of IVF cycle is 1.4–5.7 min and on the twelfth day of IVF cycle is 1.6–3.3 min. The P-value in this variable is 0.107 and not significant statistically.
The angle (α) variable obtained the mean value on the second day of IVF cycle is 56.07 degrees and on the twelfth day of IVF cycle is 60.64 degrees, with the median value on the second day of the IVF cycle is 58 degrees and on the twelfth day of IVF cycle is 60.6 degrees, and the angle range on the second day of IVF cycle is 38.5–70 degrees and on the twelfth day of IVF cycle is 51–70 degrees. The P-value in this variable is 0.027, which is statistically significant.
The MA variable obtained the mean value on the second day of IVF cycle is 62.23 mm and on the twelfth day of IVF cycle is 64.16 mm, with the median value on the second day of IVF cycle is 63.8 mm and the twelfth day of IVF cycle is 63.4 mm. The range on the second day of IVF cycle is 49.4–70.4 mm and on the twelfth day of the IVF cycle is 61.3–69.5 mm. The P-value in this variable is 0.136 showing no statistically significant correlation.
The G variable obtained the mean value on the second day of IVF cycle is 8.47 d/sc and on the twelfth day of IVF cycle is 8.68 d/sc, with the median value on the second day of IVF cycle is 8.8 d/sc and on the twelfth day of IVF cycle is 8.4 d/sc. The range from the second day of IVF cycle is 5–11.9 d/sc and the twelfth day of IVF cycle is 6–11.4 d/sc. The P-value in this variable is 0.589 showing no statistical correlation result.
The EPL variable obtained the mean value on the second day of IVF cycle is 0.48% and on the twelfth day of IVF cycle is 0.33%, with the median value on the second day of IVF cycle is 0.1% and twelfth day of IVF cycle is 0.1%. The range on the second day of the IVF cycle is 0–1.9% and the twelfth day of the IVF cycle is 0–1.4%. The P-value in this variable is 0.379 resulting in no statistical correlation.
The A variable obtained the mean value on the second day of IVF cycle is 58.53 mm and on the twelfth day of IVF cycle is 61.39 mm, with the median value on the second day of IVF cycle is 59.6 mm and the twelfth day of IVF cycle is 61.7 mm. The range on the second day of IVF cycle is 46.2–68.9 mm and on the twelfth day of IVF cycle is 50.5–68.3 mm. The P-value in this variable is 0.038 showing a significant correlation statistically.
The Cl variable obtained the mean value on the second day of IVF cycle is 1.85 mm and on the twelfth day of IVF cycle is 2.35 mm, with the median value on the second day of IVF cycle is 2.2 mm and on the twelfth day of IVF cycle is 2.4 mm. The CI range on the second day of IVF cycle is –1.2 to 3.8 mm and on the twelfth day of IVF cycle is 1.2–3.5 mm. The P-value in this variable is 0.039 showing a significant correlation statistically.
The LY30 variable obtained the mean value on the second day of IVF cycle is 0.39% and on the twelfth day of IVF cycle is 0.31%, with the median value on the second day of IVF cycle is 0.1% and on the twelfth day of IVF cycle is 0.1%, and the range of percentage from the second day of IVF cycle is 0–1.9% and the twelfth day of IVF cycle is 0–1.8%. The P-value in this variable is 0.454 showing no statistical correlation.
Changes in the level of estradiol, fibrin formation time (α), fibrin formation time (Α), and coagulation index (CI) were found to be statistically significant (p<0.05), as seen in Table 4. Correlation between baseline data and the difference among variables measured in Table 4 shows that the correlation value is efficient at the variable age, shows the coagulation index (CI) is −0.430 with a p-value of 0.033, the maximum amplitude (MA) is −0.494 with a p-value of 0.032, the time required for clot formation (R) is 0.152 with a p-value of 0.534, and the fibrin formation time (A) is −0.341 with a p-value of 0.153.
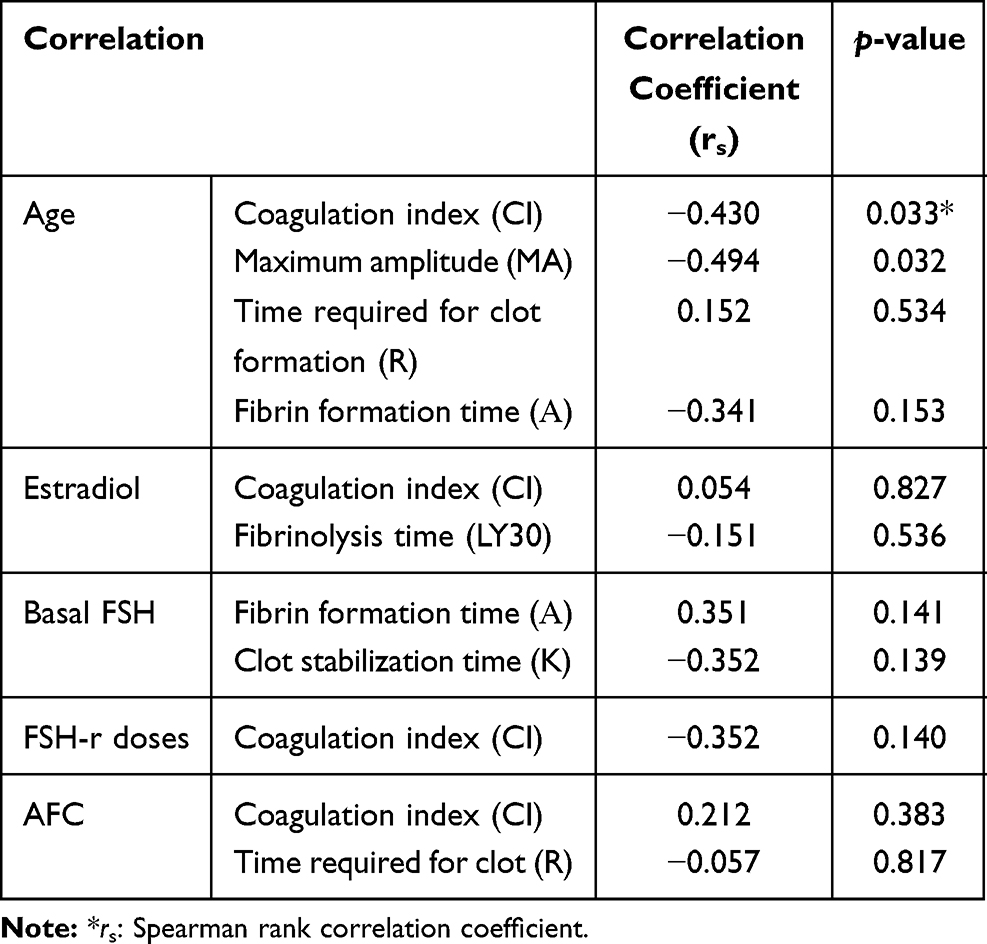 |
Table 4 Correlation Between Baseline Data and the Difference Among Variables Measured |
The correlation coefficient value on the estradiol variable shows the coagulation index (CI) is 0.054 with a p-value of 0.827 and fibrinolysis time (LY30) is −0.151 with a p-value of 0.536. The correlation coefficient value on basal FSH, namely fibrin formation time (A), is 0.351 with zp-value of 0.141, and clot stabilization time (K) is −0.352 with a p-value of 0.139.
The correlation coefficient value on the FSH-r dose variable, namely the coagulation index (CI) is −0.352 with a p-value of 0.140. The correlation coefficient value on the AFC variable, namely the coagulation index (CI) is 0.212 with a p-value of 0.383, and the time required for clot (R) is −0.057 with a p-value of 0.817.
After the correlation test, we performed another statistical analysis using Guilford Criteria to determine the relationship between the two groups and baseline data. We found no relationship and no significant correlation between the changes in the level of estradiol and coagulation index (CI) (rs=0.054; p=0.827) as well as between changes in the level of estradiol and fibrinolysis time (LY30) (rs=−0.151; p=0.536). Medium, statistically significant correlation was found between age and coagulation index (CI) (rs =−0.430; p=0.033) and between age and maximum amplitude (MA) (rs=−0.494; p=0.032).
Discussion
It is common knowledge that estrogen has an impact on coagulation and fibrinolysis, but knowledge and studies on the exact nature of this relationship are limited. Current information on this varies for both intrinsic or extrinsic estrogen.16,17 Many studies linked the use of hormone replacement therapy or contraceptives to coagulation, but not many investigate the effects of estrogen alone on the physiological changes in the reproductive cycle.16
The mechanism with which estrogen affects hematological variables can be studied in the cycle of in vitro fertilization, especially in the controlled ovarian stimulation stage. Although assisted reproductive technique indications through the application of in vitro fertilization vary widely, samples were generally nearly homogeneous in terms of demographics. Unlike hormone replacement therapy and contraceptives, this technique had the advantage of measuring the impacts of changes in the concentration of estrogen and its effect on coagulation and fibrinolysis in the short term.18
The current study found a significant relationship between elevated levels of estradiol and thromboelastography profiles, especially in the fact that the speed of fibrin formation was faster on the second measurement compared to that on the first measurement (second day of stimulation). The hemostasis components cause a significant increase in the coagulation index.
These results were consistent with studies on thromboelastography in the IVF cycle conducted by Harnett et al in 200211 and Westerlund et al in 2013.12 In contrast to the study by Harnett et al11 who found that significant changes occurred in the reduction of clot formation time, we found no significant changes in the fibrin formation time. This might be related to the characteristics of our subjects. Our subjects were younger compared to the subjects in previous studies.11 Age is the most important prognostic factor associated with folliculogenesis, successful pregnancy, and other reproductive functions.19,20 We found in this study that age was inversely related to the levels of intrinsic estradiol and proportionally related to the levels of FSH.
De Graaf follicles (antral follicles) are characterized by the formation of pockets of fluid near the oocyte referred to as the antrum. Granulose cells and theca cells continue to do mitosis along with the increase in antral volume. The growth of antral follicle size is influenced by FSH levels in the blood and is dependent on FSH. Theca cells will express luteinizing hormone (LH) receptors and will start producing androgens, predominantly androstenedione, and these will be aromatized by the granulose cells to produce estradiol. As a consequence of this, the estradiol levels will increase.6,21
This theory is still in line with what was found in this study, where we found a moderate and statistically significant relationship between elevated levels of estradiol and the antral follicle count (AFC). On the other hand, there was a fairly moderate correlation between age and the changes in coagulation index and between age and maximum amplitude (MA). Both age-related findings are statistically significant. This finding may lead to new allegations that age may also have a major impact on measurable changes in coagulation as measured through thromboelastography.
This is in contrast to Harnett et al’s conclusion, which stated that the decrease in clotting time led to the quick formation of clots, while fibrinolysis is not affected.11 Harnett et al’s findings led to the recommendation to use thromboelastography as a modality to detect ovarian hyperstimulation syndrome as indicated by hypercoagulability. This suggested that further study is needed to explore the correlation between thromboelastography measurement and successful pregnancies and implantation rate of the in vitro fertilization cycle.
No previous study mentioned any such hypofibrinolysis as found in this study, although in general, changes in coagulation index were consistently found. Hypofibrinolysis will cause a disruption of the clot dissolution process.22,23 The formation of antibodies against plasminogen activators such as tissue plasminogen activator (tPA) or components such as annexin A2 receptor fibrinolysis will result in major thrombosis, which may have an even greater impact today than ovarian hyperstimulation syndrome. Hypofibrinolysis is often found in antiphospholipid syndrome and is known to be associated with repeated abortion.10,24 Hypofibrinolysis is also usually found in patients with hypothyroidism and alcoholic liver disease.
These findings gave new insights about the physiology of reproductive hemostasis. Limited time to conduct research has been the main problem in this study, and this study was also conducted in a small number of subjects. Similar to previous studies, the difficulty in controlling other factors that potentially interfered withthe assisted reproductive technology also presented as a challenge. These factors include the given regimen, the long duration of pituitary suppression using GnRH analogues, and the individual response as mentioned by Nelson.25
Considering that our findings on the thromboelastography component or hemostasis profiles differ from previous studies, future research may be necessary for successful pregnancies and thromboelastography profile associated with an ideal dose of FSH-r for the success of an assisted reproductive technology program. More extensive research about the thromboelastography component or hemostasis profiles with a large number of subjects is needed.
Conclusion
In conclusion, this study shows significant differences in the change of the estradiol level, the rate of fibrinogen formation, and the coagulation index in controlled ovarian stimulation cycles.
Acknowledgment
The study was supported and conducted with an Internal Grant from Universitas Padjadjaran.
Disclosure
The authors report no conflicts of interest in this work.
References
1. Dasar RK. Badan Penelitian Dan Pengembangan Kesehatan Kementrian Kesehatan Republik Indonesia [Health Research and Development Council, Indonesian Ministry of Health]. National Basic Health Research; 2010. Indonesian.
2. Dasar RK. Badan Penelitian Dan Pengembangan Kesehatan Kementrian Kesehatan Republik Indonesia [Health Research and Development Council, Indonesian Ministry of Health]. National Basic Health Research; 2013. Indonesian.
3. Vloeberghs V, Peeraer K, Pexsters A, D’Hooghe T. Ovarian hyperstimulation syndrome and complications of ART. Best Pract Res Clin Obstet Gynaecol. 2009;23(5):691–709. doi:10.1016/j.bpobgyn.2009.02.006
4. For Women’s, National Collaborating Centre, and U. K. Children’s Health. Fertility: Assessment and Treatment for People with Fertility Problems.
5. Anwar INC. Seleksi pasien menuju fertilisasi in vitro [Patient selection through In Vitro Fertilization]. In: Darmasetiawan MS, Anwar INC, Djuwantono T, Adenin I, Jamaan T, editors. Fertilisasi in vitro Dalam Praktek Klinik [In Vitro Fertilization in Clinical Practice].
6. Balen AH. Infertility in Practice.
7. Balen A. Ovarian hyperstimulation syndrome. Hum Fertil (Camb). 2013;16(3):143. doi:10.3109/14647273.2013.826044
8. Chan WS. The ‘ART’ of thrombosis: a review of arterial and venous thrombosis in assisted reproductive technology. Curr Opin Obstet Gynecol. 2009;21(3):207–218. doi:10.1097/GCO.0b013e328329c2b8
9. Huang JY, Rosenwaks Z. In vitro fertilisation treatment and factors affecting success. Best Pract Res Clin Obstet Gynaecol. 2012;26(6):777–788. doi:10.1016/j.bpobgyn.2012.08.017
10. Bauersachs RM, Manolopoulos K, Hoppe I, Arin MJ, Schleussner E. More on: the ‘ART’ behind the clot: solving the mystery. J Thromb Haemost. 2007;5(2):438–439. doi:10.1111/j.1538-7836.2007.02339.x
11. Harnett MJ, Bhavani-Shankar K, Datta S, Tsen LC. In vitro fertilization-induced alterations in coagulation and fibrinolysis as measured by thromboelastography. Anesth Analg. 2002;95(4):1063–1066. table of contents. doi:10.1097/00000539-200210000-00050
12. Westerlund E, Henriksson P, Wallen H, Hovatta O, Wallberg KR, Antovic A. Detection of a procoagulable state during controlled ovarian hyperstimulation for in vitro fertilization with global assays of haemostasis. Thromb Res. 2012;130(4):649–653. doi:10.1016/j.thromres.2011.11.024
13. Thakur M, Ahmed AB, Gaur A. A review of thromboelastography. Int J Periop Ultrasound Appl Technol. 2012;1(1):25–29. doi:10.5005/jp-journals-10027-1006
14. Bolliger D, Seeberger MD, Tanaka KA. Principles and practice of thromboelastography in clinical coagulation management and transfusion practice. Transfus Med Rev. 2012;26(1):1–13. doi:10.1016/j.tmrv.2011.07.005
15. Chen A, Teruya J. Global hemostasis testing thromboelastography: old technology, new applications. Clin Lab Med. 2009;29(2):391–407. doi:10.1016/j.cll.2009.04.003
16. Cui J, Shen Y, Li R. Estrogen synthesis and signaling pathways during aging: from periphery to brain. Trends Mol Med. 2013;19(3):197–209. doi:10.1016/j.molmed.2012.12.007
17. Sahin M. Estrogen effects on platelets. In: Bartos JR, editor. Estrogen: Production, Function and Applications.
18. Brummel-Ziedins KE, Gissel M, Francis C, Queenan J, Mann KG. The effect of high circulating estradiol levels on thrombin generation during in vitro fertilization. Thromb Res. 2009;124(4):505–507. doi:10.1016/j.thromres.2009.02.006
19. Arnal JF, Gourdy P, Lenfant F. In vivo dissection of the estrogen receptor alpha: uncoupling of its physiological effects and medical perspectives. Ann Endocrinol (Paris). 2013;74(2):82–89. doi:10.1016/j.ando.2013.03.001
20. Barrett-Connor E, Laughlin GA. Endogenous and exogenous estrogen, cognitive function, and dementia in postmenopausal women: evidence from epidemiologic studies and clinical trials. Semin Reprod Med. 2009;27(3):275–282. doi:10.1055/s-0029-1216280
21. Fritz M, Speroff L. Clinical Gynecologic Endocrinology and Infertility.
22. Chapin JC, Hajjar KA. Fibrinolysis and the control of blood coagulation. Blood Rev. 2014;29(1):17–24. doi:10.1016/j.blre.2014.09.003
23. Wright JG, Cooper P, Astedt B, et al. Fibrinolysis during normal human pregnancy: complex inter-relationships between plasma levels of tissue plasminogen activator and inhibitors and the euglobulin clot lysis time. Br J Haematol. 1988;69(2):253–258. doi:10.1111/j.1365-2141.1988.tb07630.x
24. Gardiner C, Hills J, Machin SJ, Cohen H. Diagnosis of antiphospholipid syndrome in routine clinical practice. Lupus. 2013;22(1):18–25. doi:10.1177/0961203312460722
25. Nelson SM. Prophylaxis of VTE in women - during assisted reproductive techniques. Thromb Res. 2009;123(Suppl 3):S8–S15. doi:10.1016/S0049-3848(09)70127-6
 © 2021 The Author(s). This work is published and licensed by Dove Medical Press Limited. The
full terms of this license are available at https://www.dovepress.com/terms
and incorporate the Creative Commons Attribution
- Non Commercial (unported, 3.0) License.
By accessing the work you hereby accept the Terms. Non-commercial uses of the work are permitted
without any further permission from Dove Medical Press Limited, provided the work is properly
attributed. For permission for commercial use of this work, please see paragraphs 4.2 and 5 of our Terms.
© 2021 The Author(s). This work is published and licensed by Dove Medical Press Limited. The
full terms of this license are available at https://www.dovepress.com/terms
and incorporate the Creative Commons Attribution
- Non Commercial (unported, 3.0) License.
By accessing the work you hereby accept the Terms. Non-commercial uses of the work are permitted
without any further permission from Dove Medical Press Limited, provided the work is properly
attributed. For permission for commercial use of this work, please see paragraphs 4.2 and 5 of our Terms.