Back to Journals » Journal of Multidisciplinary Healthcare » Volume 18
Relationship Between Cardiometabolic Index and Post-PCI Coronary Microvascular Dysfunction in Acute STEMI Patients
Authors Sha X, Wang W, Wang J, Wang R
Received 5 July 2025
Accepted for publication 3 September 2025
Published 6 September 2025 Volume 2025:18 Pages 5591—5602
DOI https://doi.org/10.2147/JMDH.S549547
Checked for plagiarism Yes
Review by Single anonymous peer review
Peer reviewer comments 2
Editor who approved publication: Dr David C. Mohr
Xiang Sha, Wei Wang, Jian Wang, Ruzhu Wang
Department of Cardiology, The Affiliated Taizhou People’s Hospital of Nanjing Medical University, Taizhou School of Clinical Medicine, Nanjing Medical University, Taizhou, 225300, People’s Republic of China
Correspondence: Ruzhu Wang, Email [email protected]
Background: Coronary microvascular dysfunction (CMD) significantly impacts outcomes in patients with acute ST-segment elevation myocardial infarction (STEMI) undergoing percutaneous coronary intervention (PCI). The cardiometabolic index (CMI), an indicator combining lipid and anthropometric parameters, has been linked to cardiovascular risk, but its association with CMD remains unclear. This study aims to investigate the relationship between CMI and the occurrence of CMD following PCI in STEMI patients and to assess its predictive value using Least Absolute Shrinkage and Selection Operator (LASSO)-based feature selection and multiple machine learning algorithms.
Methods: This retrospective cohort study enrolled STEMI patients who underwent primary PCI with stent implantation and post-procedural coronary microvascular function assessment between January 2021 and December 2024. Patients were categorized into CMD and non-CMD groups based on noninvasive microvascular resistance indices. Logistic regression, restricted cubic spline analysis, and machine learning models (Random Forest (RF), LightGBM, XGboost and K-Nearest Neighbors) were employed to evaluate the predictive value of CMI for post-PCI CMD.
Results: A total of 702 STEMI patients were included, and CMD was observed in 52.1% of patients. Compared to the first CMI tertile (T1) group, T2 and T3 group had increased odds of CMD (T2: adjusted odds ratio (aOR) 2.41, 95% confidence interval (CI) 1.60– 3.63; T3: aOR 3.40, 95% CI 2.17– 5.32). There was a non-linear relationship between CMI and CMD (P < 0.001). The area under the curve (AUC) for CMI predicting CMD was 0.627 (95% CI: 0.586– 0.666). Seven variables were screened by LASSO-Logistic regression for model development. Comparing four models’ performances, the RF model achieved the best performance (AUC = 0.772). SHapley analysis revealed that CMI had the highest predictive value for CMD.
Conclusion: A higher CMI level is an independent risk factor for CMD of STEMI patients after PCI, and its predictive value enhanced when integrated into RF model.
Keywords: cardiacmetabolic index, acute st elevation myocardial infarction, percutaneous coronary intervention therapy, quantitative blood flow fraction
Introduction
Primary percutaneous coronary intervention (PCI) is the preferred approach for reperfusion in patients experiencing ST-segment elevation myocardial infarction (STEMI). It can rapidly restore the blood flow of the culprit coronary artery and significantly reduce the early mortality rate.1 However, in some patients, the perfusion of the distal coronary microvasculature does not completely restore, even after successful reperfusion of the epicardial coronary arteries, leading to coronary microvascular dysfunction (CMD). The mechanisms underlying CMD include microembolism, ischemia-reperfusion injury, and endothelial dysfunction.2,3 It has been shown that CMD can lead to poor myocardial perfusion, increasing the risk of major adverse cardiovascular events (MACE).4 Therefore, early identification and intervention of high-risk CMD patients are essential for optimizing STEMI management.
Microcirculatory Resistance Index (IMR) remains the gold standard for assessing CMD. With the continuous development of functional research methods in coronary imaging, angiography-based index of microcirculatory resistance (AMR) has emerged as a novel noninvasive method to assess CMD.5 This technique utilizes quantitative flow ratio (QFR) analysis, integrating distal coronary pressure and 3D flow velocity.6 Multiple meta-analyses have shown a high correlation between AMR and IMR, with very high diagnostic efficacy.7,8
The cardiometabolic index (CMI) integrates the triglyceride/high-density lipoprotein cholesterol ratio (TG/HDL-c) and the waist circumference-to-height ratio (WHtR), allowing for the quantification of lipid metabolism and visceral adiposity.9 Critically, excess visceral fat and disorder of lipid metabolism are known to be associated with inflammation, endothelial dysfunction and oxidative stress, all of which contribute to increased microvascular resistance, thus leading to CMD.10 While CMI robustly predicts chronic metabolic diseases such as hypertension, diabetes and stroke,11 its relationship with post-PCI CMD in STEMI patients has never been investigated. Therefore, this first study retrospectively analyzes the clinical data of STEMI patients undergoing PCI with stent implantation, aiming to investigate the relationship between CMI and post-PCI CMD, and further establish a risk prediction model for early identification of high-risk patients.
Materials and Methods
Study Population
This study was a single-center retrospective study. Patients diagnosed with acute STEMI at Taizhou People’s Hospital, affiliated with Nanjing Medical University, between January 2021 and December 2024 were consecutively enrolled. All patients successfully underwent successful primary PCI with stent implantation. A detailed flow diagram of the patient selection is shown in Figure 1. Exclusion criteria were as follows: (1) Patients with malignant tumors or severe liver or kidney dysfunction; (2) Patients with prior coronary artery bypass graft (CABG); (3) Patients with unstable hemodynamic status or under mechanical hemodynamic support; (4) Unable to perform QFR analysis due to imaging reasons.
 |
Figure 1 Flow diagram of the patient selection. |
This study was approved by the Medical Ethics Committee of Taizhou People’s Hospital, affiliated with Nanjing Medical University (ethical approval number: LSKY 2025–076-01). Given the retrospective nature of the study, the requirement for informed consent was waived. This study complies with the Declaration of Helsinki.
Clinical Data Collection
Demographic data and laboratory test results of all patients were obtained prior to PCI during the initial hospitalization assessment. Operative conditions were collected from medical records. Demographic data included age, sex, body mass index (BMI), waist circumference, height, weight, history of hypertension, diabetes mellitus, atrial fibrillation (AF), and smoking status. Laboratory test results included hemoglobin, platelet count, C-reactive protein (CRP), total cholesterol (TC), triglycerides (TG), high-density lipoprotein cholesterol (HDL-c), low-density lipoprotein cholesterol (LDL-c), lipoprotein(a), glycated hemoglobin A1c (HbA1c), blood urea nitrogen (BUN), cardiac troponin I (cTnI) and N-terminal pro-B-type natriuretic peptide (NT-proBNP). Operative conditions included symptom-to-balloon time, triple-vessel lesion, culprit vessels, high pressure balloon dilatation and thrombus aspiration. CMI = (TG/HDL-c) × (waist circumference/height). All patients were categorized into three groups according to the tertiles of CMI.
Definition
STEMI was defined according to ACC/AHA/ACEP/NAEMSP/SCAI guideline.12 CMD was defined as AMR greater than 2.5mmHg·s/cm.13
PCI and AMR Measurement
All patients received dual antiplatelet therapy with 300 mg aspirin combined with 180 mg ticagrelor before primary PCI. All patients received systemic anticoagulation with 80–100 U/kg heparin after vascular access. Pretreatment for the culprit vessel with high thrombus burden was performed before coronary stent implantation, including thrombus aspiration and/or glycoprotein IIb/IIIa inhibitor infusion treatment at their discretion. The patient’s angiographic images were collected and analyzed through the interventional catheterization room storage system. AMR measurements relied on angiographic sequences obtained during the immediate post-PCI period. AMR was measured using AngioPlus Core software (version 2.0, Shanghai Pulse Medical Technology Co., Ltd). The specific measurement process was as follows: (1) The angiographic image with optimal quality was selected from available projection views; (2) The system automatically identified the contrast agent filling process, calculated individualized blood flow velocity, and designated the frame with optimal contrast filling, minimal vessel overlap, and least shortening as the key frame. Typically, at least 2 orthogonal views are analyzed to ensure comprehensive coverage of the vessel. Additionally, the angiographic frame rate is required to be at least 15–30 frames per second; (3) The system automatically identified the target vessel centerline, delineated the vessel contour, and located proximal/distal reference lumens, with manual corrections performed when necessary; (4) Based on Murray’s branching model and an optimized fluid dynamics algorithm, the AMR value was automatically calculated.
Data Analysis
Based on our preliminary pre-experiments, we conservatively estimated that the mean difference in CMI index between the two groups was 0.1, with a standard deviation of 0.3. The sample size was calculated using PASS 15 software. When α was set to 0.05 and the power was set to 0.9, at least 190 patients were required in each group. Therefore, the sample size finally included in this study can provide sufficient statistical power.
Patients were stratified into two groups based on the presence or absence of CMD. Continuous variables were assessed for normality using the Shapiro–Wilk test. Variables with normal distributions were expressed as mean ± standard deviation and compared using independent t-tests or one-way ANOVA, while non-normally distributed variables were reported as median (interquartile range) and compared via Mann–Whitney U-tests. Categorical variables were described as frequencies (percentages), with intergroup differences evaluated using chi-square or Fisher’s exact tests.
The CMI was categorized into tertiles: T1 (low), T2 (intermediate), and T3 (high). Multivariable logistic regression was employed to assess the relationship between CMI tertiles and CMD, with adjustments for confounding factors. Model 1 was adjusted for baseline variables showing significant intergroup differences (P < 0.05). Model 2 was further adjusted for clinically relevant covariates (eg, age, sex, BMI, waist circumference, height, weight, hypertension, diabetes, smoking status, culprit vessels, triple-vessel lesion, thrombus aspiration, hemoglobin, CRP, TC, TG, HDL-c, LDL-c, lipoprotein(a), HbA 1c, cTnI, NT-proBNP, symptom-to-balloon time, platelet, BUN, high pressure balloon dilatation and AF). Results were expressed as odds ratios (ORs) with 95% confidence intervals (CIs). Restricted cubic spline (RCS) regression with three knots was applied to evaluate potential nonlinear associations between CMI and CMD.
CMD prediction models were developed and validated via standard procedures. At first, Least Absolute Shrinkage and Selection Operator (LASSO) logistic regression was implemented for variable selection. The regularization parameter (λ) was optimized through 10-fold stratified cross-validation (repeated three times), selecting the λ value corresponding to the minimum cross-validated deviance. Variables with non-zero coefficients were retained for model construction. Four machine learning algorithms were trained using the selected predictors. Random Forest (RF) model comprised 500 decision trees utilizing the Gini impurity criterion for node splitting, with maximum tree depth systematically optimized through grid search across depths ranging from 3 to 10. K-Nearest Neighbors (KNN) adopted the Euclidean distance metric, where the optimal number of neighbors (K) was determined via 5-fold cross-validation, evaluating candidate values between 3 and 15. XGBoost was configured with a learning rate of 0.01 and maximum tree depth of 6, incorporating early stopping to halt training after 500 consecutive non-improving iterations. LightGBM employed a histogram-based acceleration strategy, parameterized with a learning rate of 0.05, 31 leaves per tree, and L2 regularization (λ = 0.1) to mitigate overfitting. The random seeds for all machine learning algorithms were set to 123. In the prediction model, the CMI index is included as a continuous variable, aiming to prevent the loss of information caused by converting it into a categorical variable through segmentation.
Models were evaluated using 10-fold stratified cross-validation. Discrimination was evaluated by Receiver operating characteristic (ROC) curves and area under the curve (AUC). Calibration was evaluated by calibration plots, and the decision curve analysis (DCA) was used to estimate net benefit. Additionally, sensitivity, specificity, positive predictive value (PPV), negative predictive value (NPV), accuracy, and F1-score were calculated. The optimal model underwent SHapley Additive exPlanations (SHAP) analysis. SHAP values were computed using 100 bootstrap iterations to quantify feature importance. Individual prediction contributions were visualized via summary plots and force diagrams.
Analyses were performed in R 4.1.3 with packages including glmnet (LASSO), rms (RCS), caret (machine learning framework), xgboost, lightgbm, and shapviz (SHAP analysis). A two-sided P < 0.05 was considered statistically significant.
Result
Baseline Characteristics
A detailed flow diagram of patient selection is presented in Figure 1. A total of 702 patients were included and categorized into the non-CMD group (n = 336) and CMD group (n = 366). Clinical characteristics of the two groups are summarized in Table 1. There were significant differences in age, weight, smoking status, hemoglobin, BUN, and thrombus aspiration between the two groups (all P < 0.05).
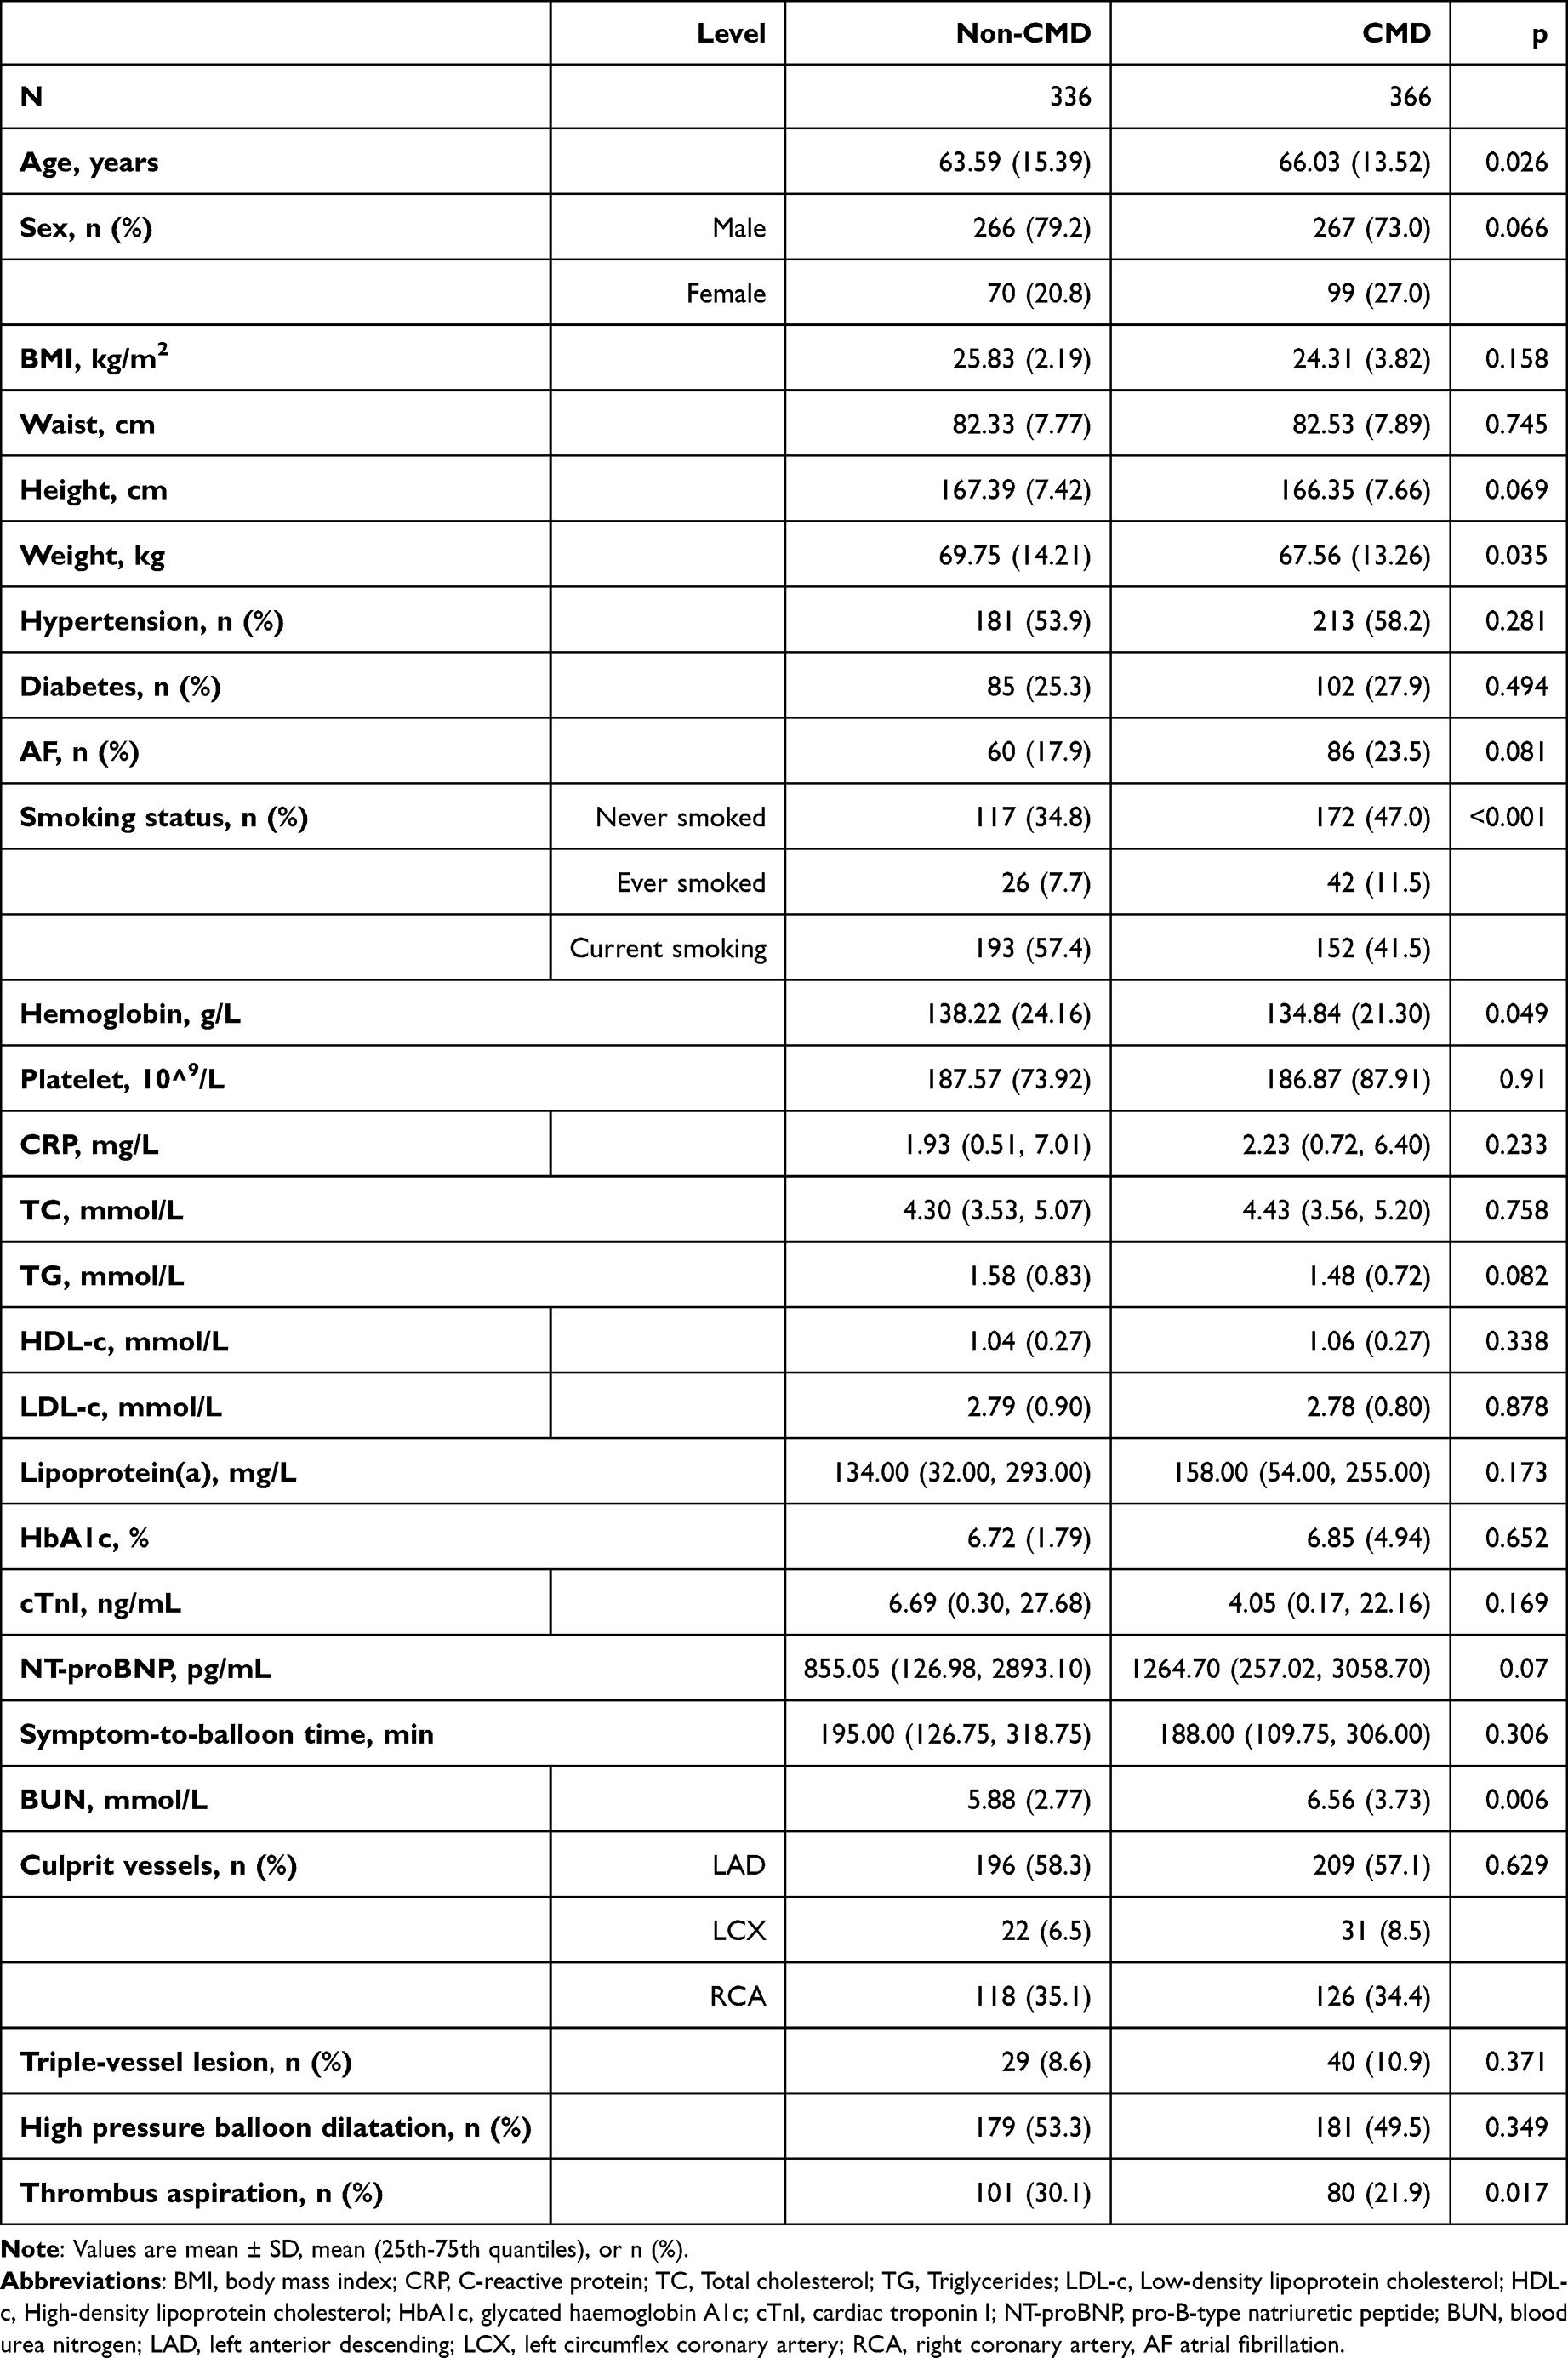 |
Table 1 Baseline Characteristics of Patients with CMD and Without CMD |
Association Between CMI and CMD
The patients were categorized into 3 groups according to tertiles of CMI levels: the first tertile group (T1) group (≤0.619), second tertile (T2) group (0.620–0.995), and third tertile (T3) group (>0.995). The number of cases of CMD in each group was 101 (43.16%), 122 (52.14%), and 143 (61.11%), respectively (Table 2). After adjusting for all variables listed in Table 1, compared to the reference level (T1), the risk of CMD was increased in T2 (adjusted odds ratio (aOR) 2.41, 95% CI 1.60–3.63) and the T3 group (aOR 3.40, 95% CI 2.17–5.32). With the increase of CMI levels, the risk of CMD showed an increasing trend, p < 0.001.
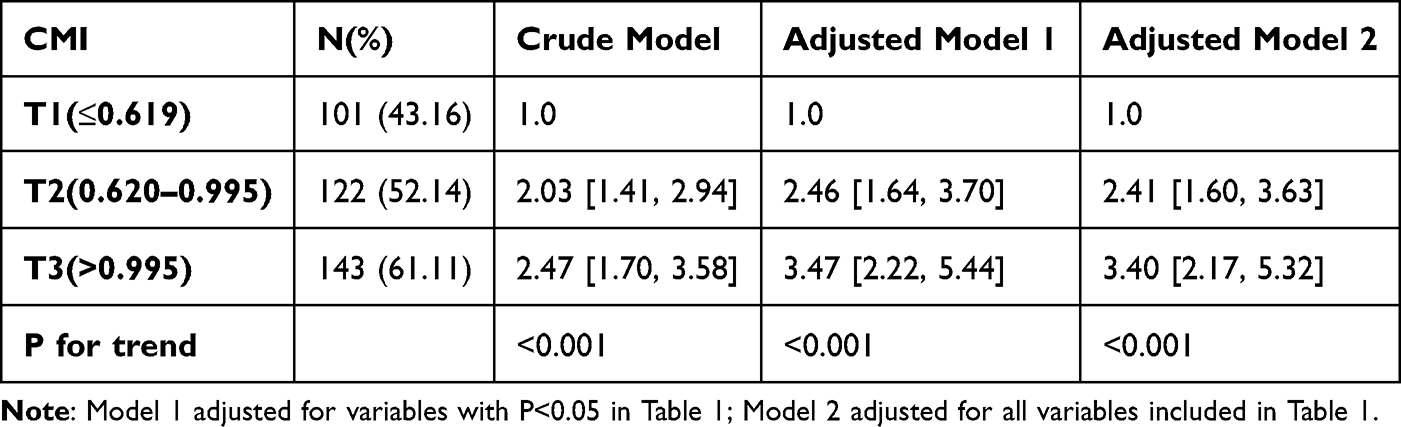 |
Table 2 Logistic Regression Analyses for the Association of CMI and CMD |
The restricted cubic spline curve showed that after adjustment for age, sex, BMI, waist circumference, height, weight, hypertension, diabetes, AF, smoking, hemoglobin, platelet, CRP, TC, TG, HDL-c, LDL-c, lipoprotein(a), HbA 1c, BUN, cTnI, NT-proBNP, culprit vessels, triple-vessel lesion, thrombus aspiration, symptom-to-balloon time, and high pressure balloon dilatation, the risk of CMD gradually increased with the increase of CMI level at CMI < 1.2, and there exited a non-linear relation between CMI and CMD (p < 0.001) (Figure 2).
 |
Figure 2 Cubic spline analyses for the association between CMI and the risk of CMD. |
Predictive Model for CMD
ROC curve analysis showed that that CMI alone had moderate predictive values for CMD after PCI in STEMI patients, with an AUC of 0.627 (95% CI: 0.586–0.666) (Figure 3).
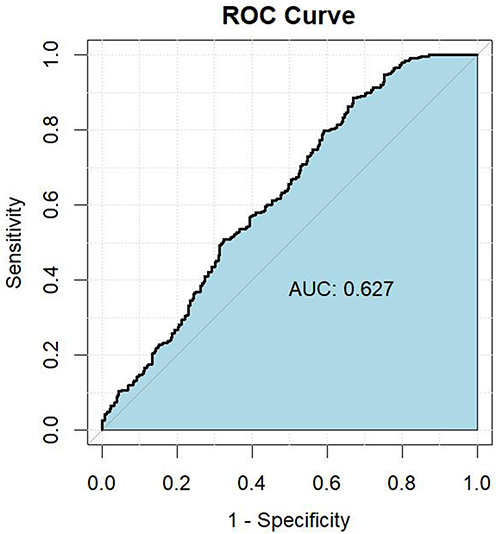 |
Figure 3 The receiver operating characteristic curve of CMI as a maker to predict post-PCI CMD in patients with acute ST elevation myocardial infarction. |
LASSO logistic regression was used for feature screening, and the optimal λ was 0.02554869 from the cross-validation (Figure 4). A total of 7 variables with predictive value were screened, which were CMI, hemoglobin, age, BUN, weight, AF, and thrombus aspiration. These seven variables were used to construct four machine learning algorithms, including random forest (RF) model, LightGBM, XGboost, and KNN. Model performances were evaluated using the AUC and DCA for evaluating the clinical net benefits (Table 3 and Figure 5). Among the machine learning algorithms, the RF model demonstrated superior performance with an AUC of 0.774, compared to 0.686 for XGBoost and 0.685 for KNN and 0.675 for LightGBM.
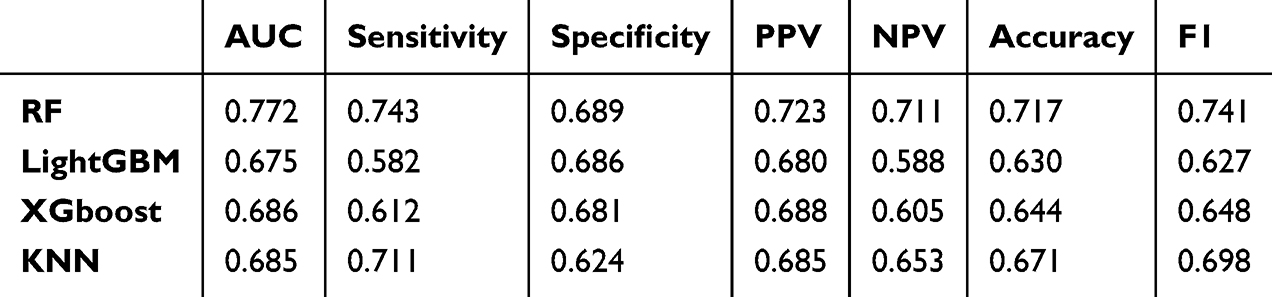 |
Table 3 The Performances of Four Machine Learning Algorithms |
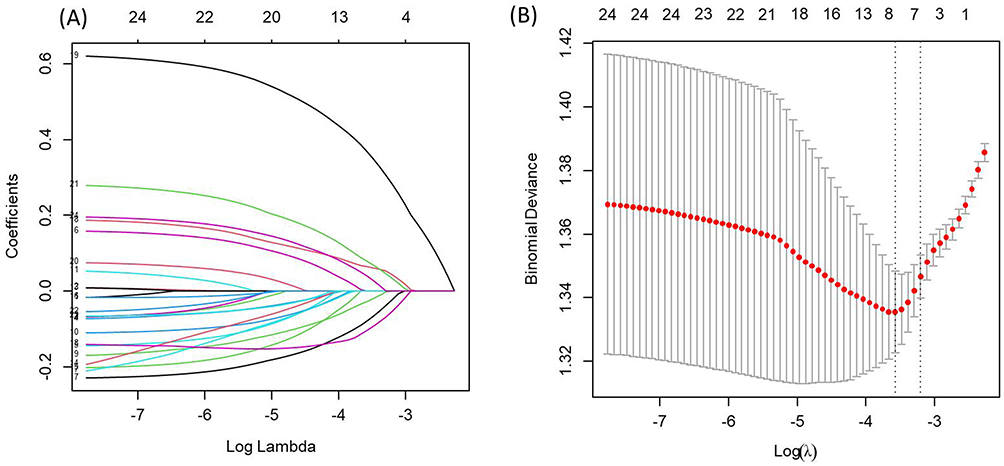 |
Figure 4 LASSO logistic regressions were used for feature screening. (A) the coefficient path plot (B) the cross-validation error plot. |
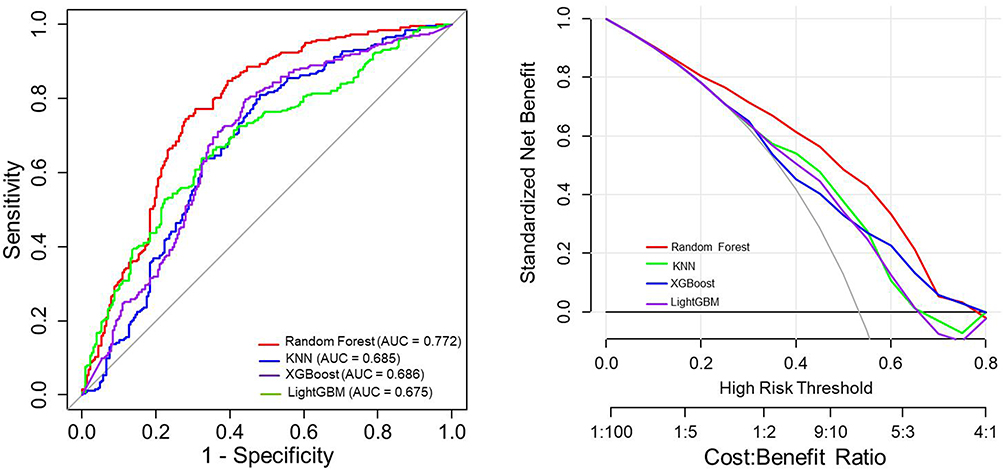 |
Figure 5 Comparison of receiver operating characteristic curve and the decision curve analysis of four models. |
The key factors for predicting CMD were identified by SHAP honeycomb plot, and the results showed that CMI, hemoglobin and age were the top three predictors. Among them, the CMI index had the most significant predictive value for CMD (Figure 6).
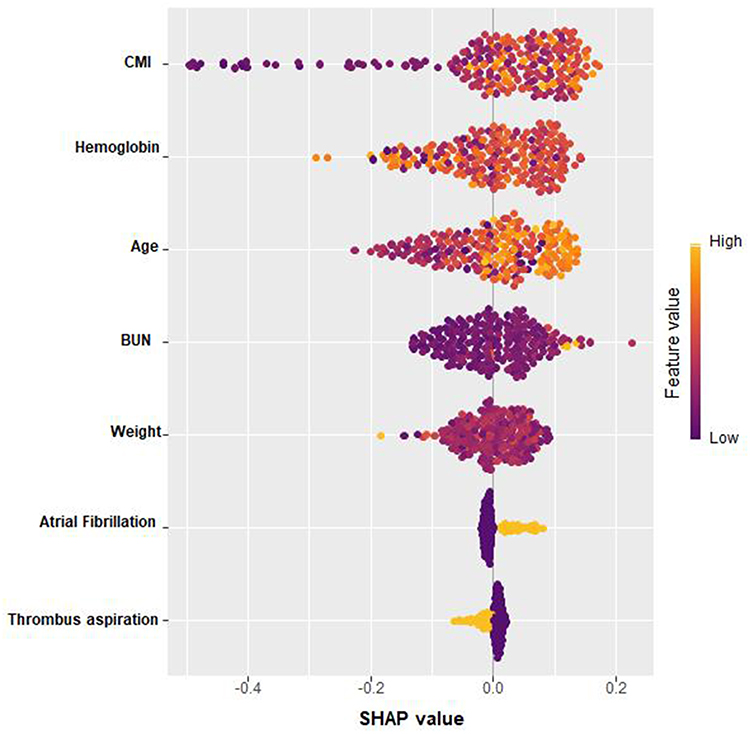 |
Figure 6 SHAP honeycomb plot. |
Discussion
The current study is the first work studying the correlation and predictive value of CMI for post-PCI CMD in STEMI patients. Patients in higher CMI tertiles had significantly elevated CMD risk compared to those in the lowest tertile. Notably, we revealed a significant and nonlinear association between CMI levels and the risk of CMD. CMI alone predicted CMD with AUC of 0.627. However, when CMI was combined with other variables to construct a predictive model, the RF model demonstrated the best predictive efficacy (AUC = 0.772), and the SHAP analyses clearly showed that CMI was the variable that contributed most to the prediction of CMD.
Primary PCI is the preferred reperfusion therapy strategy for treating STEMI. It has been shown that STEMI patients may present with CMD after successful PCI, resulting in slow or no reflow phenomena in the coronary arteries, which can lead to worse clinical outcomes.14 Indeed, one study demonstrated that CMD was a major risk factor for many adverse cardiovascular events, but significant limitations remained in its clinical diagnosis and treatment.15,16 In this study, we used AMR to assess CMD, a wire-free and adenosine-free index, known for its high diagnostic accuracy, thereby providing a new technological pathway for optimal CMD management.13 Among 702 STEMI patients undergoing PCI, we found that more than half (52.1%) of them demonstrated CMD, highlighting the high prevalence and clinical importance of CMD following PCI. Our study included acute STEMI patients, who inherently have a high thrombus burden. The overall thrombus aspiration rate was 25.8% in our study, which was similar to other research.17
CMI is closely associated with the occurrence of diabetes, atherosclerosis and hypertension, and plays an important role in screening for metabolic diseases.18 CMI also has demonstrated strong predictive value for cardiovascular disease (CVD) risk, with a significant positive association with myocardial infarction (MI) incidence. This association remains statistically robust even after adjusting for lipid-lowering therapies.19 Elevated CMI may trigger systemic inflammation, accelerating cardiovascular damage, increasing long-term complication risks, and contributing to poorer prognoses and higher mortality.20 A recent Chinese study further confirmed that CMI was closely associated with the coronary artery lesion severity in patients with acute MI, and was an independent predictor of the risk of long-term MACE. Each one-unit increase in CMI was associated with a 71% increase in the risk of developing MACE.21 These findings were corroborated by a retrospective cohort study (n = 2067) in hypertensive patients with obstructive sleep apnea, where rising CMI levels predicted increased CVD and coronary heart disease incidence over a median follow-up period of 6.83 years.22 Our study was the first to investigate the association between CMI and post-PCI CMD in STEMI patients, and found that a higher CMI level was an independent risk factor for CMD. One study showed that clinical factors and the severity of epicardial coronary artery lesions were not effective predictors of the extent of CMD,23 which also makes the prediction of CMD more challenging. Despite this, Our findings suggested that CMI had moderate predictive value for CMD. Moreover, machine-learning further enhanced its prediction power.
CMI, calculated as TG/HDL-c × WHtR, reflects visceral obesity and metabolic inflammation that may be associated with CMD. WHtR has been suggested to outperform BMI and waist circumference in predicting cardiovascular risk.24 The TG/HDL-c ratio is recognized as an indicator of metabolic syndrome, insulin resistance (IR), and coronary artery disease.25,26 IR can cause endothelial dysfunction, vascular resistance, inflammation of the vascular endothelium and microvascular damage. Endothelial injury may further exacerbate microvascular reperfusion dysfunction. After PCI, CMD may result from ischaemia, reperfusion injury, and microvascular embolism.27 TG/HDL-c is also a classic lipid index that shows the balance between atherogenic and anti-atherogenic lipoproteins. A cohort study using the UK Biobank showed that an elevated TG/HDL-c ratio was associated with a higher risk of CVD, coronary heart disease and stroke, and these associations were largely mediated by a greater prevalence of dyslipidemia, hypertension, and diabetes.28 Furthermore, studies showed that adipose tissue produced pro-inflammatory cytokines such as interleukin 6 and tumor necrosis factor-alpha, which were shown to have an effect on atherosclerosis.29 Inflammatory processes directly affected microvascular function, which in turn affected the development and prognosis of acute coronary syndrome (ACS). Moreover, pro-inflammatory cytokines were closely associated with impaired coronary microcirculation in ACS patients.30 Therefore, elevated CMI levels may serve as an underlying mechanism for the increased risk of CMD after PCI in STEMI patients by mediating metabolic disturbances and inflammation of the vascular system. In our study, CMI and CMD risk showed a nonlinear relationship. When the CMI > 1.2, the CMD risk tended to flatten. We speculate that an excessively high CMI value has already reflected that the individual is in a metabolic or physiological extreme state. When the CMI value is too high, it may suggest the existence of more complex metabolic or disease mechanisms, causing the risk of CMD to no longer increase linearly simply with the rise of CMI.
To our knowledge, it is the first study to investigate the association between CMI and post-PCI CMD evaluated by AMR in STEMI patients. Our findings highlight the potential of CMI as a simple yet powerful predictor of microvascular injury, easily incorporated into routine clinical practice. However, several limitations should be acknowledged. First, the retrospective design precludes control over unmeasured confounders, such as dietary patterns and physical activity levels, which may influence CMD. We are also unable to establish a cause-and-effect association between CMI and CMD. Second, as a single-center study with a relatively small sample size, patient selection bias may exist. Therefore, our findings may not be generalizable to broader populations with differing regional or ethnic characteristics. Third, while AMR is non-invasive and accurate, it still has measurement variability, which could influence CMD classification. Finally, the absence of long-term follow-up data limits our ability to assess the dynamic relationship between CMI changes and MACE, including heart failure hospitalization and cardiovascular mortality.
We propose that patients with elevated CMI should be prioritized for targeted CMD assessment, and structured follow-up protocols should be implemented after PCI to reduce the risk of MACE. For patients with hyperlipidemia or abdominal obesity, it is crucial to encourage the consistent use of lipid-lowering and weight-loss drugs to actively control CMI levels. Future research should focus on prospective validation in multicenter cohorts, with extended follow-up to evaluate the prognostic value of serial CMI measurements. Additionally, interventional studies are needed to explore the efficacy of targeted metabolic therapies in improving microvascular dysfunction in high-CMI patients, potentially through mechanisms involving suppression of inflammation, endothelial function restoration, and oxidative stress reduction.
Conclusion
In conclusion, this study demonstrates a significant association between elevated CMI levels and an increased risk of CMD following PCI in STEMI patients. Our findings suggest CMI may serve as a useful biomarker for refining risk stratification in this population. These results highlight the potential contribution of visceral obesity and dysregulated lipid metabolism to CMD pathogenesis. While further validation in larger, multi-center cohorts is warranted, incorporating CMI into clinical assessment may provide additional value in identifying high-risk patients and guiding future risk management strategies.
Abbreviations
PCI, Percutaneous coronary intervention; STEMI, ST-segment elevation myocardial infarction; CMD, Coronary microvascular dysfunction; MACE, Major adverse cardiovascular events; IMR, Microcirculatory Resistance Index; AMR, Angiography-based index of microcirculatory resistance; QFR, Quantitative flow ratio; WHtR, Waist-to-height ratio; CABG, Coronary artery bypass graft; TC Total cholesterol; TG, Triglycerides; LDL-c, Low-density lipoprotein cholesterol; HDL-c, High-density lipoprotein cholesterol; HbA1c, Glycated haemoglobin A 1c; BUN, Blood urea nitrogen; AF, Atrial fibrillation; ROC, Receiver operating characteristic; AUC, Area under the receiver operating characteristic curve; DCA, Decision curve analysis; OR, Odds ratio; CI, Confidence intervals; RCS, Restricted cubic spline; LASSO, Least absolute shrinkage and selection operator; RF, Random forest; KNN, K-Nearest Neighbors; PPV, Positive predictive value; NPV, Negative predictive value; SHAP, SHapley Additive exPlanations.
Data Sharing Statement
The original contributions presented in the study are included in the article. Further inquiries can be directed to the corresponding author.
Ethics Approval and Consent to Participate
The study was approved by the Ethics Committee of Taizhou People’s Hospital affiliated with Nanjing Medical University (ethical approval number: LSKY 2025-076-01). Informed patient consent was not required as the study was retrospective in nature and analyzed patient data anonymously.
Acknowledgments
The authors thank all the staff members of the Department of Cardiology of Taizhou People’s Hospital of Nanjing Medical University for their support and cooperation.
Author Contributions
All authors made a significant contribution to the work reported, whether that is in the conception, study design, execution, acquisition of data, analysis and interpretation, or in all these areas; took part in drafting, revising or critically reviewing the article; gave final approval of the version to be published; have agreed on the journal to which the article has been submitted; and agree to be accountable for all aspects of the work.
Funding
There is no funding to report.
Disclosure
The authors declare that they have no competing interests in this work.
References
1. Hermanides RS, Kilic S, Hof AWJ. Optimal pharmacological therapy in ST-elevation myocardial infarction-a review: a review of antithrombotic therapies in STEMI. Neth Heart J. 2018;26(6):296–310. doi:10.1007/s12471-018-1112-6
2. Hou C, Guo M, Ma Y, et al. The coronary angiography-derived index of microcirculatory resistance predicts left ventricular performance recovery in patients with st-segment elevation myocardial infarction. j Interv Cardiol. 2022;2022:9794919. doi:10.1155/2022/9794919
3. Jia G, Hill MA, Sowers JR. Diabetic cardiomyopathy: an update of mechanisms contributing to this clinical entity. Circ Res. 2018;122(4):624–638. doi:10.1161/CIRCRESAHA.117.311586
4. Kumar R, Qayyum D, Ahmed I, et al. predilation ballooning in high thrombus laden STEMIs: an independent predictor of slow flow/no-reflow in patients undergoing emergent percutaneous coronary revascularization. J Interv Cardiol. 2023;2023:4012361. doi:10.1155/2023/4012361
5. Tebaldi M, Biscaglia S, Di Girolamo D, et al. Angio-based index of microcirculatory resistance for the assessment of the coronary resistance: a proof of concept study. j Interv Cardiol. 2020;2020:8887369. doi:10.1155/2020/8887369
6. Long YB, Huang CC, Pan HW, Rong JJ. The clinical application of the index of microcirculatory resistance in patients with STEMI. Zhonghua Xin Xue Guan Bing Za Zhi. 2023;51(11):1130–1136. doi:10.3760/cma.j.cn112148-20230915-00164
7. Li W, Takahashi T, Rios SA, et al. Diagnostic performance and prognostic impact of coronary angiography-based Index of Microcirculatory Resistance assessment: a systematic review and meta-analysis. Catheter Cardiovasc Interv. 2022;99(2):286–292. doi:10.1002/ccd.30076
8. Fernández-Peregrina E, Garcia-Garcia HM, Sans-Rosello J, et al. Angiography-derived versus invasively-determined index of microcirculatory resistance in the assessment of coronary microcirculation: a systematic review and meta-analysis. Catheter Cardiovasc Interv. 2022;99(7):2018–2025. doi:10.1002/ccd.30174
9. Nguyen Ngoc H, Kriengsinyos W, Rojroongwasinkul N, Aekplakorn W. Association of adiposity indices with hypertension in middle-aged and elderly Thai population: national health examination survey 2009 (NHES-IV). J Cardiovasc Dev Dis. 2019;6(1). doi:10.3390/jcdd6010013
10. Zhao J, Liang C. Correlation between peripheral microcirculation and coronary microvascular dysfunction. Zhonghua xin xue guan bing za zhi. 2022;50(8):743–748. doi:10.3760/cma.j.cn112148-20211018-00895
11. Zou J, Xiong H, Zhang H, Hu C, Lu S, Zou Y. Association between the cardiometabolic index and non-alcoholic fatty liver disease: insights from a general population. BMC Gastroenterol. 2022;22(1):20. doi:10.1186/s12876-022-02099-y
12. Rao SV, O’Donoghue ML, Ruel M, et al. ACC/AHA/ACEP/NAEMSP/SCAI guideline for the management of patients with acute coronary syndromes: a report of the American coLlege of Cardiology/American Heart association joint committee on clinical practice guidelines. Circulation. 2025;151(13):e865. doi:10.1161/CIR.0000000000001309
13. Fan Y, Fezzi S, Sun P, et al. In vivo validation of a novel computational approach to assess microcirculatory resistance based on a single angiographic view. j Pers Med. 2022;12(11):1798. doi:10.3390/jpm12111798
14. Silva M, Paiva L, Teixeira R, Ferreira MJ, Gonçalves L. Microcirculation function assessment in acute myocardial infarction: a systematic review of microcirculatory resistance indices. Front Cardiovasc Med. 2022;9:1041444. doi:10.3389/fcvm.2022.1041444
15. Li Z, Luan Y, Wang M, et al. Effects of salvianolate on microcirculatory disturbance in patients with stable coronary heart disease: study protocol for a randomized controlled trial. Trials. Trials. 2021;22(1):192. doi:10.1186/s13063-021-05099-7
16. Li H, Gao Y, Lin Y. Progress in molecular mechanisms of coronary microvascular dysfunction. Microcirculation. 2023;30(7):e12827. doi:10.1111/micc.12827
17. Qu YY, Zhang XG, Ju CW, et al. Age-related utilization of thrombus aspiration in patients with ST-segment elevation myocardial infarction: findings from the improving care for cardiovascular disease in china project. Front Cardiovasc Med. 2022;9:791007. doi:10.3389/fcvm.2022.791007
18. Cheng L, Wu Q, Wang S. Association between cardiometabolic index and hepatic steatosis and liver fibrosis: a population-based study. Hormones (Athens). Hormones. 2024;23(3):477–486. doi:10.1007/s42000-024-00572-9
19. Zhang J, Jiang J, Zhao J, et al. Association between cardiometabolic index and myocardial Infarction: based on NHANES database. Acta cardiologica. 2025;80(2):163–172. doi:10.1080/00015385.2025.2460404
20. Xu B, Wu Q, La R, et al. Is systemic inflammation a missing link between cardiometabolic index with mortality? Evidence from a large population-based study. Cardiovasc Diabetol. 2024;23(1):212. doi:10.1186/s12933-024-02251-w
21. Wang KY, Lai HM, Tao J, et al. Association of cardiometabolic index with severity of coronary artery stenosis and prognosis in patients with acute myocardial infarction. Chin J Endocrinol Metab. 2024;40(8):647–653. doi:10.3760/cma.j.cn311282-20231228-00234
22. Cai X, Hu J, Wen W, et al. Associations of the cardiometabolic index with the risk of cardiovascular disease in patients with hypertension and obstructive sleep apnea: results of a longitudinal cohort study. Oxid Med Cell Longev. 2022;2022:4914791. doi:10.1155/2022/4914791
23. Kobayashi Y, Lee JM, Fearon WF, et al. Three-vessel assessment of coronary microvascular dysfunction in patients with clinical suspicion of ischemia: prospective observational study with the index of microcirculatory resistance. Circ Cardiovasc Interv. 2017;10(11):e005445. doi:10.1161/CIRCINTERVENTIONS.117.005445
24. Qiu Y, Yi Q, Li S, et al. Transition of cardiometabolic status and the risk of type 2 diabetes mellitus among middle-aged and older Chinese: a national cohort study. J Diabetes Investig. 2022;13(8):1426–1437. doi:10.1111/jdi.13805
25. Ünver Ulusoy T, Bilek HC, Demirköse H, Keleş A. Evaluation of TyG index and TG/HDL-C ratio in HBeAg negative chronic hepatitis B infected patients. Biomol Biomed. 2023;23(1):137–144. doi:10.17305/bjbms.2022.7320
26. Işık AC, Turan Erkek E, Kaya Tuna M. Idiopathic thrombocytopenic purpura and cardiovascular disease: is elevated triglycerides to high-density lipoprotein cholesterol ratio a marker? Istanbul Med J. 2023;24(1):71–75. doi:10.4274/imj.galenos.2023.23682
27. Zhang XT, Lin ZR, Zhang L, Zhao ZW, Chen LL. MELD-XI score predict no-reflow phenomenon and short-term mortality in patient with ST-segment elevation myocardial infarction undergoing primary percutaneous coronary intervention. BMC Cardiovasc Disord. 2022;22(1):113. doi:10.1186/s12872-022-02556-2
28. Che B, Zhong C, Zhang R, et al. Triglyceride-glucose index and triglyceride to high-density lipoprotein cholesterol ratio as potential cardiovascular disease risk factors: an analysis of UK biobank data. Cardiovasc Diabetol. 2023;22(1):34. doi:10.1186/s12933-023-01762-2
29. Wu R, Hou F, Wang X, et al. nonalcoholic fatty liver disease and coronary artery calcification in a northern chinese population: a cross sectional study. Sci Rep. 2017;7(1):9933. doi:10.1038/s41598-017-09851-5
30. Ji J, Wei X, Chen W, Wan D, Han W, Liu H. Effects of early PCSK9 inhibitor application on inflammation levels and microcirculatory function after PCI in patients with NSTE-ACS. Am J Transl Res. 2023;15(5):3586–3596.
 © 2025 The Author(s). This work is published and licensed by Dove Medical Press Limited. The
full terms of this license are available at https://www.dovepress.com/terms
and incorporate the Creative Commons Attribution
- Non Commercial (unported, 4.0) License.
By accessing the work you hereby accept the Terms. Non-commercial uses of the work are permitted
without any further permission from Dove Medical Press Limited, provided the work is properly
attributed. For permission for commercial use of this work, please see paragraphs 4.2 and 5 of our Terms.
© 2025 The Author(s). This work is published and licensed by Dove Medical Press Limited. The
full terms of this license are available at https://www.dovepress.com/terms
and incorporate the Creative Commons Attribution
- Non Commercial (unported, 4.0) License.
By accessing the work you hereby accept the Terms. Non-commercial uses of the work are permitted
without any further permission from Dove Medical Press Limited, provided the work is properly
attributed. For permission for commercial use of this work, please see paragraphs 4.2 and 5 of our Terms.