")
Back to Journals » International Journal of Nephrology and Renovascular Disease » Volume 13
Regression of Peritubular Capillaries Coincides with Angiogenesis and Renal Cyst Growth in Experimental Polycystic Kidney Disease
Authors O'Brien K, Saravanabavan S , Zhang JQJ , Wong ATY, Munt A , Burgess JS, Rangan GK
Received 15 November 2019
Accepted for publication 6 March 2020
Published 1 April 2020 Volume 2020:13 Pages 53—64
DOI https://doi.org/10.2147/IJNRD.S238767
Checked for plagiarism Yes
Review by Single anonymous peer review
Peer reviewer comments 3
Editor who approved publication: Professor Pravin Singhal
Kristal O’Brien,1,2 Sayanthooran Saravanabavan,1,2 Jennifer QJ Zhang,1,2 Annette TY Wong,1,2 Alexandra Munt,1,2 Jane S Burgess,1,2 Gopala K Rangan1,2
1Centre for Transplant and Renal Research, Westmead Institute for Medical Research, The University of Sydney, Sydney, New South Wales, Australia; 2Department of Renal Medicine, Westmead Hospital, Western Sydney Local Health District, Sydney, New South Wales, Australia
Correspondence: Gopala K Rangan
Centre for Transplant and Renal Research, Westmead Institute for Medical Research, The University of Sydney, Level 5, 176 Hawkesbury Road (PO Box 412), Westmead, NSW 2145, Australia
Tel +61-2 8627 3502
Fax +61-2 9475-1146
Email [email protected]
Background/Aim: The natural history of the renal microvasculature changes in PKD is not known. The aim of this study was to test the hypothesis that angiogenesis is coupled with kidney cyst expansion, and the loss of peritubular capillary networks precedes the onset of interstitial fibrosis.
Methods: The renal microvasculature (RECA-1 and CD34) was evaluated in groups of Lewis polycystic kidney (LPK) rats and juvenile cystic kidney (jck) mice during the early, mid and late stage of disease. In addition, LPK rats and jck mice received sirolimus to determine if the reduction in renal cyst growth is in part mediated by the suppression of angiogenesis.
Results: In LPK rats, the loss of peritubular capillaries occurred in early-stage disease and paralleled cyst formation whereas in jck mice it was delayed to the mid stage. In both models, vasa recta were displaced by growing cysts and regressed in LPK rats with disease progression but lengthened in jck mice. Cortical and medullary capillary neoangiogenesis occurred during the early stage in both models and persisted with progression. Treatment with sirolimus reduced cyst enlargement but did not alter the progression of renal microvasculature changes in either model.
Conclusion: Regression of peritubular capillaries and disruption of vasa recta occur in parallel with angiogenesis and the progressive enlargement of kidney cysts. These data suggest that the regrowth of peritubular capillaries together with inhibition of angiogenesis are potential strategies to be considered in the treatment of PKD.
Keywords: juvenile cystic kidney, jck, Lewis polycystic kidney, LPK, peritubular capillary loss, renal vasculature
Introduction
Polycystic kidney disease (PKD) is the most common monogenic cause of kidney failure, and is characterised by the development of hundreds of fluid-filled cysts in the kidney, which contain chloride-rich fluid and are lined by a single layer of cystic epithelial cells (CECs).1 The two most common forms of PKD, autosomal dominant (ADPKD) (1:1000 population prevalence) and autosomal recessive (ARPKD) (1:20,000 population prevalence),2 are both characterised by progressive cyst enlargement and interstitial fibrosis which replaces the normal renal parenchyma and leads to end-stage kidney disease (ESKD).3 In ARPKD, kidney cysts form from the synchronised fusiform dilatation of the collecting duct development in utero or during the early postnatal period. In contrast, in ADPKD, cyst formation arises from an asynchronous diverticular out-pouching of distal nephron segments that then separate from the nephron that becomes clinically evident in adult life. In both cases, abnormalities in planar cell polarity, increased transepithelial fluid secretion and the proliferation of cystic and tubular epithelial cells (TECs) are the key drivers of kidney cyst formation and enlargement.4
In the normal kidney, the renal microvasculature is derived from the post-glomerular capillary network, consisting of cortical and medullary peritubular capillaries and vasa recta.5 The peritubular capillaries supply oxygen and nutrients to tubules and interstitial cells. In the medulla, these capillaries originate from descending vasa recta (arterioles) and give rise to ascending vasa recta (venules). Vasa recta flowing in opposite directions lie in close proximity creating a passive counter current exchange, maintaining the corticomedullary osmotic gradient required for water and solute transport and urinary concentration.6,7 Angiogenesis is the growth or remodelling of existing vessels to form new vascular networks, and is a pathological feature of PKD.8–10 Using a number of techniques (angiography, electron microscopy and corrosion cast methods), end-stage human ADPKD kidney cysts were found to be surrounded by vascular networks, consisting of malformed capillaries with abnormally large diameters and other morphological patterns consistent with angiogenesis.8,9 Angiogenic growth factors have also been correlated with disease severity in young patients with ADPKD,10 and C936T polymorphism in the vascular endothelial growth factor (VEGF) gene increased the risk for progressing to ESKD.11 In parallel with angiogenesis, the normal renal microvasculature is lost in end-stage human ADPKD kidneys,9 and it has been suggested that this may be due to expanding cysts that compress adjacent renal parenchyma and constrict or destroy nearby peritubular capillaries to impair oxygen delivery.12 In support of these observations, in early-stage ADPKD patients, markers of angiogenesis and hypoxia are increased compared to healthy individuals, suggesting that local microcirculatory changes may mediate the eGFR decline in ADPKD.13
To our knowledge the longitudinal changes in angiogenesis and peritubular capillary loss, and their relationship to cyst formation have not been evaluated in experimental models of PKD. Furthermore, in previous studies we and others have shown the mammalian target of rapamycin (mTOR) inhibitor, sirolimus attenuates kidney cyst growth in experimental PKD,14,15 but experimental studies in liver and colon cancer suggest that it also has anti-angiogenic properties.16,17 Therefore, the aim of this study was to test the following hypotheses: (i) angiogenesis is coupled with kidney cyst expansion, and the loss of peritubular capillary networks which precedes the onset of interstitial fibrosis; and (ii) sirolimus reduces angiogenesis in PKD.
Methods
Animal Models and Experimental Protocol
All experiments were approved by the Animal Ethics Committee, Westmead Hospital (Protocol No. 1014.2.09), in accordance with the Australian code for the care and use of animals for scientific purposes (National Health and Medical Research Council, Australia), and the New South Wales Animal Research Act. Two groups of experiments were performed: (i) Study 1: the timecourse of microvasculature changes was investigated in LPK rats and jck mice. The LPK rat is due to a homozygous point mutation in the never in mitosis gene a (NIMA)-related kinase 8 (Nek8) gene (a rare cause of human nephronophthisis) but the renal phenotype recapitulates the features of human ARPKD.18 To assess the time-dependent changes in the renal microvasculature, paraffin-embedded kidney sections from LPK (n=6) and Lewis (n=3) rats were examined at 3, 6, 12 and 24 weeks of age using archival samples from a previous study.19 Similar to the LPK rat, jck mice are due to a homozygous mutation of the Nek8.20 To assess time-dependent changes in renal microvasculature, archival paraffin sections of kidneys from homozygous (Nek8−/-) jck mice (n=4) and wild type (Nek8+/+) littermate control mice (n=4) were examined at post-natal weeks 4, 8 and 12 using archival samples from a previous study.21 These time points were chosen based on the stage of cystic renal disease that have been defined in previous studies (Table 1).19,21 The term “end-stage” is based on the development of impaired renal function and reduced survival that occurred following this time-point.19,21 (ii) Study 2: PKD animals were treated with sirolimus (Rapamune®, Wyeth Australia Pty Ltd)22 to evaluate whether suppressing renal cyst growth was associated with decreased angiogenesis. Adult LPK rats were given 2 mg/kg/day sirolimus in tap water (n=7) or vehicle (n=5) from post-natal week 9 until week 16 (that is, 7 weeks of treatment). In addition, jck mice were given 2 mg/kg/day sirolimus in tap water (n=7) or vehicle (n=7) from post-natal week 4 until week 9 (that is, 5 weeks of treatment). Control heterozygous (Nek8−/+) mice (n=4) were treated with vehicle from 4 weeks of age. The dose of sirolimus and method of administration were based on a previous study conducted in a different ADPKD rat model.22 The kidney and total body weights were recorded at the time of sacrifice.
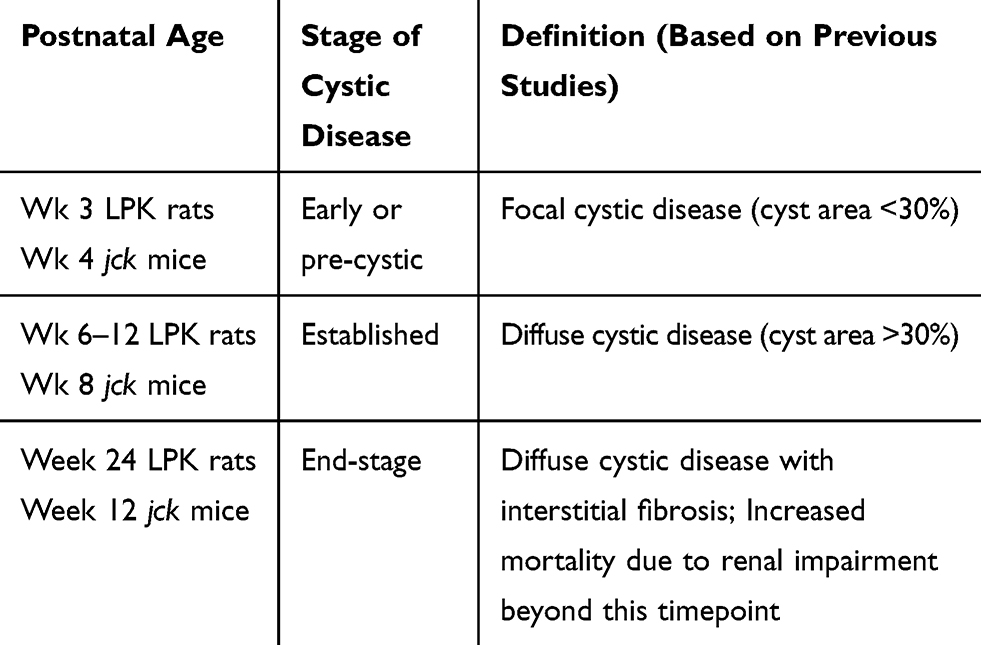 |
Table 1 Definition of Disease Stages in jck Mice and LPK Rats |
Histology and Immunohistochemistry
To visualize the renal microvasculature, immunohistochemistry of formalin-fixed or methyl-Carnoy’s-fixed kidney sections (6 µm thick) was performed using the antibodies listed in Table 2 and as described in the Supplementary Methods.
 |
Table 2 Primary and Secondary Antibodies Used for Immunohistochemical Analysis |
Quantitative and Semi-Quantitative Analyses
For quantitative analysis, contiguous fields of view were analysed in digital images (Olympus BX51, DP11) using Optimas Image analysis System (Version 6.5) and ImageScope (Version 12.4.0). A fine-point marking pen randomly selected the first field of view and the section was then moved in a clockwise direction. Two methods of analysis were used to quantify cortical peritubular capillary density in jck and wild-type mice. First, quantitative analysis measured the percent area of positive CD34 immunostaining. Ten fields of view (400x) were taken per section and the region of interest (ROI) selected manually using image analysis software to exclude glomerular capillaries and the area occupied by cysts in jck mice. Second, cortical peritubular capillary density was measured by blinded, semi-quantitative analysis. Fields of view used in quantitative analysis were graded from 0 to 4 according to the degree of CD34 immunostaining. Qualitative descriptive analysis was performed to describe vascular bundles in the cortex and medulla.
To assess interstitial fibrosis, 10 fields of view (200x) were graded from 0 to 4 according to the degree of fibrosis in sections stained with Masson’s trichrome (Table 3).
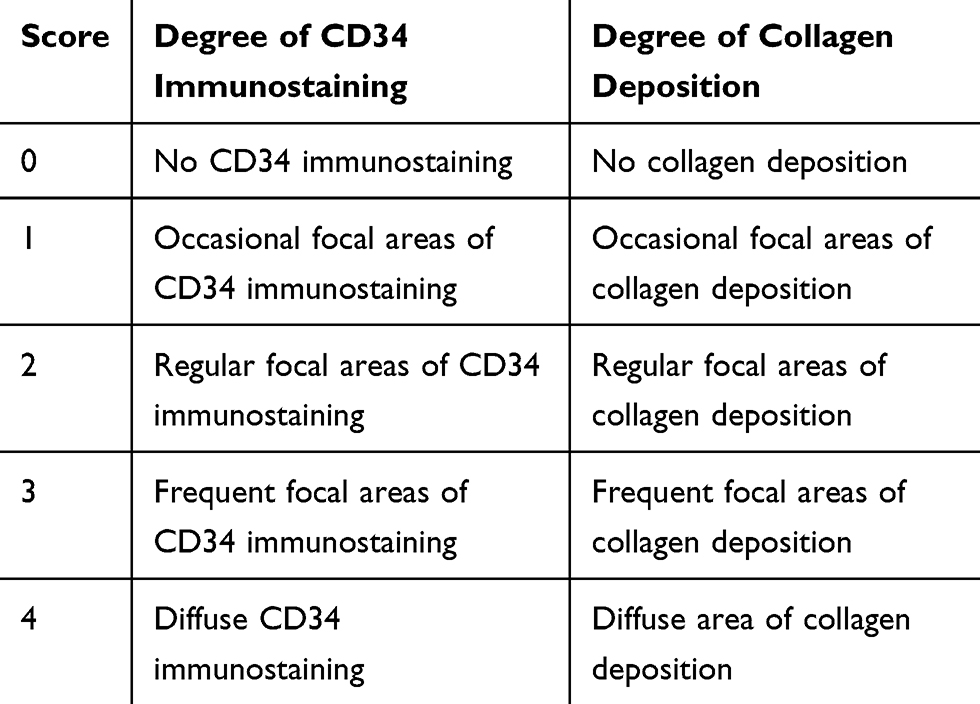 |
Table 3 Scoring Method to Assess the Degree of Collagen Deposition or CD34 Immunostaining |
Statistics
All data were expressed as mean ± standard deviation. For the quantitative analysis of peritubular capillary density and fibrosis, the mean values per section was used to calculate the mean score per group. One-way ANOVA and t-test analyses for group differences were performed using JMP software (Version 4.0.2; SAS Institute, Cary, NC, USA). P<0.05 was considered statistically significant.
Results
Changes in the Renal Microvasculature in LPK Rats with Disease Progression
Loss of Peritubular Capillaries Coincides with Kidney Cyst Growth and Interstitial Fibrosis in LPK Rats
In normal Lewis rats, extensive peritubular capillary networks in the cortex and outer medulla were present at all timepoints (Figure 1). In LPK rats, at postnatal week 3 in the medulla, significant kidney cyst expansion was associated with peritubular capillary loss whereas this was preserved in the cortex (compare Figures 2A and 3A). Generally, with time-progression, focal peritubular capillary networks were preserved in regions with minimally dilated tubules but only the sporadic vessels remained in the presence of extensive cyst growth. Thus, by postnatal week 12, the cortex demonstrated significant cyst expansion and widespread peritubular capillary reduction that was complete with the onset of diffuse interstitial fibrosis (Figure 2).
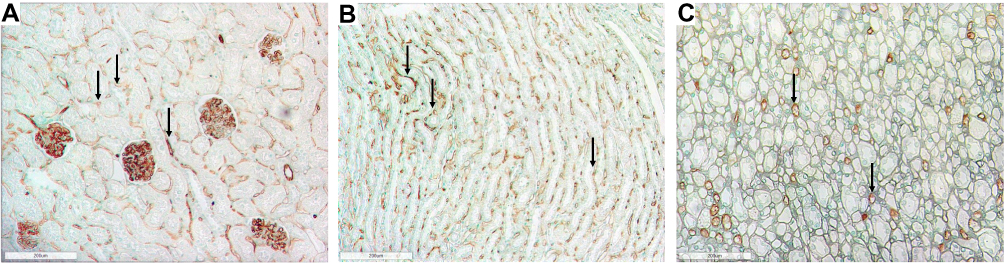 |
Figure 1 Representative photomicrographs of the renal cortex and medulla in normal Lewis rats using RECA-1 immunostaining (brown) showing the extensive peritubular and glomerular staining. (A) Renal cortex in Lewis rats at week 6 (100x) (B) Renal outer medulla in Lewis rats at week 6 (100x); (C) Renal inner medulla in Lewis rat at week 6 (100x). Arrows show examples of positive immunoreactivity for RECA-1 in the tubulointerstitium. |
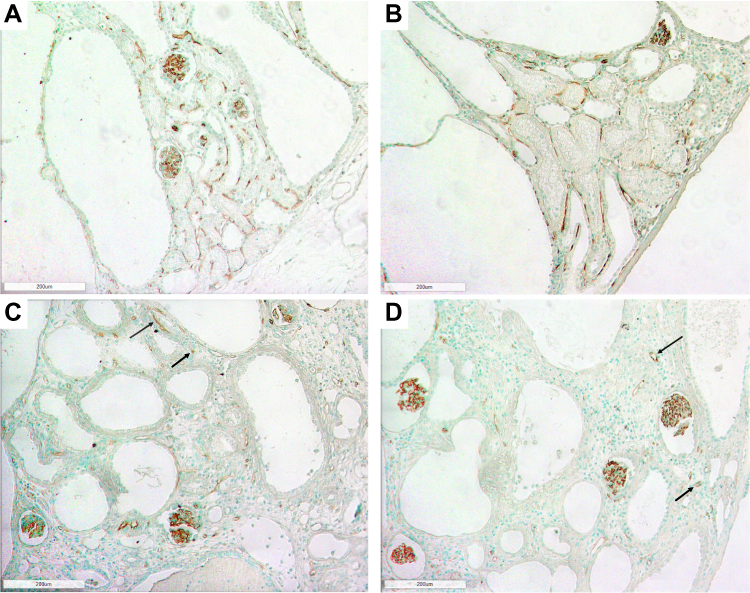 |
Figure 2 Photomicrographs of the renal cortex in LPK rats using RECA-1 immunostaining showing extensive peritubular capillary loss with cyst expansion and sporadic vessel formation in renal cortex. (A) Week 3 (100x); (B) Week 6 (100x); (C) Week 12 (100x) and (D) Week 24 (100x). Examples of sporadic vessels are indicated by arrows. |
 |
Figure 3 Photomicrographs of the renal outer medulla in LPK rats using RECA-1 immunostaining showing the loss of vasa recta with cyst expansion. (A) Week 3 (100x); (B) Week 6 (100x); (C) Week 12 (100x); (D) Week 24 (100x). Examples of limited areas of RECA-1 immunoreactivity are shown by arrows. |
Loss of Vasa Recta Coincides with Established Cyst Growth and Interstitial Fibrosis in LPK Rats
In normal Lewis rats, vasa recta containing ascending and descending vasa recta were distinct from peritubular capillaries and extended from the inner medulla to the outer stripe of the outer medulla (OSOM) (Figure 1B). In LPK rats, at postnatal week 3, vasa recta of the outer medulla resembled those observed in control Lewis rats, and from postnatal week 6, were slightly displaced by growing kidney cysts. However, between postnatal weeks 12 and 24, the vasa recta could no longer be identified (Figure 3). The structural morphology of the vessels of the inner medulla did not differ between Lewis and LPK rats.
Angiogenesis Commences During Early Cyst Growth in LPK Rats
Between postnatal weeks 3 to 12, the interstitial space surrounding large cysts contained sporadic new vessels in the cortex and outer medulla. These vessels were often dilated and represented new remodelled capillaries. From week 6, focal vascular networks appeared within the interstitium of the outer medulla (Figure 4). These networks contained multiple large vessels with varied diameter and often followed a tortuous path. At week 24, there was an increase in focal vascular networks but a decrease in sporadic vessels with the onset of diffuse interstitial fibrosis and end-stage disease. No vessels were observed in the lining of well-developed cysts during any phase of disease. The changes in vessel number in LPK rats were associated with increased expression of HIF1α, in interstitial cells in the medulla (Supplementary Figure 1). However, immunostaining for VEGF, using two antibodies, was not specific and therefore not evaluated further in this study (data not shown).
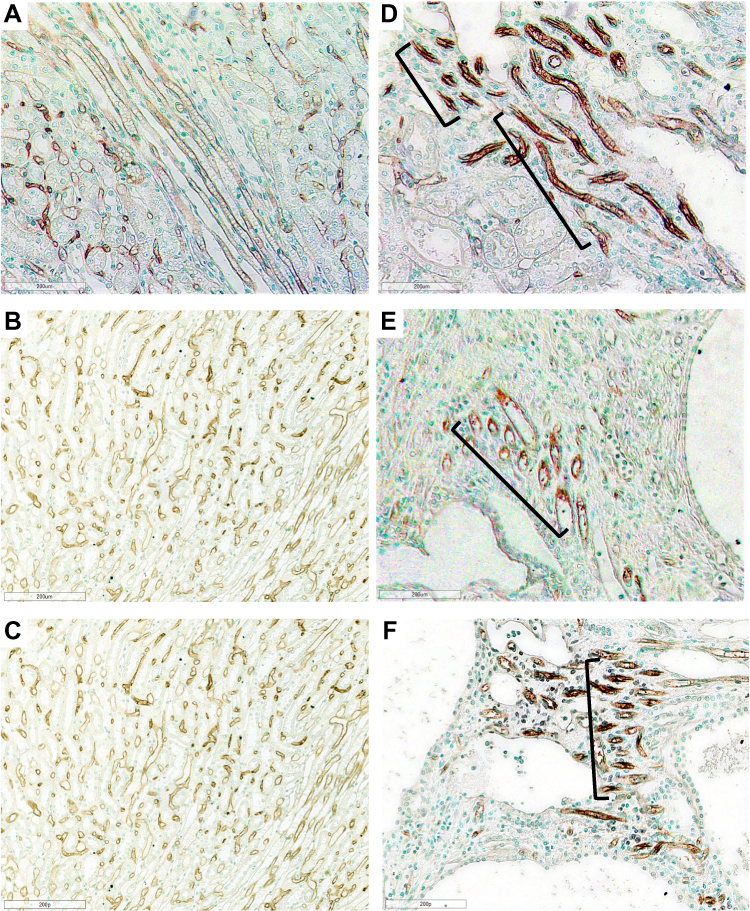 |
Figure 4 Photomicrographs of Lewis and LPK rats using RECA-1 immunostaining showing vascular bundles. Normal vascular bundles seen in Lewis rat at (A) week 6 (200x), (B) week 12 (200x) and (C) week 24 (200x). (D) Focal vascular bundles with dilated vessels (shown in brackets) in LPK rats at week 6 (200x). (E) Focal vascular networks (shown in brackets) in LPK rats at week 12 (200x). (F) Focal vascular bundles (shown in brackets) in LPK rats at week 24 (200x). |
Changes in the Renal Microvasculature in jck Mice with Disease Progression
Loss of Peritubular Capillaries Coincides with Interstitial Fibrosis in jck Mice
As for rats, the renal microvasculature of mice consists of peritubular capillaries and vascular bundles.7 In wild type mice, dense peritubular capillary networks at weeks 4, 8 and 12 was seen, as determined by CD34 immunostaining (Figure 5). Vessels in the cortex demonstrated weak CD34 immunostaining compared to those in the medulla. In jck mice at week 4, by semi-quantitative analysis, cortical peritubular capillary networks were the same as wild-type mice; increased compared to wild-type mice at week 8 and then declined at week 12 (Figure 6). In the inner stripe of the outer medulla (ISOM), peritubular capillary networks remained unaffected at weeks 4 and 8 (with only focal regions of extensive cyst growth demonstrating peritubular capillary loss) and reduced at week 12 (Figure 5).
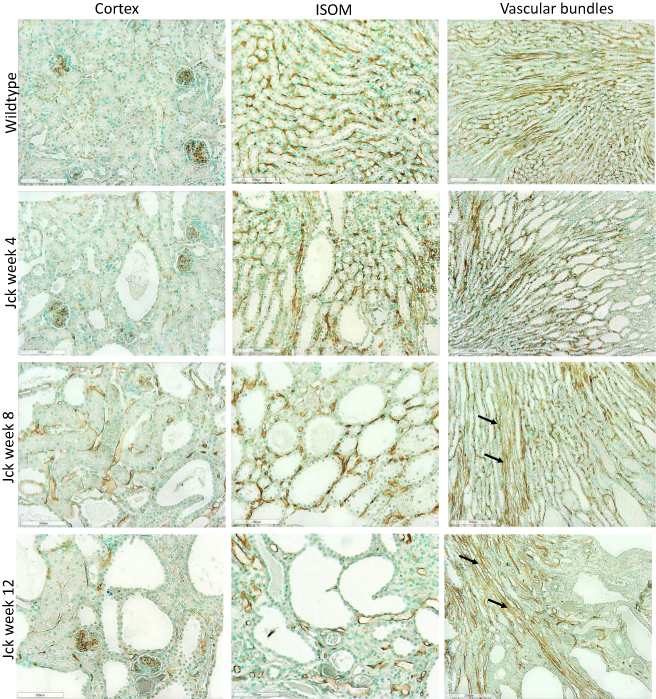 |
Figure 5 Photomicrographs showing vascular remodelling and angiogenesis using CD34 immunostaining in jck mice. The images from top to bottom show wild-type mice at week 4 and jck mice at weeks 4, 8 and 12, and the respective vessels of the cortex (first column, 200x), ISOM (centre column, 200x) and vascular bundles (last column, 100x). |
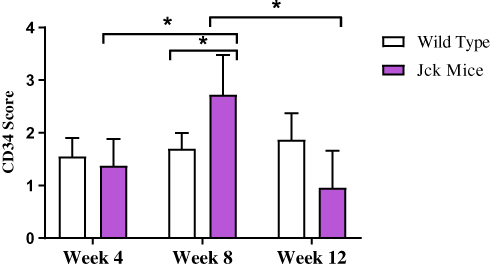 |
Figure 6 Semi-quantitative analysis of CD34 immunostaining in wild type and jck mice at weeks 4, 8 and 12. Data are expressed as mean ± standard error; *P<0.05 compared to respective groups. |
Remodelling of Vascular Bundles in jck Mice
In wild-type mice, vascular bundles were detected in the ISOM and the inner medulla. In jck mice at week 4, vascular bundles of the outer medulla resembled those of wild type mice, and at week 8, it was associated with an expanded renal parenchyma and dilated vasa recta which still reached the OSOM (Figure 5). The latter suggested lengthening of vascular bundles possible due via vascular remodelling in postnatal week 8 jck mice. These abnormal vessels persisted with the onset of end-stage disease at week 12. The morphological structure of the vessels in the inner medulla did not differ from those observed in wild type mice.
Angiogenesis During Established Cyst Growth in jck Mice
In jck mice, at week 4 no differences were observed with wild-type (Figure 5). At week 8, increased CD34 immunoreactivity was detected in the cortical and medullary interstitial space surrounding large cysts (Figure 5). These vessels were often dilated and could represent new or remodelled capillaries. Infrequently these vessels assumed configurations typical of angiogenesis, such as a corkscrew shape (Figure 7). Random cortical and medullary cysts at weeks 4 and 8 also demonstrated new vessels within or surrounding their epithelial lining (Figure 7). At week 12 sporadic vessels within the interstitium and the lining of cysts were more frequent in both the cortex and outer medulla of jck mice.
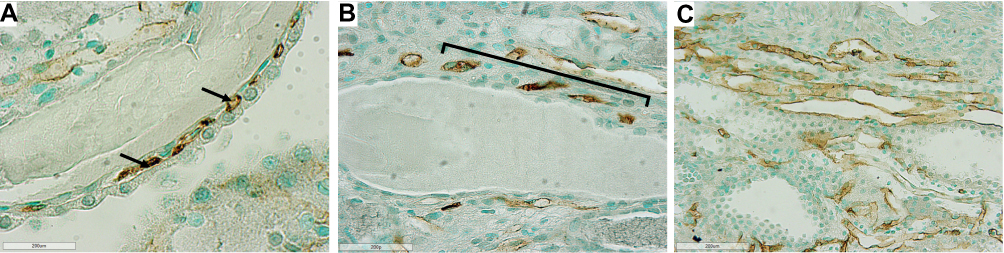 |
Figure 7 Representative photomicrographs showing angiogenesis using CD34 immunostaining in the outer medulla and cortex of jck mice. (A) Vessels within the epithelial lining of a cyst in the cortex at week 8 of a jck mouse are shown by arrows (600x); (B) Vessels with a corkscrew appearance in the outer medulla at week 12 of a jck mouse (indicated by brackets) (400x); and (C) Vascular bundle with dilated vessels at week 12 of a jck mouse (200x). |
Sirolimus Does Not Alter the Renal Microvasculature in Either LPK Rats and jck Mice
Treatment with sirolimus did not affect morbidity or mortality in either LPK rats or jck mice. In LPK rats, sirolimus reduced kidney enlargement (by 10.5%) whereas no significant difference was observed in jck mice (Figure 8). The appearance of the renal microvasculature did not differ between sirolimus and vehicle-treated groups for either LPK rats or jck mice. In LPK rats, peritubular capillary loss in the cortex and outer medulla, focal vascular networks and evidence of remnant or angiogenic capillaries were observed equally in both treatment groups. In jck mice, both sirolimus and vehicle groups demonstrated occasional peritubular capillary networks in areas with minimal cyst expansion, dilated and lengthened vasa recta, focal capillaries and vessels within the lining of cysts. Semi-quantitative analysis demonstrated that the cortical peritubular capillary density was increased in jck mice compared to wildtype, however did not differ between the sirolimus and vehicle-treated jck mice (Figure 9; Supplementary Figure 2).
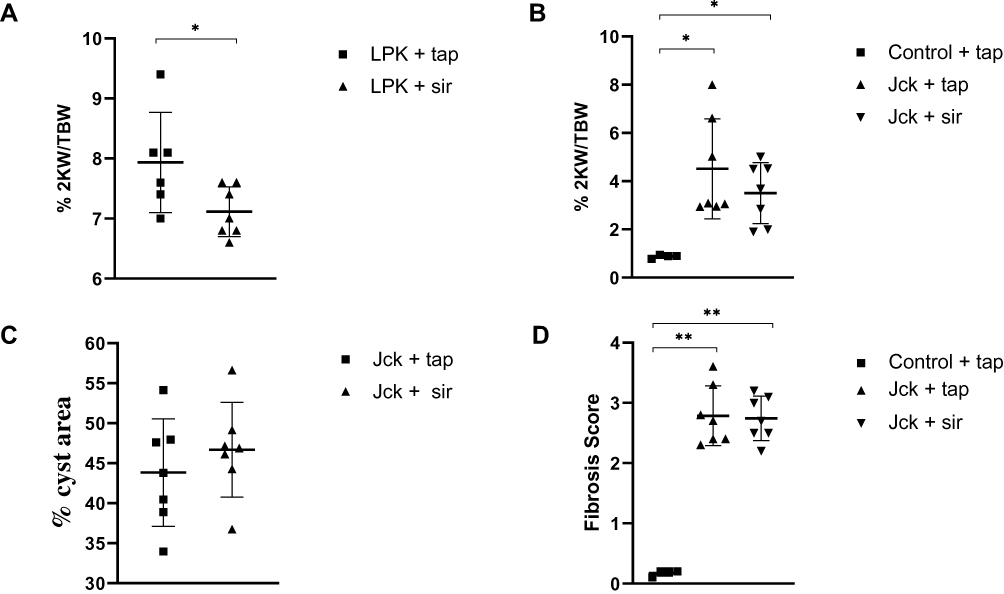 |
Figure 8 Effect of sirolimus (sir) compared to the vehicle (tap water) on the progression of PKD in LPK rats and jck mice. (A) Effect of sirolimus on percentage 2KW/BW ratio in LPK rats; (B) Effect of sirolimus on the percentage 2KW/BW ratio in jck mice; (C) Percentage cyst area in jck mice (D) Degree of collagen deposition in jck (vehicle/sirolimus treated) and control mice. *P<0.05 and **P<0.001. 2KW/BW: two kidney weight to bodyweight ratio. |
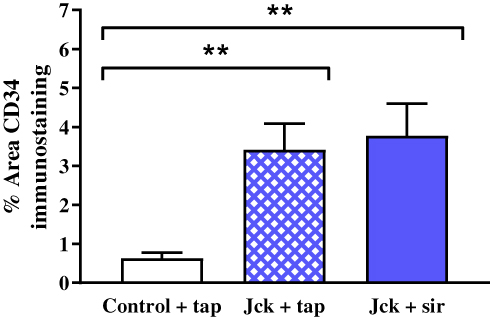 |
Figure 9 Effect of sirolimus (sir) compared to the vehicle (tap water) on the renal microvasculature using semi-quantitative analysis of CD34 immunostaining. **P<0.001. |
Discussion
The results of the present study are, to our knowledge, the first description of the longitudinal changes in renal microvasculature and angiogenesis in experimental models of PKD.9 The main findings were that: (i) peritubular capillary loss coincided with kidney cyst growth and interstitial fibrosis; (ii) angiogenesis is an early feature of cystic kidney disease; and (ii) finally, sirolimus was not associated with changes in the renal microvasculature at doses that inhibit kidney enlargement. The results of the present study extend the data by Wei et al who demonstrated that microvascular regression occurred in parallel with angiogenesis in a cross-sectional histological analysis of human ADPKD.9
The regression of peritubular capillaries is a characteristic feature of chronic kidney disease (CKD), and also observed in PKD. In LPK rats, cyst formation appeared to influence the degree of peritubular capillary loss in early disease. Regions with cyst expansion coincided with extensive peritubular capillary loss whereas unaffected or minimally dilated tubules retained their normal peritubular capillary networks. With the onset of diffuse interstitial fibrosis and end-stage disease, any remaining peritubular capillary networks were lost. Due to the initial focal nature of cyst growth in jck mice, regions with unaffected or minimally dilated tubules were more common and peritubular capillary networks persisted up to end-stage disease. Multiple mechanisms could explain the peritubular capillary loss in these animal models of PKD. The most likely explanation is that expanding cysts compress the surrounding parenchyma causing physical damage, constriction and the loss of peritubular capillaries.12 A second possibility is that peritubular capillary loss could lead to a vicious cycle of hypoxia, fibrosis and further loss of endothelial cells.23 From a therapeutic viewpoint, it would be important to understand the molecular mechanisms to determine whether the prevention of peritubular capillary loss could reduce subsequent interstitial fibrosis, and slowdown the rate of decline in renal function in LPK rats. In LPK rats, widespread peritubular capillary loss also suggests that endothelial cell repair mechanisms may also be impaired, as in CKD. However, in CKD, impaired endothelial cell repair is due to a decrease in local angiogenic factors, such as VEGF,24,25 which is not the case in PKD.25–27 Another possibility is that the recruitment of circulating bone-marrow-derived endothelial progenitor cells could be impaired, as shown in other models of CKD.28 Processes such as excessive rolling and sticking of leukocytes, physical compression of upstream capillaries or a local increase in vasoactive substances such as angiotensin II12,23,28 could stagnate blood flow in PKD. This could impair delivery of endothelial progenitor cells to injured sites, prevent endothelial cell repair and result in the peritubular capillary loss observed in LPK rats (Figure 10).
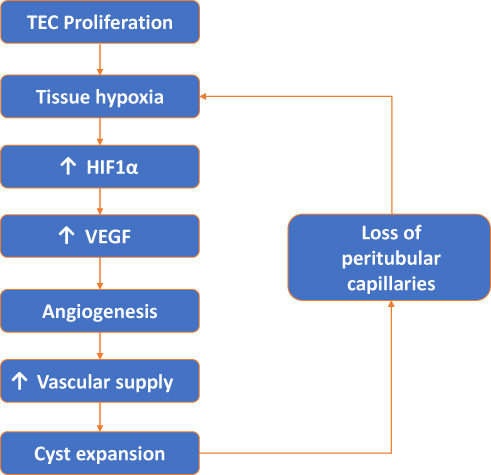 |
Figure 10 Vicious cycle of tubular epithelial cell (TEC) proliferation, tissue hypoxia, angiogenesis and peritubular capillary loss. |
In contrast, in jck mice, peritubular capillary loss coincided with diffuse interstitial fibrosis. In the cortex of jck mice, peritubular capillaries were preserved at week 4, increased in density at week 8 and there was a trend for a gradual (though not statistically significant) decline at week 12. This transient increase in peritubular capillary density has also been observed in other models of CKD, where it was associated with an unsustained increase in VEGF expression.24 The reasons for the differences in the onset of peritubular capillary loss between LPK rats and jck mice are not clear but suggest that different mechanisms are involved. Perhaps in jck mice, the more gradual onset of cystic disease allows preservation of peritubular capillaries until interstitial fibrosis and severe cyst enlargement at week 12. Further investigation is needed to determine the mechanisms behind peritubular capillary loss in both jck mice and LPK rats.
The onset of angiogenesis in both LPK rats and jck mice coincided with established cystic renal disease and peritubular capillary loss; being present as sporadic vessels in the interstitial space surrounding cysts starting at week 3 in LPK rats, and as random vessels in the epithelial lining surrounding cysts in week 4 jck mice. In jck mice, vascular malformations such as dilated capillaries, lengthened vasa recta and vessels within or surrounding the lining of cysts were increasingly present from the onset of established cystic kidney disease. In LPK rats, evidence of angiogenesis also coincided with established disease and included the appearance of dilated capillaries and outer medullary focal vascular networks. Kidney cyst growth requires a commensurate increase in nutrient supply, while also being subject to focal ischemia and fibrosis. The remodelling and expansion of the local microvasculature have been hypothesised to occur in PKD to meet the increased metabolic demands. In end-stage human ADPKD kidneys, vascular remodelling via angiogenesis was confirmed using angiography and corrosion cast microscopy, but it was unclear whether this was only a feature of late cystic renal disease.8,9
Angiogenesis can occur via sprouting or intussusception.9 The sprouting of new capillary buds from existing vessels depends on basement membrane degradation, endothelial cell proliferation and invasion of the connective tissue.29 By comparison, intussusception divides an existing vessel into two new vessels via insertion of a connective tissue pillar. In ADPKD, vascular invasion of the cyst lining is most likely via sprouting and this type of angiogenesis has been demonstrated in human ADPKD kidneys.9 It is also assumed that intussusception increases the density and complexity of vascular networks in PKD, but due to their fragile nature, the presence of intussusceptive tissue pillars have not been confirmed.9 This study did not discern the specific patterns of angiogenesis, which requires techniques such as angiography and corrosion cast microscopy.
The stimulus for angiogenesis in PKD could be increased metabolic demand from proliferating cystic epithelial cells combined with loss of peritubular capillaries, leading to relative and local hypoxia. Under hypoxic conditions, intracellular levels of HIF-α increase which in turn increases VEGF expression.8,25 In support of this hypothesis, in the present study the expression of HIF-α was increased in experimental PKD and is consistent with studies in other animal models of PKD showing increased VEGF and VEGF receptor expression in cystic epithelial cells and surrounding vessels.8,27 These data suggest that an increase in VEGF, secondary to hypoxia, is an important mechanism behind the angiogenesis observed in PKD and may contribute to continued cyst expansion (see Figure 10). In contrast, a study analysing serum markers of angiogenesis; angiopoietin-1 (Ang-1), Ang-2 and VEGF in human ADPKD at different stages of CKD showed only an increase of serum Ang-2 in early-stage (CKD 1–2) of ADPKD.30
The presence of sporadic vessels in the interstitial space and surrounding cysts, early in disease in the LPK and jck models suggest that inhibiting this process has potential to reduce nutrient supply to cystic cells and therefore slow progression of cystic disease. In this regard, sirolimus is a suppressor of kidney cyst growth in animal models of PKD, and has also previously demonstrated significant reduction of intra-tumoral microvessel density (MVD) in animal models of liver and colon cancer.16,17 The vascular smooth muscle changes that occur in ADPKD are in part mediated by the PI3K/Akt/mTOR signalling pathway which help in the phenotypic switch of the vascular smooth muscle cells to a dedifferentiated proliferative state. Sirolimus, which targets this pathway, may therefore prevent the dedifferentiation and proliferation therefore reducing the vascular plasticity. Further, the anti-angiogenic activity of mTOR inhibitors in tumor angiogenesis occurs also via inhibition of HIF1α in the tumor cells and by the mTOR inhibition in tumor-associated macrophages, which plays an important role in shaping the anti-angiogenic response in tumor angiogenesis.31
The present study suggests that the reduction in kidney enlargement with sirolimus (at does previously used to suppress renal cyst growth22) did not reduce the increase in vessels in LPK rats. This may be because of insufficient dose administered or alternatively that, unlike sprouting, intussusception is less dependent on endothelial cell proliferation and may be resistant to mTOR inhibition.17 Studies have shown that tumors are still able to maintain blood supply despite mTOR inhibition, suggesting the lack of anti-angiogenic effects by mTOR inhibitors and possible compensatory pathways for mTOR inhibition.31 This may be because of induction of compensatory pathways such as mitogen activated protein kinase (MAPK) activity which maintained angiogenesis.32
In conclusion, the results of the present study demonstrate that changes in microvasculature are common to both the LPK rat and jck mouse models of PKD, and that angiogenesis is a feature of disease. In addition, cyst expansion was also accompanied by peritubular capillary loss, and in LPK rats, this preceded the onset of interstitial fibrosis. Further studies should be undertaken to determine the expression of angiogenic markers and whether therapeutic inhibitors of angiogenesis might inhibit cyst expansion and can also prevent the regression of peritubular capillary loss.
Abbreviations
LPK, Lewis polycystic kidney; jck, juvenile cystic kidney; PKD, polycystic kidney disease; CECs, cystic epithelial cells; ADPKD, autosomal dominant polycystic kidney disease; ARPKD, autosomal recessive polycystic kidney disease; ESKD, end-stage kidney disease; TECs, tubular epithelial cells; VEGF, vascular endothelial growth factor; mTOR, mammalian target of rapamycin; NIMA, never in mitosis gene a; Nek8, NIMA-related kinase 8; ROI, region of interest; OSOM, outer stripe of the outer medulla; ISOM, inner stripe of the outer medulla; Ang-1, angiopoietin-1; MVD, microvessel density; MAPK, mitogen activated protein kinase.
Acknowledgments
This study was supported by the National Health and Medical Research Council of Australia (Project Grants 457757, 1164128) and a grant from PKD Australia (2018). J.Z. is supported by a Research Training Program Stipend from the University of Sydney.
Disclosure
Gopala Rangan reports grants from Danone Nutricia Research and Otsuka Australia, outside the submitted work. The authors report no other conflicts of interest.
References
1. Rizk DV, Chapman AB. 41 - polycystic and other cystic kidney diseases. In: Gilbert SJ, Weiner DE, editors. National Kidney Foundation Primer on Kidney Diseases (Sixth Edition). Philadelphia: W.B. Saunders; 2014:362–370.
2. Wilson PD. Polycystic kidney disease. N Engl J Med. 2004;350(2):151–164. doi:10.1056/NEJMra022161
3. Torres VE, Harris PC. Mechanisms of disease: autosomal dominant and recessive polycystic kidney diseases. Nat Clin Pract Nephrol. 2006;2(1):40–55. doi:10.1038/ncpneph0070
4. Patel V, Li L, Cobo-stark P, et al. Acute kidney injury and aberrant planar cell polarity induce cyst formation in mice lacking renal cilia. Hum Mol Genet. 2008;17(11):1578–1590. doi:10.1093/hmg/ddn045
5. Herzlinger D, Hurtado R. Patterning the renal vascular bed. Semin Cell Dev Biol. 2014;36:50–56. doi:10.1016/j.semcdb.2014.08.002
6. Moffat DB, Fourman J. A vascular pattern of the rat kidney. 1963. J Am Soc Nephrol. 2001;12(3):624–632.
7. Bankir L, De Rouffignac C. Urinary concentrating ability: insights from comparative anatomy. Am J Physiol Regul Integr Comp Physiol. 1985;18(6):R643–R666. doi:10.1152/ajpregu.1985.249.6.R643
8. Bello-Reuss E, Holubec K, Rajaraman S. Angiogenesis in autosomal-dominant polycystic kidney disease. Kidney Int. 2001;60(1):37–45. doi:10.1046/j.1523-1755.2001.00768.x
9. Wei W, Popov V, Walocha JA, Wen J, Bello-Reuss E. Evidence of angiogenesis and microvascular regression in autosomal-dominant polycystic kidney disease kidneys: a corrosion cast study. Kidney Int. 2006;70(7):1261–1268. doi:10.1038/sj.ki.5001725
10. Reed BY, Masoumi A, Elhassan E, et al. Angiogenic growth factors correlate with disease severity in young patients with autosomal dominant polycystic kidney disease. Kidney Int. 2011;79(1):128–134. doi:10.1038/ki.2010.355
11. Martins DP, Souza MA, Baitello ME, et al. Vascular endothelial growth factor as an angiogenesis biomarker for the progression of autosomal dominant polycystic kidney disease. Genet Mol Res. 2016;15(1). doi:10.4238/gmr.15017623.
12. Grantham JJ, Geiser JL, Evan AP. Cyst formation and growth in autosomal dominant polycystic kidney disease. Kidney Int. 1987;31(5):1145–1152. doi:10.1038/ki.1987.121
13. Raptis V, Bakogiannis C, Loutradis C, et al. Levels of Endocan, Angiopoietin-2, and Hypoxia-inducible factor-1a in patients with autosomal dominant polycystic kidney disease and different levels of renal function. Am J Nephrol. 2018;47(4):231–238. doi:10.1159/000488115
14. Ta MH, Schwensen KG, Foster S, et al. Effects of TORC1 inhibition during the early and established phases of polycystic kidney disease. PLoS One. 2016;11(10):e0164193. doi:10.1371/journal.pone.0164193
15. Zafar I, Ravichandran K, Belibi FA, Doctor RB, Edelstein CL. Sirolimus attenuates disease progression in an orthologous mouse model of human autosomal dominant polycystic kidney disease. Kidney Int. 2010;78(8):754–761. doi:10.1038/ki.2010.250
16. Guba M, von Breitenbuch P, Steinbauer M, et al. Rapamycin inhibits primary and metastatic tumor growth by antiangiogenesis: involvement of vascular endothelial growth factor.[see comment]. Nat Med. 2002;8(2):128–135. doi:10.1038/nm0202-128
17. Semela D, Piguet A-C, Kolev M, et al. Vascular remodeling and antitumoral effects of mTOR inhibition in a rat model of hepatocellular carcinoma. J Hepatol. 2007;46(5):840–848. doi:10.1016/j.jhep.2006.11.021
18. McCooke JK, Appels R, Barrero RA, et al. A novel mutation causing nephronophthisis in the Lewis polycystic kidney rat localises to a conserved RCC1 domain in Nek8. BMC Genomics. 2012;13(1):393. doi:10.1186/1471-2164-13-393
19. Phillips JK, Hopwood D, Loxley RA, et al. Temporal relationship between renal cyst development, hypertension and cardiac hypertrophy in a new rat model of autosomal recessive polycystic kidney disease. Kidney Blood Press Res. 2007;30(3):129–144. doi:10.1159/000101828
20. Smith LA, Bukanov NO, Husson H, et al. Development of polycystic kidney disease in juvenile cystic kidney mice: insights into pathogenesis, ciliary abnormalities, and common features with human disease. J Am Soc Nephrol. 2006;17(10):2821–2831. doi:10.1681/ASN.2006020136
21. Zhang JQJ, Burgess J, Stepanova D, et al. Role of cyclin-dependent kinase 2 on the progression of juvenile cystic kidney disease mice. Lab Invest. 2020. doi:10.1038/s41374-019-0360-4
22. Wahl PR, Serra AL, Le Hir M, Molle KD, Hall MN, Wuthrich RP. Inhibition of mTOR with sirolimus slows disease progression in Han: SPRD rats with autosomal dominant polycystic kidney disease (ADPKD). Nephrol Dial Transplant. 2006;21(3):598–604. doi:10.1093/ndt/gfi181
23. Nangaku M. Chronic hypoxia and tubulointerstitial injury: a final common pathway to end-stage renal failure. J Am Soc Nephrol. 2006;17(1):17–25. doi:10.1681/ASN.2005070757
24. Kang DH, Kanellis J, Hugo C, et al. Role of the microvascular endothelium in progressive renal disease. J Am Soc Nephrol. 2002;13(3):806–816. doi:10.1097/01.ASN.0000034910.58454.FD
25. Bernhardt WM, Wiesener MS, Weidemann A, et al. Involvement of hypoxia-inducible transcription factors in polycystic kidney disease. Am J Pathol. 2007;170(3):830–842. doi:10.2353/ajpath.2007.060455
26. Zeier M, Fehrenbach P, Geberth S, Mohring K, Waldherr R, Ritz E. Renal histology in polycystic kidney disease with incipient and advanced renal failure. Kidney Int. 1992;42(5):1259–1265. doi:10.1038/ki.1992.413
27. Tao Y, Kim J, Yin Y, et al. VEGF receptor inhibition slows the progression of polycystic kidney disease. Kidney Int. 2007;72(11):1358–1366. doi:10.1038/sj.ki.5002550
28. Rabelink TJ, Wijewickrama DC, de Koning EJ. Peritubular endothelium: the Achilles heel of the kidney? Kidney Int. 2007;72(8):926–930. doi:10.1038/sj.ki.5002414
29. Dome B, Hendrix MJC, Paku S, Tovari J, Timar J. Alternative vascularization mechanisms in cancer: pathology and therapeutic implications. Am J Pathol. 2007;170(1):1–15. doi:10.2353/ajpath.2007.060302
30. Coban M, Inci A. The association of serum angiogenic growth factors with renal structure and function in patients with adult autosomal dominant polycystic kidney disease. Int Urol Nephrol. 2018;50(7):1293–1300. doi:10.1007/s11255-018-1866-1
31. Faes S, Santoro T, Demartines N, Dormond O. Evolving significance and future relevance of anti-angiogenic activity of mTOR inhibitors in cancer therapy. Cancers. 2017;9(11):152. doi:10.3390/cancers9110152
32. Dormond-Meuwly A, Roulin D, Dufour M, Benoit M, Demartines N, Dormond O. The inhibition of MAPK potentiates the anti-angiogenic efficacy of mTOR inhibitors. Biochem Biophys Res Commun. 2011;407(4):714–719. doi:10.1016/j.bbrc.2011.03.086
 © 2020 The Author(s). This work is published and licensed by Dove Medical Press Limited. The full terms of this license are available at https://www.dovepress.com/terms.php and incorporate the Creative Commons Attribution - Non Commercial (unported, v3.0) License.
By accessing the work you hereby accept the Terms. Non-commercial uses of the work are permitted without any further permission from Dove Medical Press Limited, provided the work is properly attributed. For permission for commercial use of this work, please see paragraphs 4.2 and 5 of our Terms.
© 2020 The Author(s). This work is published and licensed by Dove Medical Press Limited. The full terms of this license are available at https://www.dovepress.com/terms.php and incorporate the Creative Commons Attribution - Non Commercial (unported, v3.0) License.
By accessing the work you hereby accept the Terms. Non-commercial uses of the work are permitted without any further permission from Dove Medical Press Limited, provided the work is properly attributed. For permission for commercial use of this work, please see paragraphs 4.2 and 5 of our Terms.