Back to Journals » Clinical Ophthalmology » Volume 20
Region-Specific Retinal and Choroidal Biomarkers Associated with Visual Outcomes After Anti-VEGF Treatment in Center-Involved Diabetic Macular Edema
Authors Qu Y ![]() , Wan H, Zhou H, Jiang X, Shi X, Xing X, Wei J, Shen Y, Liu K
, Wan H, Zhou H, Jiang X, Shi X, Xing X, Wei J, Shen Y, Liu K
Received 10 September 2025
Accepted for publication 17 December 2025
Published 12 January 2026 Volume 2026:20 566570
DOI https://doi.org/10.2147/OPTH.S566570
Checked for plagiarism Yes
Review by Single anonymous peer review
Peer reviewer comments 4
Editor who approved publication: Dr Yousef Fouad
Yuan Qu,1,2,* Hancong Wan,1,2,* Hao Zhou,1,2 Xujun Jiang,1,2 Xin Shi,1,2 Xindan Xing,1,2 Jin Wei,1,2 Yinchen Shen,1,2 Kun Liu1,2
1Department of Ophthalmology, Shanghai General Hospital, Shanghai Jiao Tong University School of Medicine, Shanghai, 200080, People’s Republic of China; 2National Clinical Research Center for Eye Diseases; Shanghai Key Laboratory of Ocular Fundus Diseases; Shanghai Engineering Center for Visual Science and Photomedicine; Shanghai Engineering Center for Precise Diagnosis and Treatment of Eye Diseases; Shanghai Clinical Research Center for Eye Diseases; Shanghai Key Clinical Specialty, Shanghai, 200080, People’s Republic of China
*These authors contributed equally to this work
Correspondence: Yinchen Shen, Email [email protected]
Objective: This investigation sought to: (1) characterize anti-vascular endothelial growth factor (VEGF) therapy-induced choroidal structural modifications in center-involved diabetic macular edema (CI-DME) utilizing swept-source optical coherence tomography (SS-OCT) imaging, and (2) assess the predictive capacity of choroidal morphometric indices for visual functional prognosis.
Methods and Analysis: This retrospective cohort study encompassed CI-DME patients received intravitreal anti-VEGF injections. Structural parameters, including retinal thickness, choroidal thickness, and choroidal vascularity index (CVI), were measured by SS-OCT pre- and post-treatment. Statistical evaluations included paired t-tests, Wilcoxon tests, Elastic Net regression, sensitivity analyses and prognostic analysis. Subgroup analysis was stratified by baseline characteristics.
Results: 58 eyes from 53 CI-DME patients were included. Following a single dose of anti-VEGF injection, logMAR BCVA improved significantly from 0.694 ± 0.342 to 0.614 ± 0.429 (P = 0.0103). Total choroidal volumes within the ETDRS grid decreased by 0.065 mm3 (P = 0.031). Retinal thickness significantly declined in all nine ETDRS subfields (P < 0.001), while choroidal thinning was most prominent in the central (mean deviation: – 17.42 μm, P < 0.001), nasal inner ring (mean deviation: – 15.10 μm, P = 0.0038), and nasal outer ring (mean deviation: – 11.83 μm, P = 0.0249) regions. Elastic Net regression and sensitivity analyses identified changes in central retinal thickness and nasal outer ring choroidal thickness as key imaging biomarkers associated with BCVA gains. Prognostic analysis revealed that baseline nasal inner ring retinal thickness showed most association with post-treatment central retinal thickness, whereas visual acuity outcomes were closely linked to age and baseline temporal outer ring retinal thickness. Exploratory subgroup analyses demonstrated that eyes with thicker retinas and thinner choroids at baseline, as well as younger patients, appeared to receive more favorable ocular structural and visual responses.
Conclusion: SS-OCT imaging revealed region-specific changes of the retinal and choroidal thickness after anti-VEGF treatment, providing a practical reference for monitoring and tracking therapeutic response in CI-DME.
Keywords: center-involved diabetic macular edema, anti-vascular endothelial growth factor therapy, swept-source optical coherence tomography, choroidal vascularity index
Introduction
Diabetic macular edema (DME), a principal contributor of visual impairment in patients with diabetic retinopathy (DR), is increasing in incidence with the global rise in diabetes prevalence.1–3 Although anti-vascular endothelial growth factor (anti-VEGF) therapy remains the primary treatment for center-involved DME (CI-DME), approximately 23–40% of patients in clinical trials demonstrate suboptimal therapeutic response with persistent or recurrent edema.4–7 Identifying biomarkers for visual prognosis is therefore essential to guide personalized treatment strategies.
Traditionally, the development of DME has been ascribed to retinal vascular leakage and neuroglial dysfunction.8–10 However, increasing attention has been directed toward the choroid, which serves as the main vascular supply for the outer retina.11–15 Advances in optical coherence tomography (OCT) have allowed for more detailed assessments of choroidal structure and perfusion. Recent studies have shown that the choroid, like the retina, undergoes thickness alterations, perfusion deficits, and vascular remodeling in patients with DME, especially in more advanced stages of DR.16–24
Compared to conventional spectral-domain OCT (SD-OCT), swept-source OCT (SS-OCT) offers enhanced tissue penetration and more consistent measurements of choroidal thickness (CT) and the choroidal vascularity index (CVI).25–27 Metrics such as subfoveal CT and CVI have emerged as promising imaging biomarkers for disease staging and treatment monitoring.28–31 Compared to subfoveal CT, CVI appears to be less influenced by systemic factors such as hypertension or fluid overload, and has been consistently observed to decline with increasing DR severity.29,31–33
Intravitreal pharmacotherapies for DME are currently the effective treatment for DME.34,35 SS-OCT has enabled detailed visualization and quantification of choroidal structure, providing new perspectives in the evaluation and monitoring of DME.33,36,37 However, the impact of anti-VEGF treatments on the choroid remain inconsistent. For instance, bevacizumab has been shown to reduce CVI, particularly in the subfoveal region,38 while ranibizumab primarily decreases subfoveal CT.39 Although subfoveal CT reduction occurs post-treatment, it shows no correlation with visual outcomes,40,41 whereas increased CT may indicate DME recurrence.42
In this study, we sought to characterize choroidal structural modifications after anti-VEGF treatment in CI-DME patients. We aimed to elucidate choroidal imaging biomarkers correlating with visual function and to explore whether baseline features may influence treatment response.
Materials and Methods
Study Population
This retrospective cohort study enrolled 53 patients (58 eyes) with CI-DME who received anti-VEGF intravitreal injections between July 2019 and December 2024 at Shanghai General Hospital, Shanghai Jiao Tong University School of Medicine. All participants completed comprehensive ophthalmological assessments during initial evaluation and follow-up visits. The research protocol was confirmed by the Ethics Committee of Shanghai General Hospital (http://www.chictr.org.cn/, Registration number: ChiCTR2000033074) and adhered strictly to the ethical standards established by the Declaration of Helsinki.
Patient and Public Involvement
All participants requiring anti-VEGF therapy for CI-DME were evaluated by senior ophthalmologists (Y.S. or K.L). Patients were informed that this study would assess retinal and choroidal alterations following a single intravitreal anti-VEGF administration, while standard CI-DME treatment typically requires multiple injections based on individual response. Signed informed consent was obtained after explaining the procedure’s risks and benefits.
Inclusion and Exclusion Criteria
All participants were enrolled based on the following inclusion criteria: (1) Age ≥18 years; (2) Han Chinese ethnicity; (3) Confirmed diagnosis of diabetes mellitus according to the American Diabetes Association standards (2018);43 (4) Diagnosis of CI-DME involving the foveal center, based on the Guidelines on Diabetic Eye Care (2018);3 (5) Completion of a single dose of anti-VEGF treatment and follow-up. Exclusion criteria included: (1) Presence of other macular pathologies (eg, retinal vein occlusion, age-related macular degeneration); (2) High myopia (spherical equivalent ≤-6.00 D) or hyperopia (≥+5.00 D); (3) Significant media opacities (eg, corneal opacity, dense cataract) that interfered with choroidal imaging; (4) Receipt of anti-VEGF therapy, laser photocoagulation, or intraocular steroid injections within 3 months prior to enrollment; (5) Pregnancy or breast-feeding; (6) Prior eye injuries or active ocular inflammation; (7) Any concurrent medical condition that, at the investigator’s clinical discretion, would compromise the subject’s eligibility for study participation.
Study Procedures
All the patients underwent intraocular pressure (IOP), best-corrected visual acuity (BCVA), slit-lamp biomicroscopy, fundus photographs and SS-OCT (DRI OCT-1 Atlantis, Topcon, Tokyo, Japan) at baseline. BCVA was initially measured using a standard international visual acuity chart and then converted to logMAR for statistical analysis.44 SS-OCT employed a 12-radial line scanning protocol focused on the fovea, with 15-degree intervals between scans. The scanning length (6mm, 9mm or 12mm) was selected according to the extent of the edema. All OCT acquisitions were conducted with pharmacologically dilated pupils under controlled mesopic illumination. The retinal senior specialists (Y.S. and K.L) confirmed the diagnosis and DR classification through comprehensive fundus and morphology evaluations, before performing the intravitreal anti-VEGF injections (Conbercept in 46 eyes, Aflibercept in 8 eyes and Ranibizumab in 4 eyes) in the operation room using topical anesthesia. Participants returned for their first follow-up visit (V1) post-injection, during which BCVA, IOP and SS-OCT were reassessed. All examinations were scheduled during morning hours (08:00–12:00) to control for potential confounding from circadian fluctuations.45,46 Data on all participants’ gender, age, type of diabetes, duration of diabetes, last fasting blood glucose (FBG), glycosylated hemoglobin (HbA1c) and triglycerides within 3 months were also recorded.
SS-OCT Examination and Image Analysis
Final analysis incorporated subjects whose OCT scans achieved quality scores exceeding 50. The scanning instrument automatically divided the macular area into nine subfields according to the Early Treatment Diabetic Retinopathy Study (ETDRS) criteria. The posterior pole of the retina was segmented into three concentric circles: a central subfield (diameter: 1000 μm), an inner ring (diameter: 3000 μm), and an outer ring (diameter: 6000 μm). The inner and outer rings were further subdivided into four quadrants: temporal, superior, nasal and inferior, resulting in a total of nine regions. In each subfield, the average retinal and choroidal thicknesses, along with total volumes, were automatically calculated.47 Retinal thickness corresponded to the distance from inner limiting membrane (ILM) to the upper boundary of the retinal pigment epithelial (RPE) layer. Choroidal measurements extended between Bruch’s membrane (BM) and the choroidal-scleral interface (CSI). Manual boundary correction was applied to rectify inaccurate layer segmentation in OCT scans.
CVI was derived using an established automated processing algorithm,48 which demonstrated a high level of agreement with manual segmentation by experienced clinicians.46 Binarization of the images was performed according to the method described by Sonoda et al,49 followed by semi-automated segmentation using a customized computational algorithm (Beijing Airdoc Technology Co., Ltd., Beijing, China).50 Post-processing quantification included measurements of total choroidal area (TCA), luminal area (LA), and stromal area (SA) within a region of interest (ROI). Although the scan size varied (6 mm, 9 mm, or 12 mm), the software automatically adjusted the pixel resolution to ensure a consistent physical ROI width (eg, 1000 μm). As a result, the actual measurement area remained standardized across all scan sizes, despite differences in visual appearance on screen. CVI was calculated as the ratio of LA to TCA46,49,50 and OCT parameters were measured by a single grader (H.W).
In patients with severe DME or central visual distortion, accurate foveal fixation was often compromised, making it difficult to align the foveal pit precisely at the center of the scan. Therefore, CVI measurements in such cases were limited to the central 1000-μm circle and the four inner ETDRS quadrants. For the central subfield (1000 μm diameter), as well as the nasal and temporal quadrants of the inner ring, horizontal B-scan images passing through both the fovea and optic disc were used. For the superior and inferior inner quadrants, vertical B-scan images perpendicular to the horizontal meridian were selected. In the central area, the ROI was defined as a 1000 µm-wide segment centered on the foveal pit. For the inner quadrants, the ROI extended from the foveal center to a width of 1500 μm, excluding the innermost 500 µm (corresponding to the radius of the central 1000 μm circle). The CVI for each inner quadrants was calculated using the following formula: CVI = (LA1500 µm – LA500 µm)/(TCA1500 µm – TCA500 µm), where LA and TCA denote the luminal and total choroidal areas, respectively. Eyes with poor CSI visibility after binarization were excluded from CVI analysis. The corresponding schematic diagrams for the analyses presented in this section were provided in Supplementary Figures 1 and 2A–D.
Statistical Analysis
Statistical computations were conducted utilizing R software (version 4.4.2, https://www.R-project.org/). Continuous variables were reported as mean ± standard deviation (SD), and categorical variables as counts (percentages). Normality of continuous data was assessed through Shapiro–Wilk test. For pre- and post-treatment comparisons, the paired t-test was employed for normally distributed parameters, while non-normal distributions were assessed with the Wilcoxon signed-rank test. Using G*Power (version 3.1.9.7), 35 eyes were required for pre–post comparisons (medium effect, α = 0.05, 80% power). Subsequent analyses of predictors for visual outcomes were conducted as exploratory.
For the primary analysis of visual acuity improvement, eye-level data were analyzed, treating each eye as an independent observation. Missing values were handled using multiple imputation by chained equations (MICE), and all pre- and post-treatment variables were standardized using Z-score transformation prior to calculating change scores. Elastic Net regression (α = 0.5) with 10-fold cross-validation was employed to explore the associations between changes in ocular parameters and improvements in visual acuity (logMAR change). To evaluate variable selection stability, the model-fitting procedure was repeated 100 times with bootstrap-resampled eye-level datasets, and selection frequency was calculated.
Sensitivity analyses tested the stability of the identified predictors under three conditions: using all available eyes, adjusting for anti-VEGF drug type, and restricting to one eye per participant (the eye with the greatest visual acuity improvement). These analyses used post-hoc linear regression models including variables selected by Elastic Net regression.
Two prognostic models were constructed to evaluate predictors of post-treatment outcomes. The visual acuity model was developed using the eye with the greatest BCVA improvement, whereas the central retinal thickness model used the eye showing the largest ETDRS central retinal thickness reduction. Candidate predictors were first screened in univariate analyses and then categorized into three domains: choroid-derived, retina-derived, and clinical variables (age, gender, and drug type). Within each domain, multicollinearity was assessed using variance inflation factors (VIF), and highly collinear variables were excluded, prioritizing those with stronger univariate associations. Given the limited sample size, 1–3 imaging parameters and 1–2 clinical variables were selected per domain. The selected variables were then combined into a final multivariable linear regression model. Model coefficients are reported as β estimates with standard errors (SE) and t-statistics, and model performance was assessed using R2, adjusted R2, mean absolute error (MAE), and root mean square error (RMSE) for visual acuity (logMAR) and retinal thickness (µm).
Subgroup analyses were conducted to explore differential responses based on baseline features. Baseline retinal and choroidal volumes relative to the cohort mean were used to categorize subjects into four anatomical groups: Group A: Thin choroid + Thin retina; Group B: Thin choroid + Thick retina; Group C: Thick choroid + Thin retina; Group D: Thick choroid + Thick retina. Standardized changes in ocular parameters were assessed using within-group paired tests. A heatmap was generated to visualize subgroup-level differences, with significance levels directly annotated. Statistical significance was set at P < 0.05.
Results
A total of 53 CI-DME patients (58 eyes) who received anti-VEGF therapy were enrolled in this study. The baseline demographic and clinical characteristics were recorded in Table 1. The retinal and choroidal parameters, as well as the changes of BCVA and IOP in each eye before and after treatment were shown in Table 2. Following a single dose of anti-VEGF treatment, visual acuity (LogMAR) showed statistically significant improvement (pre-treatment: 0.694 ± 0.342 vs post-treatment: 0.614 ± 0.429, P = 0.0103).
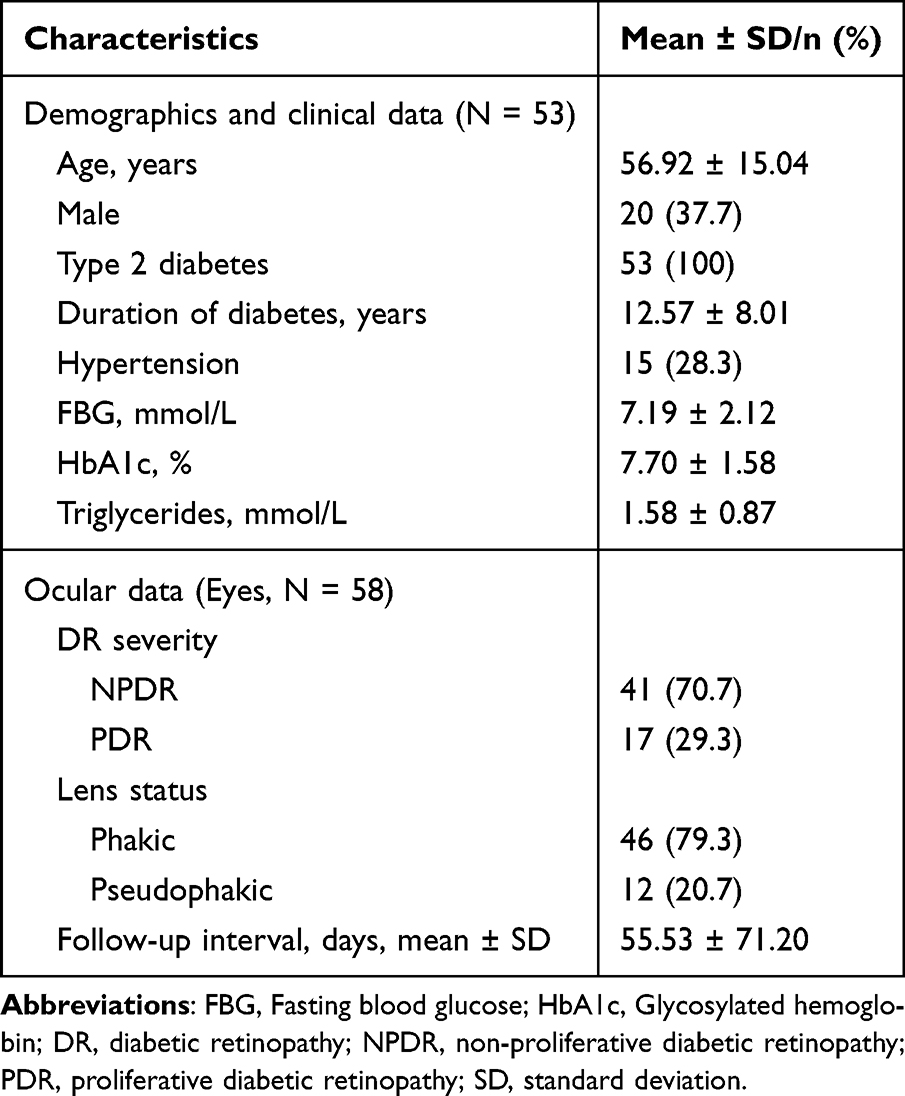 |
Table 1 Demographic and Clinical Characteristics of the Participants |
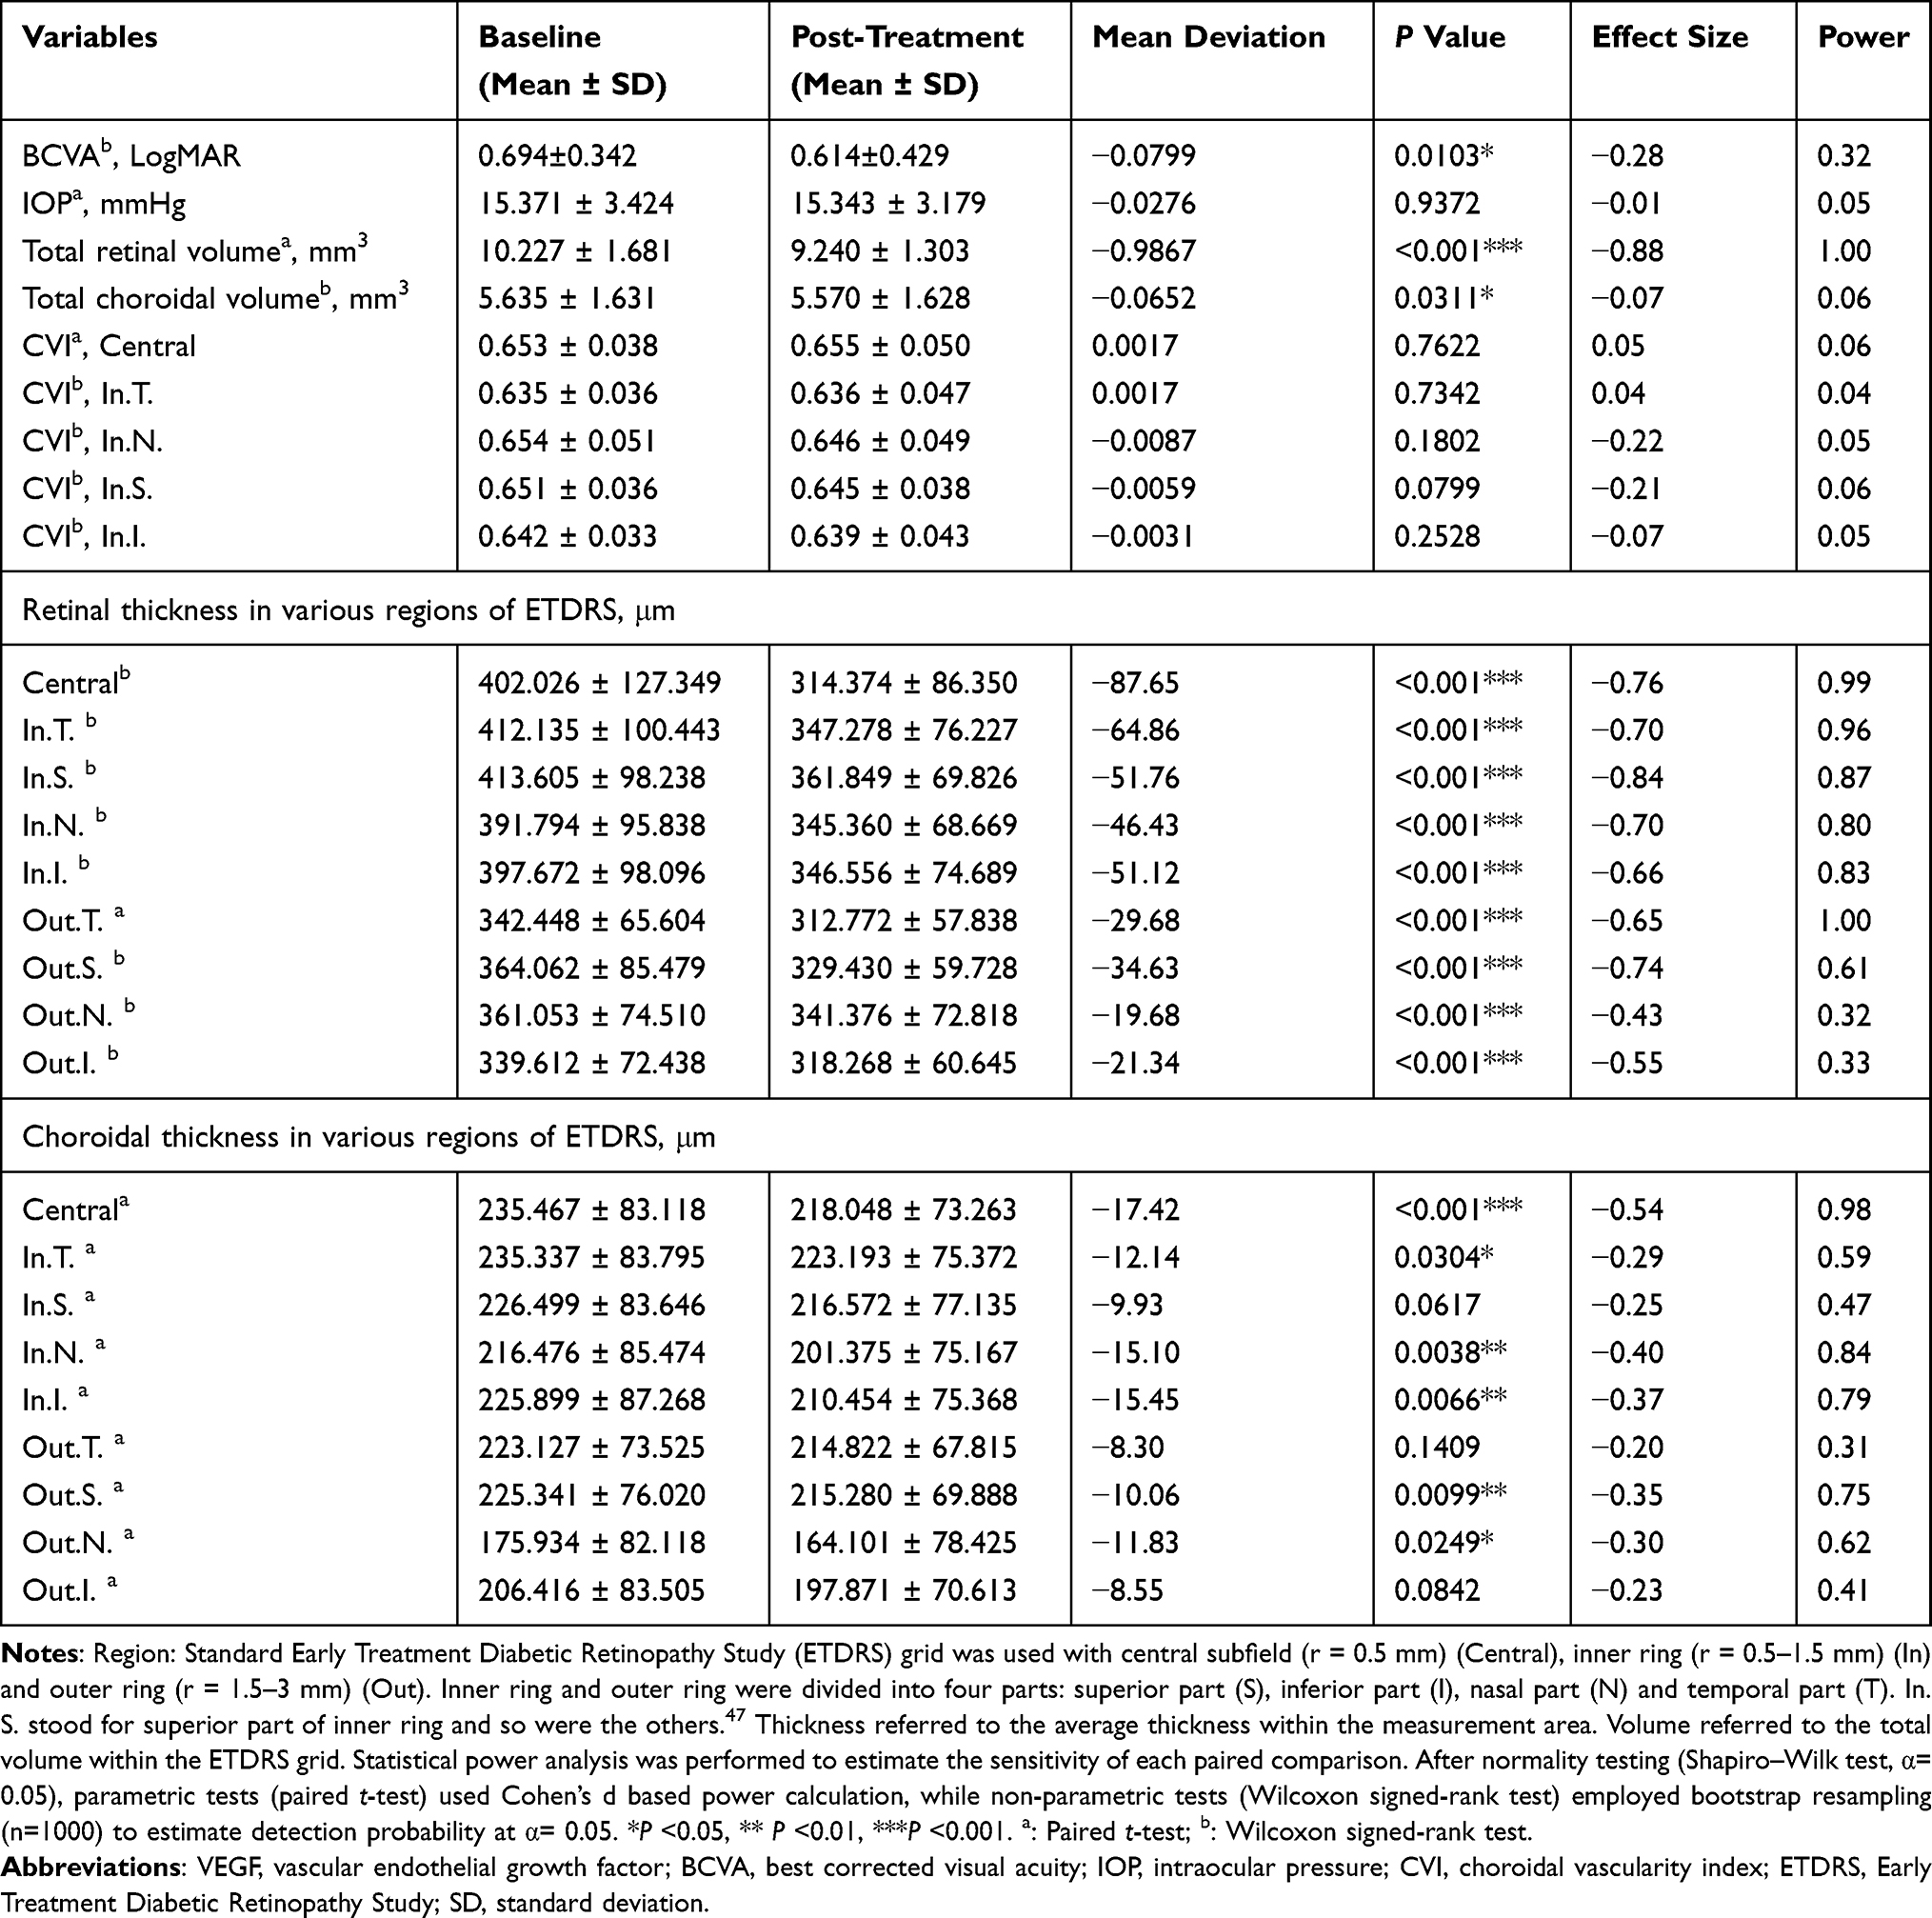 |
Table 2 Comparison of Visual Acuity, Intraocular Pressure, Retinal and Choroidal Parameters Before and After Anti-VEGF Treatment in Patients with Center-Involved Diabetic Macular Edema |
Comparison of Changes in Retinal and Choroidal Parameters Before and After Anti-VEGF Treatment
Both retinal and choroidal total volumes within the ETDRS grid demonstrated significant reductions (mean deviation, mm3: Retinal volume = –0.9867, P < 0.001; Choroidal volume = –0.0652, P = 0.0311). The mean retinal thickness displayed statistically significant decreases in all nine ETDRS subfields (P < 0.001), while the mean choroidal thickness exhibited significant thinning in six subfields (P < 0.05). The degree of retinal thinning progressively diminished from the central 1-mm ETDRS subfield toward the inner and outer rings, whereas no such spatial pattern was observed in the choroid. The most pronounced choroidal thinning occurred in the central 1-mm subfield (mean deviation: –17.42 μm, P < 0.001), with significant reductions also noted in the nasal inner (In.N. mean deviation: –15.10 μm, P = 0.0038) and nasal outer (Out.N. mean deviation: −11.83 μm, P = 0.0249) subfields. However, neither the CVI in the central and inner ETDRS subfields nor intraocular pressure (IOP) showed significant changes after treatment (Table 2).
Effect sizes and post-hoc power analysis were used to interpret the observed paired differences. Visual acuity improvement reached statistical significance but demonstrated a small effect size (–0.28) and limited power (0.32). In contrast, retinal total volume exhibited the largest treatment effect among all ocular parameters (effect size =–0.88; power = 1.00). Consistent with this finding, all nine ETDRS retinal subfields showed post-treatment thinning, with the central and inner subfields demonstrating moderate-to-large effects (effect size < –0.50; power > 0.80). Within the outer ring, the greatest magnitude of retinal thinning occurred in the superior part of outer ring (effect size = –0.74; power = 0.61), whereas the temporal part of outer ring showed the highest statistical power (effect size = –0.65; power = 1.00). For the choroid, all six subfields with significant thinning exhibited small-to-moderate effect sizes, with the largest observed in the central subfield (effect size = –0.54; power = 0.98) (Table 2).
These findings indicate that anti-VEGF therapy produced significant structural effects in the retina, whereas choroidal responses were present but more modest in magnitude.
Relationship Between Changes in Ocular Parameters and Visual Acuity After Anti-VEGF Treatment
Anti-VEGF therapy demonstrated dual therapeutic effects, simultaneously reducing retinal and choroidal thickness and volume while improving visual acuity in CI-DME. To identify the specific topographic patterns of structural changes associated with visual outcomes, we performed Elastic Net to screen for changes in retinal and choroidal parameters related to SS-OCT before and after treatment. These ocular parameters, which were most relevant to visual acuity changes, may be the key dynamic monitoring indicators that reflected the response to treatment.
Changes in six key parameters were initially identified as potential biomarkers of visual acuity changes: central retinal thickness, nasal outer ring choroidal thickness, nasal outer ring retinal thickness, nasal inner ring retinal thickness, temporal inner ring CVI, and superior inner ring CVI (Table 3 and Supplementary Figure 2E). Bootstrap stability testing with 100 resamples confirmed the reliability of three parameters, which were retained in >80% of resampled models: central retinal thickness, nasal outer ring choroidal thickness and nasal outer ring retinal thickness (Figure 1A). Reduction in retinal thickness within the central 1-mm ETDRS subfield showed the strongest positive association with logMAR improvement (β = 0.1205, Table 3 and Supplementary Figure 2E). Similarly, thickness reductions in the nasal outer retinal (β = 0.0493) and choroidal (β = 0.0995) subfields were also positively correlated with visual acuity gains (Table 3 and Supplementary Figure 2E). Scatterplot analysis with the equivalent linear regression fits demonstrated associations between six initially identified parameters and logMAR changes (Figure 1B). The directionality of these relationships, as indicated by the fitted trend lines (with 95% confidence intervals), aligned perfectly with their respective positive or negative coefficients shown in Table 3 and Supplementary Figure 2E. Among these, changes in four parameters demonstrated statistically significant positive correlations (P < 0.05) in linear models: central retinal thickness, nasal outer ring choroidal thickness, nasal outer ring retinal thickness and nasal inner retinal thickness.
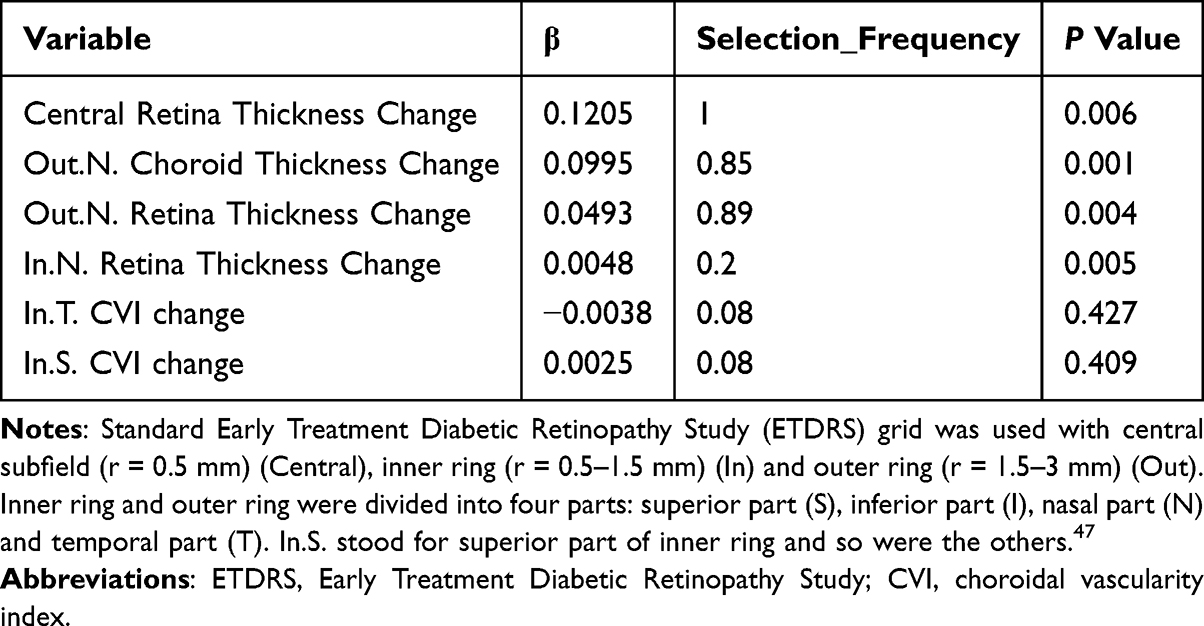 |
Table 3 Multivariate Analysis of Key Ocular Structural Parameters Related to Visual Acuity Gains |
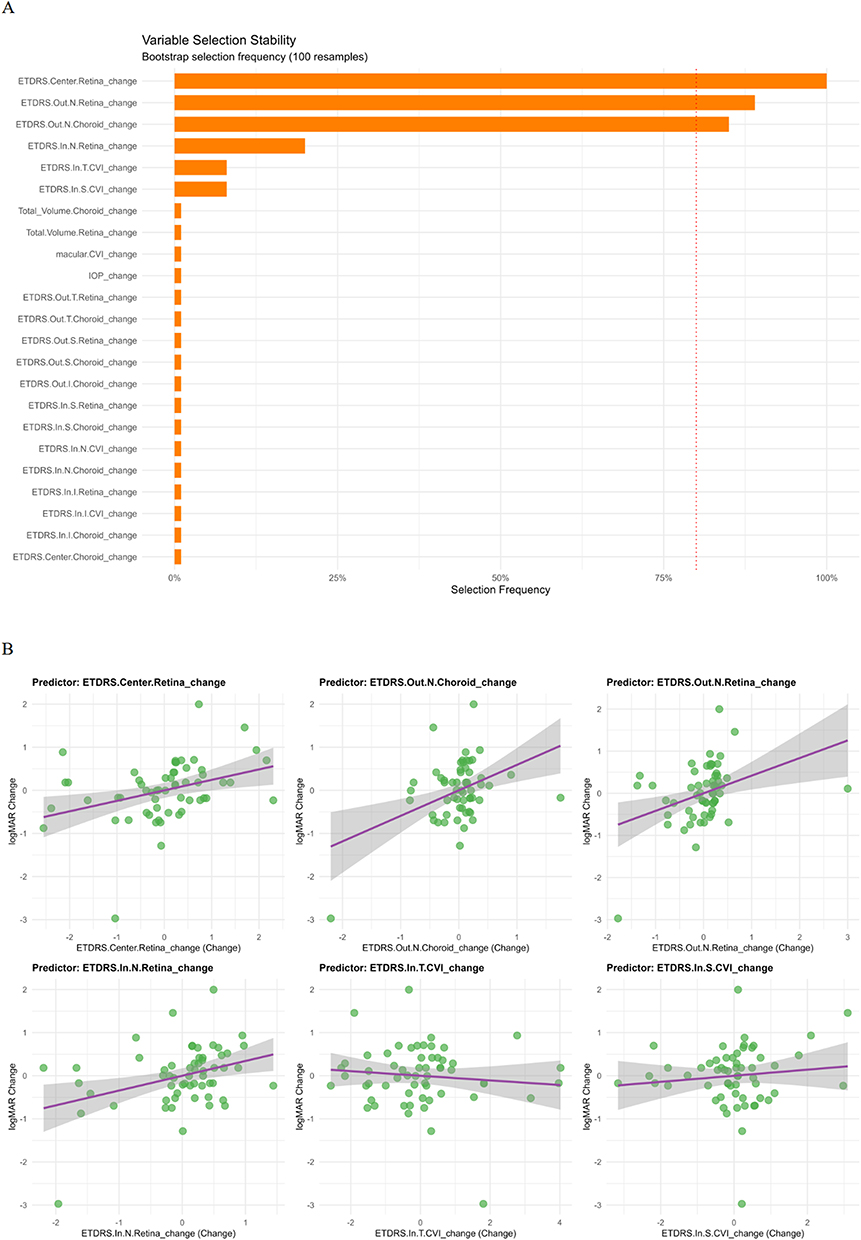 |
Figure 1 Key Ocular Parameters Related to Changes in Visual Acuity by Elastic-Net Regression. Analysis based on eye-level data (n = 58), treating each eye as an independent observation. (A) Variable-selection stability across 100 bootstrap repetitions. The red dashed line (80%) indicates the threshold for defining highly stable predictors. (B) Scatter plots for predictors that showed significant associations between six initially identified parameters and logMAR changes in the equivalent linear regression models. Regression lines and 95% confidence bands are displayed. Standard Early Treatment Diabetic Retinopathy Study (ETDRS) grid was used with central subfield (r = 0.5 mm) (Center), inner ring (In, r = 0.5–1.5 mm) and outer ring (Out, r = 1.5–3 mm). Inner ring and outer ring were divided into four parts: superior part (S), inferior part (I), nasal part (N) and temporal part (T). In.S. stood for superior part of inner ring and so were the others.47 Abbreviations: IOP, intraocular pressure; CVI, choroidal vascularity index; ETDRS, Early Treatment Diabetic Retinopathy Study. |
Across three sensitivity analyses—using all available eyes, adjusting for anti-VEGF drug type, and restricting to one eye per participant (the eye with the greatest BCVA improvement)—the relative importance of the six variables showed some variation. Across all sensitivity analyses, nasal outer ring choroidal thickness ranked first in importance, with central retinal thickness consistently among the top three predictors (Figure 1A and Supplementary Figure 2E–H).
These findings suggest that anatomical improvements in three specific regions (central retina, nasal outer ring choroid and nasal outer ring retina) show significant correlations with visual acuity gains. The consistent top ranking of the change of nasal outer ring choroidal thickness and central retinal thickness in sensitivity analyses further highlights that these two parameters may be more closely associated with visual acuity improvement than the other variables, supporting their potential clinical utility as SS-OCT-based biomarkers for monitoring anti-VEGF efficacy in CI-DME management.
Prognostic Analysis of Visual Acuity and Central Retinal Thickness
Building on the previous finding that changes in specific ocular imaging parameters were associated with visual acuity improvement, we investigated the prognostic value of baseline ocular parameters for visual acuity and central retinal thickness, respectively.
In the multivariable model of visual acuity, older age and thicker baseline temporal outer ring retinal thickness were significantly associated with poorer post-treatment visual acuity following a single dose of treatment. Specifically, each additional year of age predicted a 0.0124 increase in logMAR, and each 1 μm increase in temporal outer ring retinal thickness predicted a 0.0023 increase in logMAR (Table 4). These findings are supported by visual summaries, with predictive strength, model performance, and variable importance illustrated in Figure 2A–C. Variable importance analysis confirmed that age, temporal outer ring retinal thickness, and temporal inner ring CVI contributed most to visual acuity prediction. The model showed moderate explanatory and acceptable predictive performance (R2 = 0.291, adjusted R2 = 0.247; MAE = 0.288 logMAR, RMSE = 0.369 logMAR; Table 4), indicating that baseline age, temporal outer ring retinal thickness, and temporal inner ring CVI can meaningfully inform individualized visual prognosis (Figure 2A–C).
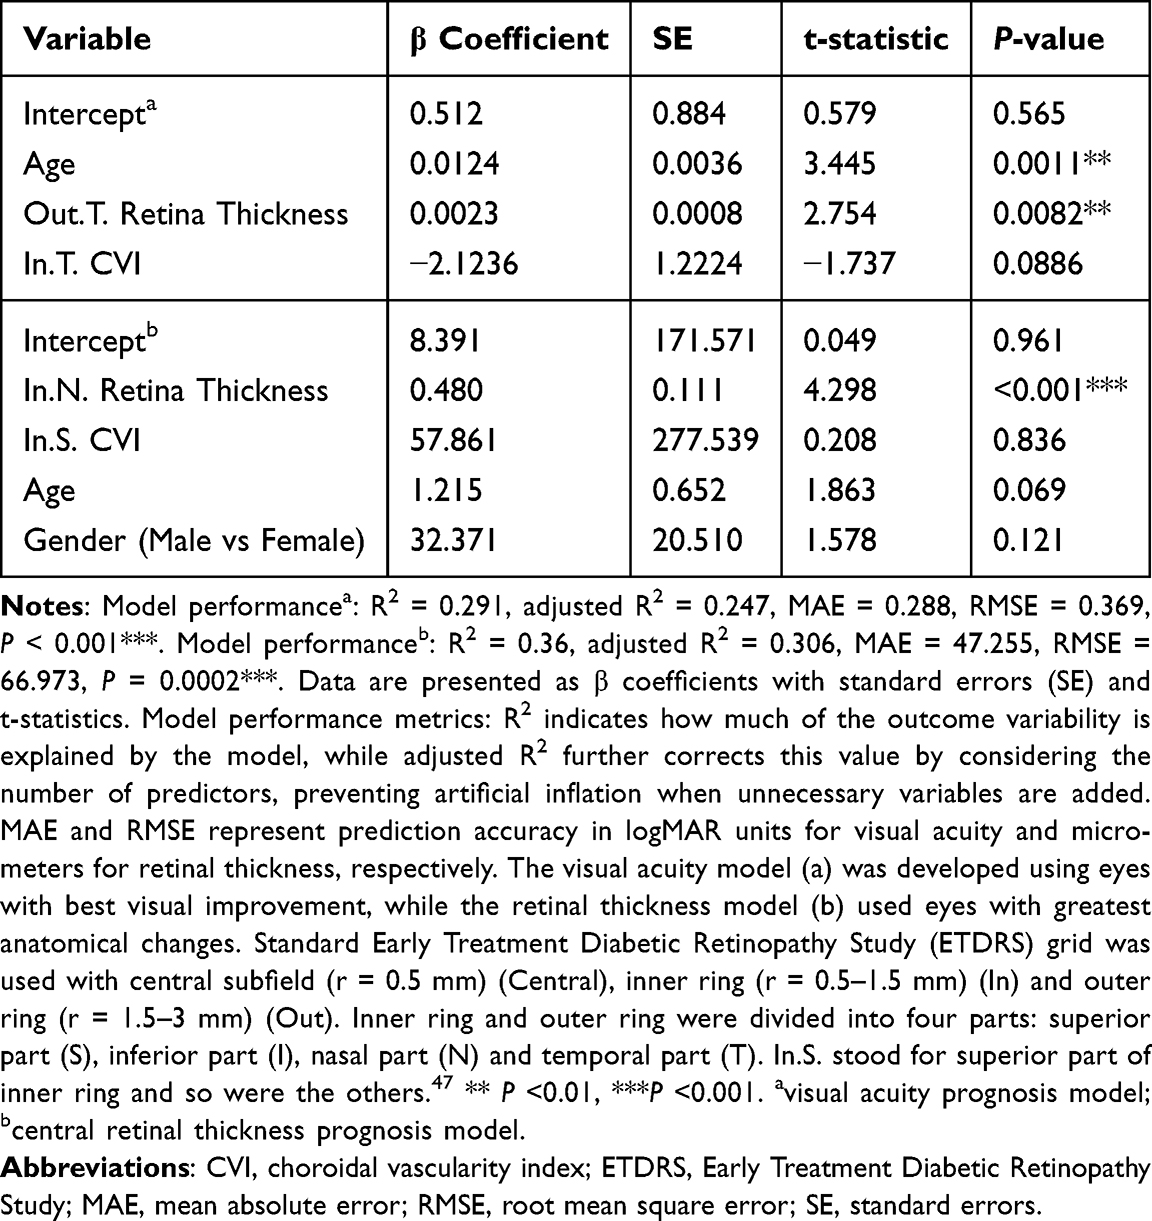 |
Table 4 Model Performance of Visual Acuity and Central Retinal Thickness by Multivariate Linear Model |
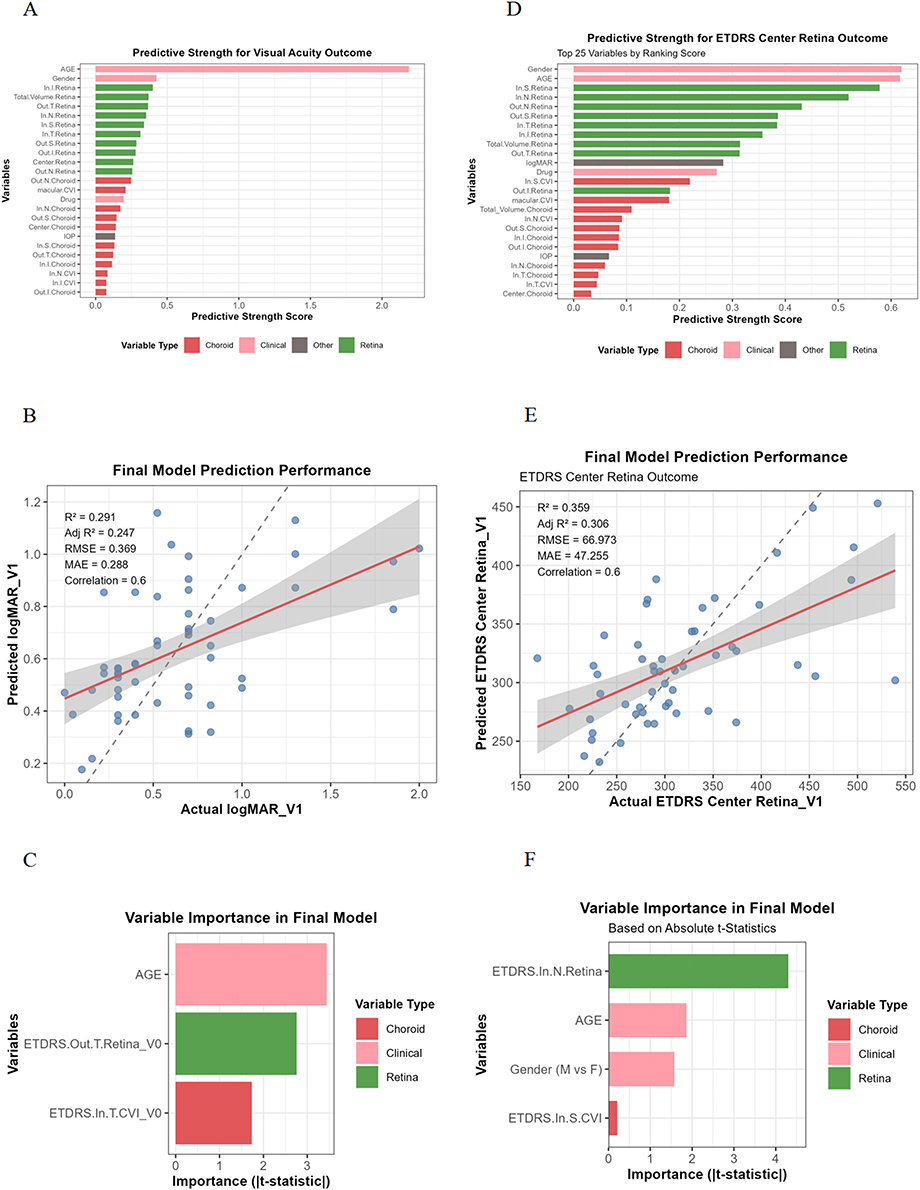 |
Figure 2 Prognostic Modeling of Visual Acuity and Central Retinal Thickness by Multivariate Linear Model. Analysis based on subject-level data from 53 participants (58 eyes initially), with one eye selected per participant to avoid interocular correlation. (A–C) Visual acuity prognosis model: for participants with bilateral data, the eye with greater visual acuity improvement was selected. (A) Predictive strength of baseline variables for visual acuity outcomes, (B) Prediction performance for visual acuity outcomes, (C) Variable importance in the final visual prognosis model. (D–F) ETDRS central retinal thickness prognosis model: for participants with bilateral data, the eye with greater ETDRS central retinal thickness reduction was selected. (D) Predictive strength of baseline variables for central retinal thickness changes, (E) Prediction performance for central retinal thickness outcomes, (F) Variable importance in the final thickness prognosis model. Standard Early Treatment Diabetic Retinopathy Study (ETDRS) grid was used with central subfield (r = 0.5 mm) (Central), inner ring (r = 0.5–1.5 mm) (In) and outer ring (r = 1.5–3 mm) (Out). Inner ring and outer ring were divided into four parts: superior part (S), inferior part (I), nasal part (N) and temporal part (T). In.S. stood for superior part of inner ring and so were the others.47 Abbreviations: CVI, choroidal vascularity index; IOP, intraocular pressure; ETDRS, EarlyTreatment Diabetic Retinopathy Study; RMSE, root mean square error; MAE, mean absolute error. |
In the multivariable model of central retinal thickness, thicker baseline nasal inner ring retinal thickness was significantly associated with higher post-treatment ETDRS central retinal thickness (Table 4), with each 1 μm increase in nasal inner ring retinal thickness predicting a 0.480 μm increase in post-treatment central retinal thickness. Other variables, including superior inner ring CVI, age, and gender, were not statistically significant. Variable importance analysis indicated that nasal inner ring retinal thickness was the dominant predictor of central retinal thickness outcomes. The model demonstrated moderate explanatory power and predictive performance (R2 = 0.36, adjusted R2 = 0.306; MAE = 47.255 μm, RMSE = 66.973 μm; Table 4 and Figure 2D–F).
These findings suggest that baseline retinal and choroidal structures, together with age, influence post-treatment visual acuity and central retinal thickness in CI-DME. Although baseline nasal inner ring retinal morphology was strongly associated with post-treatment central retinal thickness, visual acuity outcomes were influenced by regional retinal and choroidal features and age, indicating that structural improvements may not always translate directly into functional gains in CI-DME.
Exploratory Subgroup Analysis by Baseline Characteristics
To further explore factors associated with treatment response, patients were stratified into subgroups based on age and baseline ocular structure. For the age-based analysis, participants were divided at the cohort mean into low- and high-age groups. Both groups exhibited significant retinal thinning following anti-VEGF therapy. However, reductions in some choroidal parameters and visual improvements were observed only in the low-age group (Figure 3A). Comparative analysis between the two age groups revealed significant differences in visual acuity (logMAR), superior outer ring retinal thickness, and nasal outer ring retinal thickness changes (Figure 3B–D), with younger patients showing greater anatomical and functional improvements.
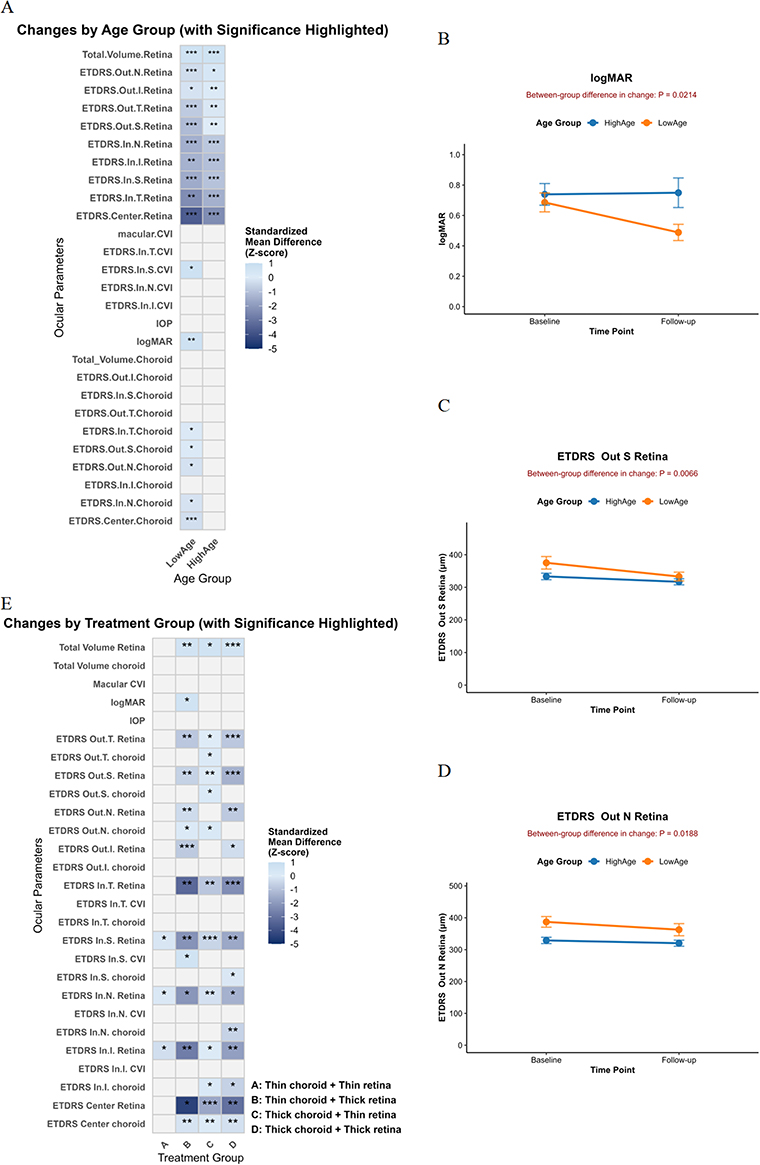 |
Figure 3 Subgroup Analysis of Treatment Response Based on Baseline Characteristics. (A) Heatmap displaying standardized mean differences (Z-scores) for ocular parameters showing significant within-group changes from baseline to follow-up in age-based subgroups. Color intensity represents standardized mean differences (Z-scores) only for significant variables. Asterisks denote significance levels from paired tests (*P<0.05, **P<0.01, ***P<0.001). (B–D) Line plots comparing measurements at baseline and follow-up for selected variables that showed significant intergroup differences between low (n=24) and high (n=29) age groups. Data points represent mean values, with error bars indicating standard error (SE) of the mean. (E) Subgroup analysis based on baseline choroidal and retinal volume combinations: A (thin choroid + thin retina, n=14), B (thin choroid + thick retina, n=11), C (thick choroid + thin retina, n=20), and D (thick choroid + thick retina, n=13). The heatmap shows standardized changes from baseline for variables showing significant within-group paired changes. Standard Early Treatment Diabetic Retinopathy Study (ETDRS) grid was used with central subfield (r = 0.5 mm) (Central), inner ring (r = 0.5–1.5 mm) (In) and outer ring (r = 1.5–3 mm) (Out). Inner ring and outer ring were divided into four parts: superior part (S), inferior part (I), nasal part (N) and temporal part (T). In.S. stood for superior part of inner ring and so were the others.47 Abbreviations: ETDRS, Early Treatment Diabetic Retinopathy Study; CVI, choroidal vascularity index; IOP, intraocular pressure. |
For the structure-based analysis, eyes were classified into four groups according to baseline total retinal and choroidal volumes relative to the mean: Group A: Thin choroid + Thin retina; Group B: Thin choroid + Thick retina; Group C: Thick choroid + Thin retina; Group D: Thick choroid + Thick retina. In Figure 3E, while all other groups demonstrated retinal thinning in the ETDRS center, inner ring and outer ring to varying extents following treatment, Group A (Thin choroid + Thin retina) was characterized by a more limited response, with significant reduction confined to selected areas within the inner ring (superior, inferior and nasal parts). In terms of choroidal treatment response, a significant reduction in choroidal thickness was documented in the central ETDRS region and inner inferior ring, primarily in groups with thicker baseline choroidal volume (Groups C and D). Notably, Group C (Thick choroid + Thin retina) also demonstrated a significant choroidal thickness reduction within the outer ring regions (nasal, superior and temporal), whereas in Group D (Thick choroid + Thick retina), the decrease was mainly confined to specific areas of the inner ring (nasal and superior). Group B (Thin choroid + Thick retina), which showed the most significant improvement in visual acuity after treatment, also exhibited a localized decrease in CVI at the inner superior ring of the ETDRS grid. Comparative analysis revealed no significant treatment-induced variations among the four groups in total choroidal volume, IOP, choroidal thickness at the outer inferior and inner temporal rings, as well as in the CVI across all inner regions except for the superior inner ring of the ETDRS grid.
These exploratory analyses indicate that baseline retinal and choroidal characteristics, as well as age, may affect the extent and distribution of anatomical and functional responses to anti-VEGF therapy in CI-DME, highlighting the potential utility of these parameters for patient stratification and personalized monitoring.
Discussion
Our real-world investigation was designed to assess the early response to a single anti-VEGF administration in CI-DME patients. We selected this timepoint because, in routine practice, some patients do not complete the loading dose of three injections, unlike in randomized controlled trials where protocols are strictly enforced. By including both treatment-naïve individuals and those who had not received treatment for at least three months, we aimed to capture a more generalizable initial treatment effect.
Our findings observed significant anatomical and functional improvements, characterized by reductions in both retinal and choroidal thickness and volume, as well as a modest but statistically significant improvement in visual acuity. We also identified specific retinal and choroidal subfields in which post-treatment alterations were significantly correlated with visual improvement. Among these, reductions in central retinal thickness, nasal outer ring choroidal thickness, and nasal outer ring retinal thickness emerged as the most effective imaging biomarkers associated with visual acuity gains. The effect size analysis further supported that retinal structural restoration, particularly within the central and inner ETDRS regions, was the most stable anatomical response to treatment, whereas choroidal thinning was present but more modest, indicating differential tissue response. In addition, Elastic Net regression and sensitivity analyses identified changes in central retinal thickness and nasal outer ring choroidal thickness as the variables most strongly associated with visual improvement, suggesting their potential value as dynamic SS-OCT indicators for monitoring anatomical and functional responses.
Although visual function improved, with BCVA (logMAR) changing significantly from 0.694 ± 0.342 to 0.614 ± 0.429 (P = 0.0103), the magnitude of change was modest. Therefore, we focused on both visual and structural improvements. This approach allowed us to assess treatment response from multiple perspectives and examine how baseline characteristics relate to both functional and anatomical changes. Our analysis indicated that baseline region-specific retinal and choroidal characteristics, along with age, contribute to post-treatment outcomes in CI-DME. Baseline nasal inner ring retinal thickness was closely associated with post-treatment central retinal thickness, whereas visual acuity outcomes were more correlated with baseline temporal outer ring retinal thickness, temporal inner ring CVI and age. These observations suggest a potential dissociation between structural and functional responses, indicating that region-specific retinal and choroidal features may be differentially related to visual and anatomical outcomes in CI-DME.
Exploratory subgroup analyses provided additional insights. Eyes with thicker retina and thinner choroid at baseline showed more favorable anatomical and functional responses after treatment. Additionally, younger patients exhibited more structural changes—including both retinal and choroidal improvements—alongside better visual gains. In contrast, older patients displayed less choroidal changes and less visual improvement, suggesting that age-related tissue characteristics may influence early treatment response. It should be noted, however, that these age-based comparisons were derived from within-group pre-post treatment analyses; between-group differences were only observed in changes in visual acuity and retinal thickness in the superior outer and nasal outer subfields, with considerable individual-level variation noted in these metrics (Supplementary Figure 2I–K).
Exploratory subgrouping by baseline retinal and choroidal volumes within ETDRS regions suggested that regional structural characteristics may be associated with differential anatomical responses to anti-VEGF therapy. These findings align with prior reports demonstrating that DME patients with thinner choroids at baseline exhibit superior post-treatment improvements in BCVA and macular thickness, compared to those with thicker choroids.51 Although these analyses are exploratory due to small sample sizes, they may inform future strategies for individualized monitoring and prognostication based on baseline ocular anatomy.
These results reinforce previous evidence indicating that anti-VEGF therapy can induce choroidal change, particularly in the subfoveal region.38,39,52 However, the prognostic significance of choroidal thickness remains debated. While some investigations suggested that post-treatment reductions in subfoveal CT did not correlate with visual acuity outcomes,40,41 others showed that greater baseline subfoveal CT predicts superior short-term visual and anatomical outcomes.53,54 Savur et al55 reported that although central macular thickness and BCVA improved significantly after intravitreal anti-VEGF injections, central choroidal thickness did not exhibit a statistically significant decrease. Our results suggest that anatomical response may be location-specific and dependent on the interplay between retinal edema severity and choroidal perfusion status.
Interestingly, post-treatment changes in visual acuity were observed to relate to concurrent changes in the nasal outer ring choroidal and retinal thickness. This aligns with OCT angiography studies showing that deep vascular density reductions post-anti-VEGF were most prominent in the nasal deep capillary plexus, highlighting the regional vulnerability and therapeutic response of nasal structures.56,57 These findings are further supported by evidence from pediatric populations, in which increased choroidal thickness in the perifoveal nasal outer and para-inferior inner rings was observed in diabetic children without retinopathy, suggesting a potential role of these regions in early-stage diabetic changes.58 Given the choroid’s role in supporting outer retinal metabolism,11–15 such localized remodeling may reflect a compensatory or restorative response to anti-VEGF-induced vascular normalization. Despite the observed choroidal thinning, CVI remained relatively unchanged in most inner ETDRS subfields after treatment. This discrepancy may be attributed to the stability of vascular-to-stromal ratio despite the reduction in overall choroidal thickness, supporting previous findings that CVI is a more stable index compared to CT and less influenced by short-term physiological fluctuations.28,29,37
This research has several limitations. The retrospective nature of the analysis and limited sample size may affect the validity of the results. The wide variation in follow-up time may also have influenced the assessment of treatment response dynamics. Furthermore, the single follow-up timepoint precludes evaluation of longer-term structural and functional outcomes. Although SS-OCT offers high-resolution structural imaging, it does not evaluate microvascular perfusion, which would require complementary techniques such as OCT angiography. Although our cohort included different anti-VEGF agents, both sensitivity analyses adjusting for drug type and multivariable prognostic models showed that the choice of anti-VEGF agent did not substantially affect the main findings. Future studies with larger, drug-stratified cohorts are needed to validate these results.
Despite these limitations, our study offers real-world insights into the early structural and functional responses following initial anti-VEGF administration. Our findings suggest a two-phase process: while widespread structural improvement is predicted by baseline factors like region-specific choroidal and retinal thickness and age, the translation of this anatomical benefit into visual gains appears to depend on treatment-induced reductions in both central retinal and nasal outer choroidal thickness. This distinction underscores the value of monitoring SS-OCT parameters correlated with visual improvement. While this combined approach of tracking dynamic and baseline parameters may not capture every treatment responder, it nonetheless provides a practical and nuanced reference for monitoring and tracking therapeutic response over time. Furthermore, by integrating these SS-OCT-derived structural parameters with patient-specific factors such as age, these features could serve as valuable inputs for future algorithms aimed at predicting individual treatment response.
Conclusions
In summary, our SS-OCT-based study showed that a single anti-VEGF injection led to morphological retinal and choroidal changes in CI-DME. Among these alterations, reductions in central retinal thickness and in nasal outer ring choroidal thickness demonstrated the strongest associations with visual acuity improvement, suggesting their potential utility as treatment-response indicators. Baseline predictors of post-treatment structure and function differed: post-treatment central retinal thickness was mainly linked to baseline nasal inner ring retinal thickness, whereas visual outcomes were more closely related to baseline temporal outer ring retinal thickness and age. These outcomes may help explain why anatomical recovery does not always accompany equivalent visual gains. While these findings provide a practical reference for tracking anatomical and functional changes, further prospective studies incorporating longitudinal design and multimodal imaging are warranted to validate their clinical applicability and predictive value.
Abbreviations
CI-DME, Center-involved diabetic macular edema; CVI, Choroidal vascularity index; ETDRS, Early Treatment Diabetic Retinopathy Study; MAE, Mean absolute error; RMSE, Root mean square error; SS-OCT, Swept-source optical coherence tomography; VEGF, Vascular endothelial growth factor.
Ethics Approval and Consent to Participate
This study was approved by the Ethics Committee of Shanghai General Hospital, Shanghai Jiao Tong University School of Medicine and registered on www.chictr.org.cn (Registration number: ChiCTR2000033074).
Consent for Publication
Written informed consent was obtained from all participants.
Acknowledgments
The authors thank Professor Xun Xu, Director of National Clinical Research Center for Eye Diseases, Shanghai Key Laboratory of Ocular Fundus Diseases, Shanghai, China, for his help to this study.
Author Contributions
All authors made a significant contribution to the work reported, whether that is in the conception, study design, execution, acquisition of data, analysis and interpretation, or in all these areas; took part in drafting, revising or critically reviewing the article; gave final approval of the version to be published; have agreed on the journal to which the article has been submitted; and agree to be accountable for all aspects of the work.
Funding
This work was supported by Bethune•Lumitin Young and Middle-aged Ophthalmic Research Fund under (Grant No. BJ-LM2021010J), Innovative Pharmaceutical and Medical Device Products Application Project of Shanghai Science and Technology Commission (25SF1907102), the National Natural Science Foundation of China (82471109) and National Clinical Key Specialty Construction Project (10000015Z155080000004).
Disclosure
The authors report no conflicts of interest in this work.
References
1. VanderBeek BL, Yu Y, Cardillo S, et al. Twenty-year trends in prevalence and incidence of diabetic retinal disease. Ophthalmology. 2025;132(7):767–16. doi:10.1016/j.ophtha.2025.01.022
2. Lundeen EA, Kim M, Rein DB, et al. Trends in the prevalence and treatment of diabetic macular edema and vision-threatening diabetic retinopathy among commercially insured adults aged <65 years. Diabetes Care. 2023;46(4):687–696. doi:10.2337/dc22-1834
3. Wong TY, Sun J, Kawasaki R, et al. Guidelines on diabetic eye care: the international council of ophthalmology recommendations for screening, follow-up, referral, and treatment based on resource settings. Ophthalmology. 2018;125(10):1608–1622. doi:10.1016/j.ophtha.2018.04.007
4. Madjedi K, Pereira A, Ballios BG, et al. Switching between anti-VEGF agents in the management of refractory diabetic macular edema: a systematic review. Survey Ophthalmol. 2022;67(5):1364–1372. doi:10.1016/j.survophthal.2022.04.001
5. Baker CW, Glassman AR, Beaulieu WT, et al. Effect of initial management with aflibercept vs laser photocoagulation vs observation on vision loss among patients with diabetic macular edema involving the center of the macula and good visual acuity. JAMA. 2019;321(19):1880. doi:10.1001/jama.2019.5790
6. Bressler SB, Ayala AR, Bressler NM, et al. Persistent macular thickening after ranibizumab treatment for diabetic macular edema with vision impairment. JAMA Ophthalmol. 2016;134(3):278–285. doi:10.1001/jamaophthalmol.2015.5346
7. Blinder KJ, Dugel PU, Chen S, et al. Anti-VEGF treatment of diabetic macular edema in clinical practice: effectiveness and patterns of use (ECHO Study Report 1). Clin Ophthalmol. 2017;11:393–401. doi:10.2147/OPTH.S128509
8. Romero-Aroca P, Baget-Bernaldiz M, Pareja-Rios A, et al. Diabetic macular edema pathophysiology: vasogenic versus inflammatory. J Diabetes Res. 2016;2016:2156273. doi:10.1155/2016/2156273
9. Starace V, Battista M, Brambati M, et al. The role of inflammation and neurodegeneration in diabetic macular edema. Ther Adv Ophthalmol. 2021;13:25158414211055963. doi:10.1177/25158414211055963
10. Duh EJ, Sun JK, Stitt AW. Diabetic retinopathy: current understanding, mechanisms, and treatment strategies. JCI Insight. 2017;2(14). doi:10.1172/jci.insight.93751
11. Talu S, Nicoara SD. Malfunction of outer retinal barrier and choroid in the occurrence and progression of diabetic macular edema. World J Diabetes. 2021;12(4):437–452. doi:10.4239/wjd.v12.i4.437
12. Damian I, Roman G, Nicoara SD. Analysis of the choroid and its relationship with the outer retina in patients with diabetes mellitus using binarization techniques based on spectral-domain optical coherence tomography. J Clin Med. 2021;10(2):210. doi:10.3390/jcm10020210
13. Pilotto E, Cosmo E, Torresin T, et al. Outer retinal and choroidal changes in adolescents with long-lasting type 1 diabetes. J Clin Med. 2023;13(1):229. doi:10.3390/jcm13010229
14. Endo H, Kase S, Takahashi M, et al. Relationship between diabetic macular edema and choroidal layer thickness. PLoS One. 2020;15(1):e0226630. doi:10.1371/journal.pone.0226630
15. Jiang J, Liu J, Yang J, et al. Optical coherence tomography evaluation of choroidal structure changes in diabetic retinopathy patients: a systematic review and meta-analysis. Front Med Lausanne. 2022;9:986209. doi:10.3389/fmed.2022.986209
16. Fernández-Espinosa G, Orduna-Hospital E, Boned-Murillo A, et al. Choroidal and retinal thicknesses in type 2 diabetes mellitus with moderate diabetic retinopathy measured by swept source OCT. Biomedicines. 2022;10(9):2314. doi:10.3390/biomedicines10092314
17. Hamadneh T, Aftab S, Sherali N, et al. Choroidal changes in diabetic patients with different stages of diabetic retinopathy. Cureus. 2020. doi:10.7759/cureus.10871
18. Xu F, Li Z, Yang X, et al. Assessment of choroidal structural changes in patients with pre- and early-stage clinical diabetic retinopathy using wide-field SS-OCTA. Front Endocrinol. 2022;13:1036625. doi:10.3389/fendo.2022.1036625
19. Rezende MP, Faria FA, Beraldo DP, et al. Prospective and dichotomous study of biomarkers with swept-source OCT and OCT-angiography in naive patients with diabetic macular edema. Int J Retina Vitreous. 2025;11(1):51. doi:10.1186/s40942-025-00672-7
20. Wang XN, Cai X, Li SW, et al. Wide-field swept-source OCTA in the assessment of retinal microvasculature in early-stage diabetic retinopathy. BMC Ophthalmol. 2022;22(1):473. doi:10.1186/s12886-022-02724-0
21. Borrelli E, Battista M, Sacconi R, et al. Optical coherence tomography angiography in diabetes. Asia-Pac J Ophthalmol. 2021;10(1):20–25. doi:10.1097/apo.0000000000000351
22. Abadia B, Bartol-Puyal FA, Calvo P, et al. Mapping choroidal thickness in patients with type 2 diabetes. Can J Ophthalmol. 2020;55(1):45–51. doi:10.1016/j.jcjo.2019.06.009
23. Wang JC, Laíns I, Providência J, et al. Diabetic choroidopathy: choroidal vascular density and volume in diabetic retinopathy with swept-source optical coherence tomography. Am J Ophthalmol. 2017;184:75–83. doi:10.1016/j.ajo.2017.09.030
24. Wu Y, Jiang J, Deng X, et al. Early detection of retinal and choroidal microvascular impairments in diabetic patients with myopia. Front Cell Dev Biol. 2025;13:1609928. doi:10.3389/fcell.2025.1609928
25. Sanjana Chouhan S, Neelamegam V, Raghu K, et al. Diagnostic utility of swept-source OCT-based biometry and fundus photographs compared to spectral domain OCT in center-involving diabetic macular edema. Ophthalmic Epidemiol. 2025;32(1):95–102. doi:10.1080/09286586.2024.2338824
26. Sala-Puigdollers A, Figueras-Roca M, Hereu M, et al. Repeatability and reproducibility of retinal and choroidal thickness measurements in diabetic macular edema using swept-source optical coherence tomography. PLoS One. 2018;13(7):e0200819. doi:10.1371/journal.pone.0200819
27. Min JK, Lee S, Kim JS, et al. Effects of diabetic macular edema on repeatability of retinal nerve fiber layer thickness measurements at the macular and peripapillary area using swept-source optical coherence tomography. Curr Eye Res. 2017;42(2):307–314. doi:10.3109/02713683.2016.1170855
28. Dou N, Yu S, Tsui CK, et al. Choroidal vascularity index as a biomarker for visual response to antivascular endothelial growth factor treatment in diabetic macular edema. J Diabetes Res. 2021;2021:3033219. doi:10.1155/2021/3033219
29. Gupta C, Tan R, Mishra C, et al. Choroidal structural analysis in eyes with diabetic retinopathy and diabetic macular edema—A novel OCT based imaging biomarker. PLoS One. 2018;13(12):e0207435. doi:10.1371/journal.pone.0207435
30. Wang W, Li L, Wang J, et al. Macular choroidal thickness and the risk of referable diabetic retinopathy in type 2 diabetes: a 2-year longitudinal study. Invest Ophthalmol Vis Sci. 2022;63(4):9. doi:10.1167/iovs.63.4.9
31. Nicolini N, Tombolini B, Barresi C, et al. Assessment of diabetic choroidopathy using ultra-widefield optical coherence tomography. Transl Vis Sci Technol. 2022;11(3):35. doi:10.1167/tvst.11.3.35
32. Han R, Chang W, Ding X, et al. The choroid vascular index and its association with visual acuity in children and young adults with high myopia. Eye. 2023;37(12):2542–2547. doi:10.1038/s41433-022-02369-9
33. Sadeghi E, Du K, Ajayi O, et al. Three-dimensional choroidal vessels assessment in diabetic retinopathy. Invest Ophthalmol Vis Sci. 2025;66(3):50. doi:10.1167/iovs.66.3.50
34. Flaxel CJ, Adelman RA, Bailey ST, et al. Diabetic retinopathy preferred practice pattern(R). Ophthalmology. 2020;127(1):P66–P145. doi:10.1016/j.ophtha.2019.09.025
35. Ehlers JP, Yeh S, Maguire MG, et al. Intravitreal pharmacotherapies for diabetic macular edema. Ophthalmology. 2022;129(1):88–99. doi:10.1016/j.ophtha.2021.07.009
36. Abadia B, Suñen I, Calvo P, et al. Choroidal thickness measured using swept-source optical coherence tomography is reduced in patients with type 2 diabetes. PLoS One. 2018;13(2):e0191977. doi:10.1371/journal.pone.0191977
37. Obadă O, Pantalon AD, Rusu-Zota G, et al. Choroidal assessment in patients with type 2 diabetes mellitus and non-proliferative diabetic retinopathy by swept-source ocular coherence tomography and image binarization. Medicina. 2022;58(7):918. doi:10.3390/medicina58070918
38. Toprak A, Koc H, Alpay A, et al. The effect of intravitreal anti-VEGF injections on choroidal vascular index in patients with diabetic macular edema. Cutan Ocul Toxicol. 2024;43(3):204–210. doi:10.1080/15569527.2024.2380325
39. Wang X-N, Cai X, He S, et al. Subfoveal choroidal thickness changes after intravitreal ranibizumab injections in different patterns of diabetic macular edema using a deep learning-based auto-segmentation. Intl Ophthalmol. 2021;43(12):4399–4407. doi:10.1007/s10792-021-01806-0
40. Yiu G, Manjunath V, Chiu SJ, et al. Effect of anti-vascular endothelial growth factor therapy on choroidal thickness in diabetic macular edema. Am J Ophthalmol. 2014;158(4):745–51e2. doi:10.1016/j.ajo.2014.06.006
41. Campos A, Campos EJ, Do Carmo A, et al. Choroidal thickness changes stratified by outcome in real-world treatment of diabetic macular edema. Graefes Arch Clin Exp Ophthalmol. 2018;256(10):1857–1865. doi:10.1007/s00417-018-4072-z
42. Mathis T, Mendes M, Dot C, et al. Increased choroidal thickness: a new indicator for monitoring diabetic macular oedema recurrence. Acta Ophthalmol. 2020;98(8):e968–e74. doi:10.1111/aos.14447
43. American Diabetes A. 2. classification and diagnosis of diabetes: standards of medical care in diabetes-2018. Diabetes Care. 2018;41(Suppl 1):S13–S27. doi:10.2337/dc18-S002
44. Schulze-Bonsel K, Feltgen N, Burau H, et al. Visual acuities “hand motion” and “counting fingers” can be quantified with the freiburg visual acuity test. Invest Ophthalmol Vis Sci. 2006;47(3):1236–1240. doi:10.1167/iovs.05-0981
45. Burfield HJ, Carkeet A, Ostrin LA. Ocular and systemic diurnal rhythms in emmetropic and myopic adults. Investigat Opthalmol Vis Sci. 2019;60(6):2237–2247. doi:10.1167/iovs.19-26711
46. Qi Z, Liu X, Xiong S, et al. Macular and peripapillary choroidal vascularity index in children with different refractive status. Eye. 2024;38(3):606–613. doi:10.1038/s41433-023-02743-1
47. Xu Y, Qu Y, Suo Y, et al. Correlation of retinal layer changes with vision gain in diabetic macular edema during conbercept treatment. BMC Ophthalmol. 2019;19(1):123. doi:10.1186/s12886-019-1131-0
48. Liu X, Bi L, Xu Y, et al. Robust deep learning method for choroidal vessel segmentation on swept source optical coherence tomography images. Biomed Opt Express. 2019;10(4):1601–1612. doi:10.1364/BOE.10.001601
49. Sonoda S, Sakamoto T, Yamashita T, et al. Luminal and stromal areas of choroid determined by binarization method of optical coherence tomographic images. Am J Ophthalmol. 2015;159(6):1123–31e1. doi:10.1016/j.ajo.2015.03.005
50. Xu H, Ye L, Peng Y, et al. Potential choroidal mechanisms underlying atropine’s antimyopic and rebound effects: a mediation analysis in a randomized clinical trial. Invest Ophthalmol Vis Sci. 2023;64(4):13. doi:10.1167/iovs.64.4.13
51. Savur F, Kaldirim H, Atalay K, et al. Treatment results of diabetic macular edema with different choroidal thickness with intravitreal anti vascular endothelial growth factor. BMC Ophthalmol. 2022;22(1):508. doi:10.1186/s12886-022-02721-3
52. Udaondo Mirete P, Muñoz-Morata C, Albarrán-Diego C, et al. Influence of intravitreal therapy on choroidal thickness in patients with diabetic macular edema. J Clin Med. 2023;12(1):348. doi:10.3390/jcm12010348
53. Dweikat A, Jarrar A, Akkawi M, et al. Baseline subfoveal choroidal thickness as a predictor for response to short-term intravitreal bevacizumab injections in diabetic macular edema. Clin Ophthalmol. 2021;15:4175–4180. doi:10.2147/opth.s325951
54. Rayess N, Rahimy E, Ying GS, et al. Baseline choroidal thickness as a predictor for response to anti-vascular endothelial growth factor therapy in diabetic macular edema. Am J Ophthalmol. 2015;159(1):85–91e1–3. doi:10.1016/j.ajo.2014.09.033
55. Savur F, Kaldırım H, Atalay K, et al. Changes in choroidal thickness after anti-vascular endothelial growth factor treatment of diabetic macular edema, real-life data, 2-year results. Cutaneous Ocular Toxicol. 2021;40(4):326–331. doi:10.1080/15569527.2021.1949338
56. Santamaria J, Cobos E, Biarnes M, et al. Changes in vessel density patterns assessed with OCTA in patients with diabetic macular edema treated with anti-VEGF therapy. Acta Diabetol. 2024;61(11):1385–1392. doi:10.1007/s00592-024-02290-5
57. Santamaría J, Caminal JM, Cobos E, et al. Correlation between topographic vessel density and retinal thickness changes in patients with diabetic macular edema treated with anti-VEGF therapy: is it a suitable OCTA biomarker? J Personalized Med. 2023;13(12):1718. doi:10.3390/jpm13121718
58. Li T, Jia Y, Wang S, et al. Change in peripapillary and macular choroidal thickness change in children with type 1 diabetes mellitus without visual impairment or diabetic retinopathy. Acta Ophthalmologica. 2020;98(2). doi:10.1111/aos.14225
 © 2026 The Author(s). This work is published and licensed by Dove Medical Press Limited. The
full terms of this license are available at https://www.dovepress.com/terms
and incorporate the Creative Commons Attribution
- Non Commercial (unported, 4.0) License.
By accessing the work you hereby accept the Terms. Non-commercial uses of the work are permitted
without any further permission from Dove Medical Press Limited, provided the work is properly
attributed. For permission for commercial use of this work, please see paragraphs 4.2 and 5 of our Terms.
© 2026 The Author(s). This work is published and licensed by Dove Medical Press Limited. The
full terms of this license are available at https://www.dovepress.com/terms
and incorporate the Creative Commons Attribution
- Non Commercial (unported, 4.0) License.
By accessing the work you hereby accept the Terms. Non-commercial uses of the work are permitted
without any further permission from Dove Medical Press Limited, provided the work is properly
attributed. For permission for commercial use of this work, please see paragraphs 4.2 and 5 of our Terms.