Back to Journals » Clinical Ophthalmology » Volume 17
Refractive Predictability and Biometry Agreement of a Combined Swept Source Optical Coherence and Reflectometry Biometer Compared to an Optical Low Coherence Reflectometry Biometer and an SS-OCT Biometer
Authors Gjerdrum B ![]() , Gundersen KG
, Gundersen KG ![]() , Nilsen C, Gundersen M
, Nilsen C, Gundersen M ![]() , Jensen P
, Jensen P ![]()
Received 15 February 2023
Accepted for publication 3 May 2023
Published 22 May 2023 Volume 2023:17 Pages 1439—1452
DOI https://doi.org/10.2147/OPTH.S408685
Checked for plagiarism Yes
Review by Single anonymous peer review
Peer reviewer comments 3
Editor who approved publication: Dr Scott Fraser
Bjørn Gjerdrum,1 Kjell Gunnar Gundersen,1 Christian Nilsen,1,2 Morten Gundersen,1,2 Per Jensen1,2
1Ifocus Eye Clinic, Stavanger, Norway; 2Faculty of Health Sciences, Oslo Metropolitan University, Oslo, Norway
Correspondence: Bjørn Gjerdrum, Brønngata 36, Stavanger, 4008, Norway, Tel +47 415 11935, Email [email protected]
Purpose: To evaluate the agreement of refractive predictability of a swept-source optical coherence tomography (SS-OCT) biometer, which uses segmental AL calculation, with another SS-OCT biometer, and an optical low coherence reflectometry (OLCR) biometer. The secondary objective was to describe the refractive outcomes, visual acuities, and the agreement of different preoperative biometric parameters.
Patients and Methods: The study was a retrospective one-arm study of refractive and visual outcomes after successful cataract surgery. Preoperative biometric data were collected with two different SS-OCT device (Argos, Alcon Laboratories and Anterion, Heidelberg Engineering) and an OLCR device (Lenstar 900, Haag-Streit). The Barrett Universal II formula was used to calculate IOL power for all three devices. Follow-up examination was 1– 2 months after surgery. The main outcome measure, refractive prediction error (RPE), was calculated as the achieved postoperative refraction minus the predicted refraction for each device. Absolute error (AE) was calculated by reducing the mean error to zero.
Results: The study included 129 eyes of 129 patients. The mean RPE was 0.06, − 0.14 and 0.17 D for the Argos, Anterion and Lenstar, respectively (p < 0.01). The Argos also had the lowest absolute RPE, while the Lenstar had the lowest median AE, but this was not statistically significant (p > 0.2). The percentages of eyes with RPE within ± 0.5 was 76%, 71%, and 78% for the Argos, Anterion, and Lenstar, respectively. The percentages of eyes with AE within 0.5 D was 79%, 84%, and 82% for the Argos, Anterion and Lenstar, respectively. None of these percentages were statistically significantly different (p > 0.2).
Conclusion: All three biometers showed good refractive predictability with no statistically significant differences in AE or percentages of eyes within ± 0.5 D of RPE or AE. The lowest arithmetic RPE was found with the Argos biometer.
Keywords: cataract surgery, IOL power, refractive predictability, SS-OCT biometer, segmental AL, OLCR biometer
A Letter to the Editor has been published for this article.
A Response to Letter by Dr Cione has been published for this article.
Introduction
In cataract surgery a cloudy crystalline lens is replaced by an artificial intraocular lens (IOL). Modern formulas which account for the eye’s optical properties allow for the correction of any refractive error with such IOLs. Improved accuracy of diagnostic instruments has led to high predictability of refractive results, and thus, high expectations from patients to achieve a good refractive outcome. However, some patients experience unexpected refractive errors and are dissatisfied with the result. The refractive result is particularly important with refractive lens exchange (RLE), a procedure identical to cataract surgery but performed in eyes with a clear crystalline lens. In this surgery, the patient’s goal is generally spectacle independence. Use of multifocal (MF) or extended depth of focus (EDOF) IOLs may further increase the patient’s sensitivity to refractive errors.1,2
Refractive surprises can occur as a result of inaccurate biometry, dry eyes, individual corneal healing processes and/or unpredictable shrinkage of the capsular bag.3–5 Biometry errors may result from inaccurate prediction of the true corneal power from inaccurate or insufficient measurements or inaccurate measurement of the lens thickness (LT) or axial length (AL) due to dense opacities in the crystalline lens.6–8
Refractive surprises can also be related to the IOL power calculation formulas. Several formulas more often result in hyperopic surprises for long eyes and myopic surprises for short eyes.9 Linear adjustments, like the Wang-Koch adjustment has been shown to improve results in long eyes.10,11 The Haigis formula, which uses separate lens constants related to AL and anterior chamber depth (ACD), has shown relatively better results for short and long eyes.9 This suggests that accuracy of segments of the axial length measurements may be a potential source of error. Even though optical axial length measurements have proven to be highly repeatable, most devices convert the optical path length measured to a geometrical pathlength using a single equivalent refractive index for the whole eye. Even if this is sufficiently accurate for normal eyes this may be inaccurate in eyes with variations in the relative lengths of ACD, LT and AL.
Biometers which uses swept-source optical coherence tomography (SS-OCT) have been shown to give better measurements of distances in the eye because of a higher wavelength light source and better tissue penetration through lens opacities compared to traditional interferometry or optical low-coherence (OLCR) devices.12,13 One such instrument is the Argos® (Alcon Laboratories, Inc., Fort Worth, TX, USA) biometer. The Argos also uses “sum of segments” or “segmental” refractive indices, that is separate refractive indices for separate segments of the eye, which is believed to give more accurate axial length measurements, particularly in long or short eyes.14
The primary objective of this study was to evaluate the agreement of refractive predictability of the Argos SS-OCT biometer with another SS-OCT biometer, and an OLCR biometer. The secondary objective was to describe the refractive outcomes, visual acuities, and the agreement of different preoperative biometric parameters.
Patients and Methods
This study was a retrospective one-arm study of refractive and visual outcomes after successful cataract surgery. The study was conducted in a private eye clinic in Haugesund, Norway. Patient records were used to identify patients who had biometry performed with all three biometers of interest. Initial surgery was performed from February to November 2021. All patients provided written informed consents. The study followed the tenets of the Declaration of Helsinki and was approved by an institutional review board (REK Norway, ref. no. 65988). Inclusion criteria were uncomplicated cataract surgery, bilaterally good ocular health, with no pathology or systemic disease involving the corneal surface. Exclusion criteria were postoperative best corrected visual acuity (BCVA) > 0.4 logMAR, ectatic disease, lid deformities, or any acute or chronic disease or illness that could confound the results of the study.
Examination
All patients had had a full ophthalmic assessment before surgery, including ocular health, visual acuity, and refraction. Visual acuity was recorded using an electronic Snellen chart at 4 meters. Examination included slit-lamp biomicroscopy and fundoscopy or wide-field retinal imaging. The macula, fovea, and vitreomacular interface were evaluated using fundoscopy, OCT, or both.
Biometry and IOL Calculations
Preoperative biometry was performed with three different biometers: an SS-OCT (Argos®, Alcon Laboratories, Inc., Fort Worth, TX, USA), a second SS-OCT biometer (Anterion®, Heidelberg Engineering GmbH, Heidelberg, Germany), and an OLCR biometer (Lenstar 900®, Haag-Streit AG, Koeniz, Switzerland).
The Argos provides reflection keratometry based on reflections of 16 points located on a concentric ring at a diameter of 2.2 mm. Central corneal thickness (CCT), Anterior chamber depth (ACD), lens thickness, and axial length are measured using OCT, with a 1060 nm wavelength light source. Axial lengths are calculated using separate refractive indices for the cornea (1.376), aqueous humour and vitreous (1.336) and the crystalline lens (1.420).15 The segmentations can be confirmed or edited manually from OCT images. The final biometric values are based on five separate measurements averaged for each segment. The Argos also provides a color image of the eye to be used with the VerionTM Image-guided System (Alcon Laboratories, Inc., Fort Worth, TX, USA) for IOL orientation purposes.
The Anterion is a full OCT based anterior segment imaging device and biometer using a 1300 nm wavelength light source. It provides simulated keratometry from a 3 mm ring, CCT, ACD, LT and AL. AL is based on a single refractive index for the whole eye. It also provides a full tomographic measurement of the cornea including posterior and total corneal power, which can be included in some IOL formulas. The biometric values are based on a single measurement.
The Lenstar 900 uses reflection keratometry based on 32 measurement points located on two concentric rings of 16 points each at 1.65 mm and 2.3 mm diameter. The Lenstar also provides an a-scan of corneal thickness, ACD, LT and AL based on low coherence reflectometry with an 820 nm super luminescent diode. The AL is calculated based on a single refractive index for the whole eye. The final biometric values are composites of five separate automated measurements.
IOL calculations were performed with the built-in Barrett universal II formula (Barrett formula) for each instrument. Lens constants which were previously optimized for the Lenstar were used for all three instruments since no optimized lens constants were available for the Argos or the Anterion. Consequently, the power of the implanted IOL was based on the calculation from the Lenstar. All patients received one of the six IOL models: Acrysof® IQ, Acrysof® IQ toric, AcrySof® IQ Vivity™ (Alcon Laboratories, Inc., Fort Worth, TX, USA), Physiol Micropure, or Physiol Ankoris (BVI, Waltham, MA, USA).
The following constants (Barrett LF) were used for the IOL calculations: Acrysof IQ: 1.88; Acrysof IQ Toric:1.99; AcrySof® IQ Vivity and Vivity Toric: 2.10; Physiol Micropure and Physiol Ankoris: 1.94.
Toric IOL calculations, when necessary, were performed with the built-in Barrett toric calculator of the Lenstar biometer.
Surgery and Follow Up
All patients included had uneventful surgery. Surgeries were performed by one of two surgeons (KG or CN) using a superior 2.2 mm primary incision and two side ports 60 degrees from the main incision. The Verion Image-guided System was used for location of incisions and capsulorhexis, and alignment of toric IOLs. Postoperative results were recorded 1–2 months after surgery. This included uncorrected and corrected distance visual acuity (UDVA and CDVA) and the subjective refraction with a chart at 4 meters.
Outcome Variables
The primary outcome variable was the refractive prediction error (RPE), both arithmetic and absolute. RPE was calculated as the achieved minus the predicted refractive spherical equivalent for each biometer. A positive prediction error indicates a refractive result that is more hyperopic than the predicted result. The absolute error (AE) and the median AE (MedAE) were calculated by reducing the mean arithmetic RPE to zero for each device, surgeon and IOL.16 The AE represents the ideal situation where the lens constants are perfectly optimized for the study sample. Secondary outcome variables were preoperative biometry; average K (average of flat and steep keratometry values), ACD measured from the anterior cornea to the anterior crystalline lens, LT, AL, and white to white corneal diameter (WTW). It also included UDVA and CDVA which was converted from Snellen to logMAR, and subjective spherical equivalent (SE) and cylinder refraction which was converted from a lane length of 4 meters to 6 meters.17,18
Sample Size
From a clinical perspective we considered an agreement between the devices if the difference in mean RPE was less than 0.25 D with a standard deviation of 0.4 D. Using an alpha of 0.05 and a power of 0.8, a sample of 22 eyes was determined to be sufficient to reliably detect a difference in RPE of at least 0.25D.
Analysis
Descriptive statistics included the minimum, maximum, mean, median and standard deviation of calculated values. Statistical analysis was performed using the t-test, analysis of variance or non-parametric tests as appropriate. Agreement of measurements were assessed with Bland-Altman plots with 95% limits of agreement. The p-values for the RPE (primary outcome) were adjusted with the Holm-Bonferroni method for multiple comparisons.19
Post Hoc Analysis
Correlations between RPE and different biometric measures were tested to see if the accuracy of IOL calculation could be related to the different ocular dimensions or the measurement with different devices. We also wanted to test if more unusual combinations of ocular dimensions (like long eyes with shallow anterior chamber or thin crystalline lenses, or vice versa) could affect the refractive predictability. Therefore, correlations between RPE and the ratio of AL to ACD and AL to LT were compared between devices.
Results
The study included 129 eyes of 129 patients. 16 patients were excluded (four due to postoperative complication, nine with faulty or missing biometry or refractive data, and three patients were lost to follow-up). Mean age was 75 years and 57% were female. Mean follow-up time was 1.3 months. The postoperative UCVA and BCVA were 0.10 logMAR and −0.03 logMAR, respectively. The mean refractive spherical equivalent (SE) and cylinder was −0.0 D and −0.6 D, respectively (Table 1).
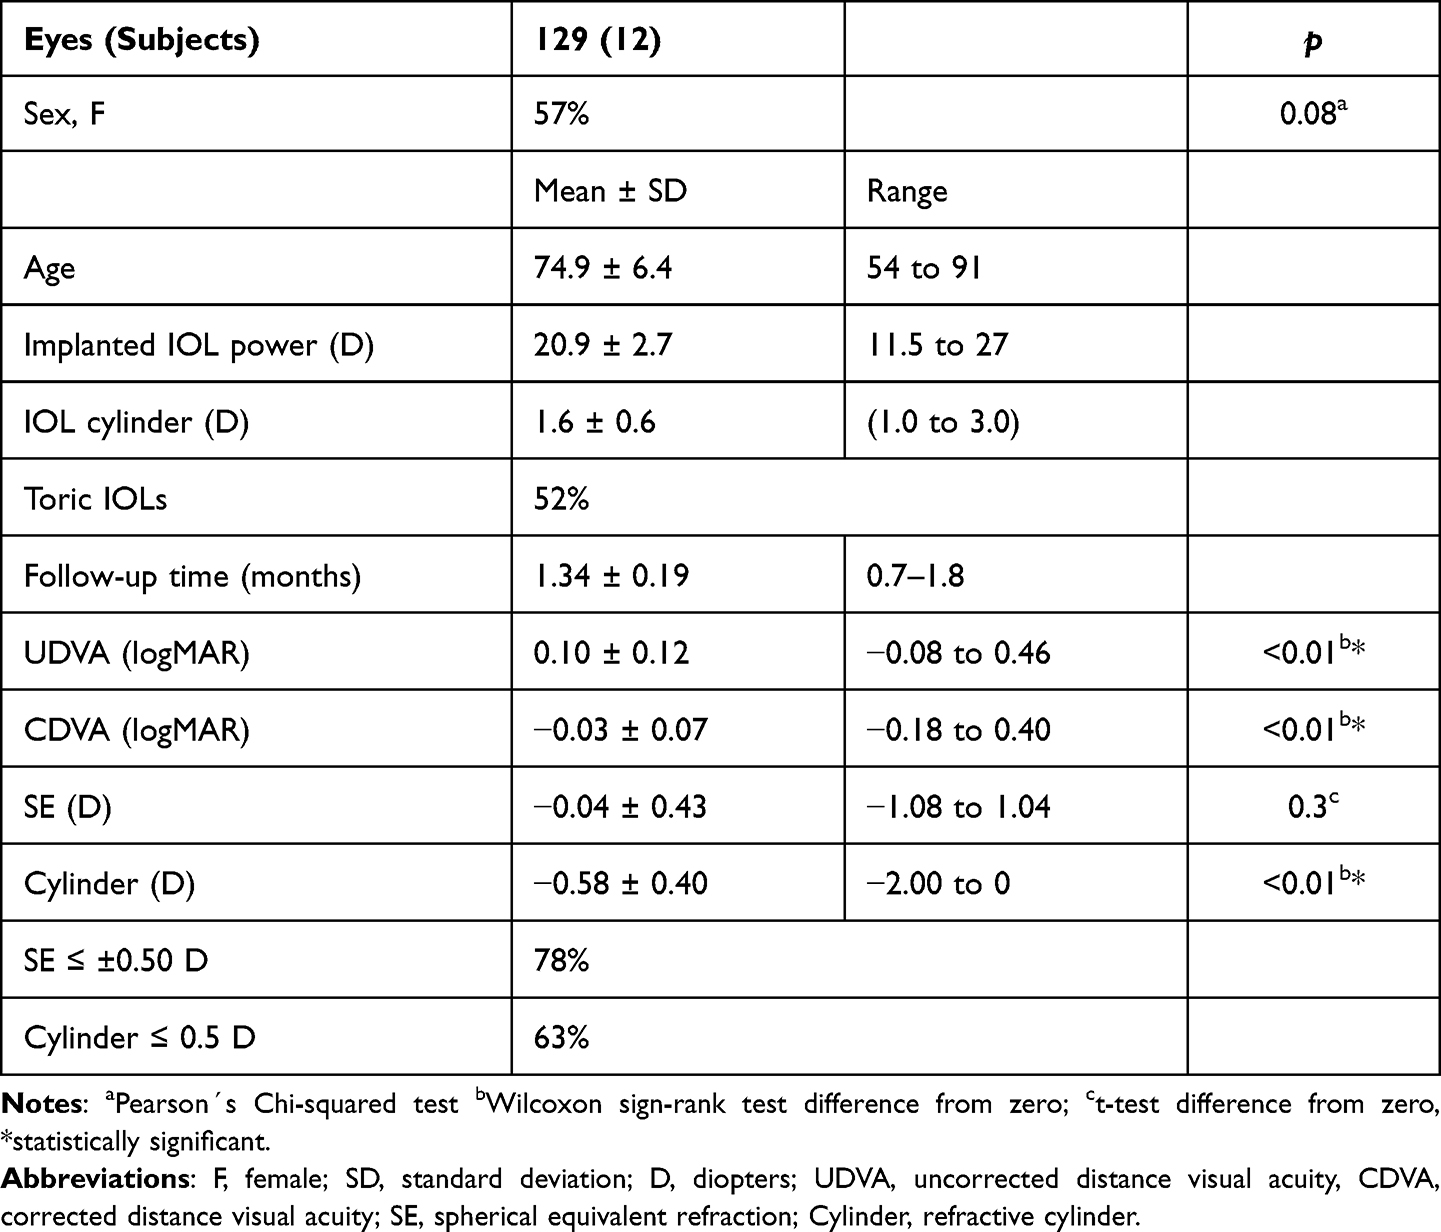 |
Table 1 Demographics and Refractive Results |
Refractive Prediction Error
Mean RPE and Median Absolute Error
The IOL calculations based on Argos showed statistically significantly lower arithmetic RPE compared to both other devices. The mean RPE was 0.06, −0.14 and 0.17 D for the Argos, Anterion and Lenstar, respectively (Table 2). The Argos also had the lowest absolute RPE, while the Lenstar had the lowest MedAE but none of these differences were statistically significant (p > 0.2).
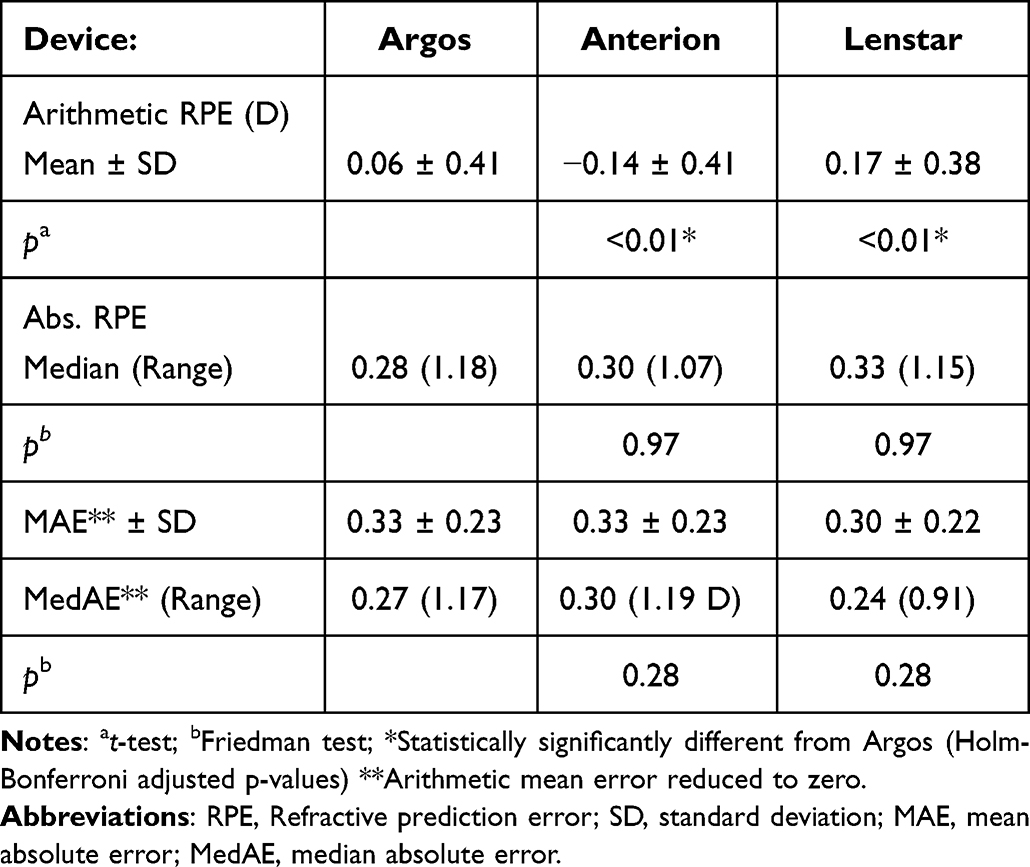 |
Table 2 Arithmetic RPE, Absolute RPE, and MedAE |
The percentages of eyes with RPE within ±0.5 was 76%, 71%, and 78% for the Argos, Anterion, and Lenstar, respectively. The percentages of eyes with AE (with mean error reduced to zero) within 0.5 D was 79%, 84%, and 82% for the Argos, Anterion and Lenstar, respectively. (Table 3) None of these percentages were statistically significantly different (p > 0.2).
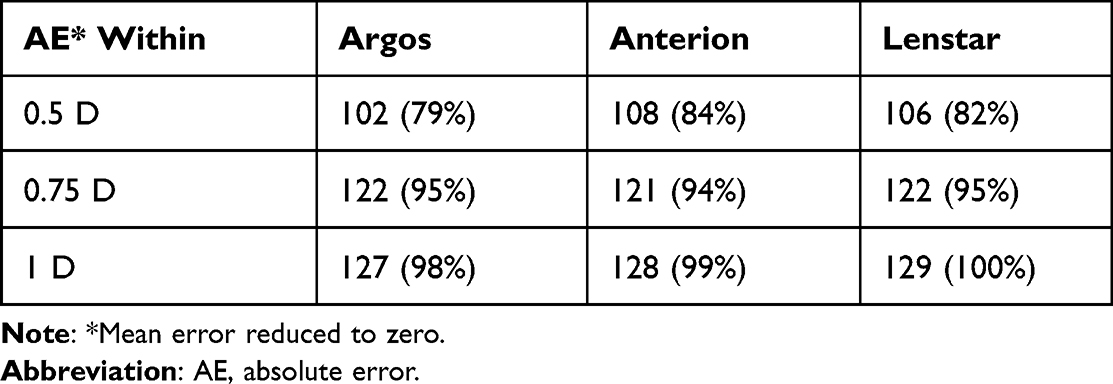 |
Table 3 Percentages of Eyes Within Certain Ranges of AE* |
Axial Length Groups
The refractive prediction error was compared between three devices in groups according to axial length: Short eyes; < 22.5 mm (10 eyes, 8%), normal eyes; 22.5–25 mm (107 eyes, 83%) and long eyes; >25mm (11 eyes, 9%) (Table 4). The Argos showed statistically significantly lower arithmetic RPE compared to the Anterion in both the short and the normal eyes group and compared to the Lenstar in the normal and the long eyes group. The Argos had the lowest absolute RPE and MedAE in the short eyes group, while the Anterion had the lowest absolute RPE in normal and long eyes. The Lenstar showed the lowest MedAE in normal Eyes and long eyes. None of these differences in absolute RPE or MedAE were statistically significant.
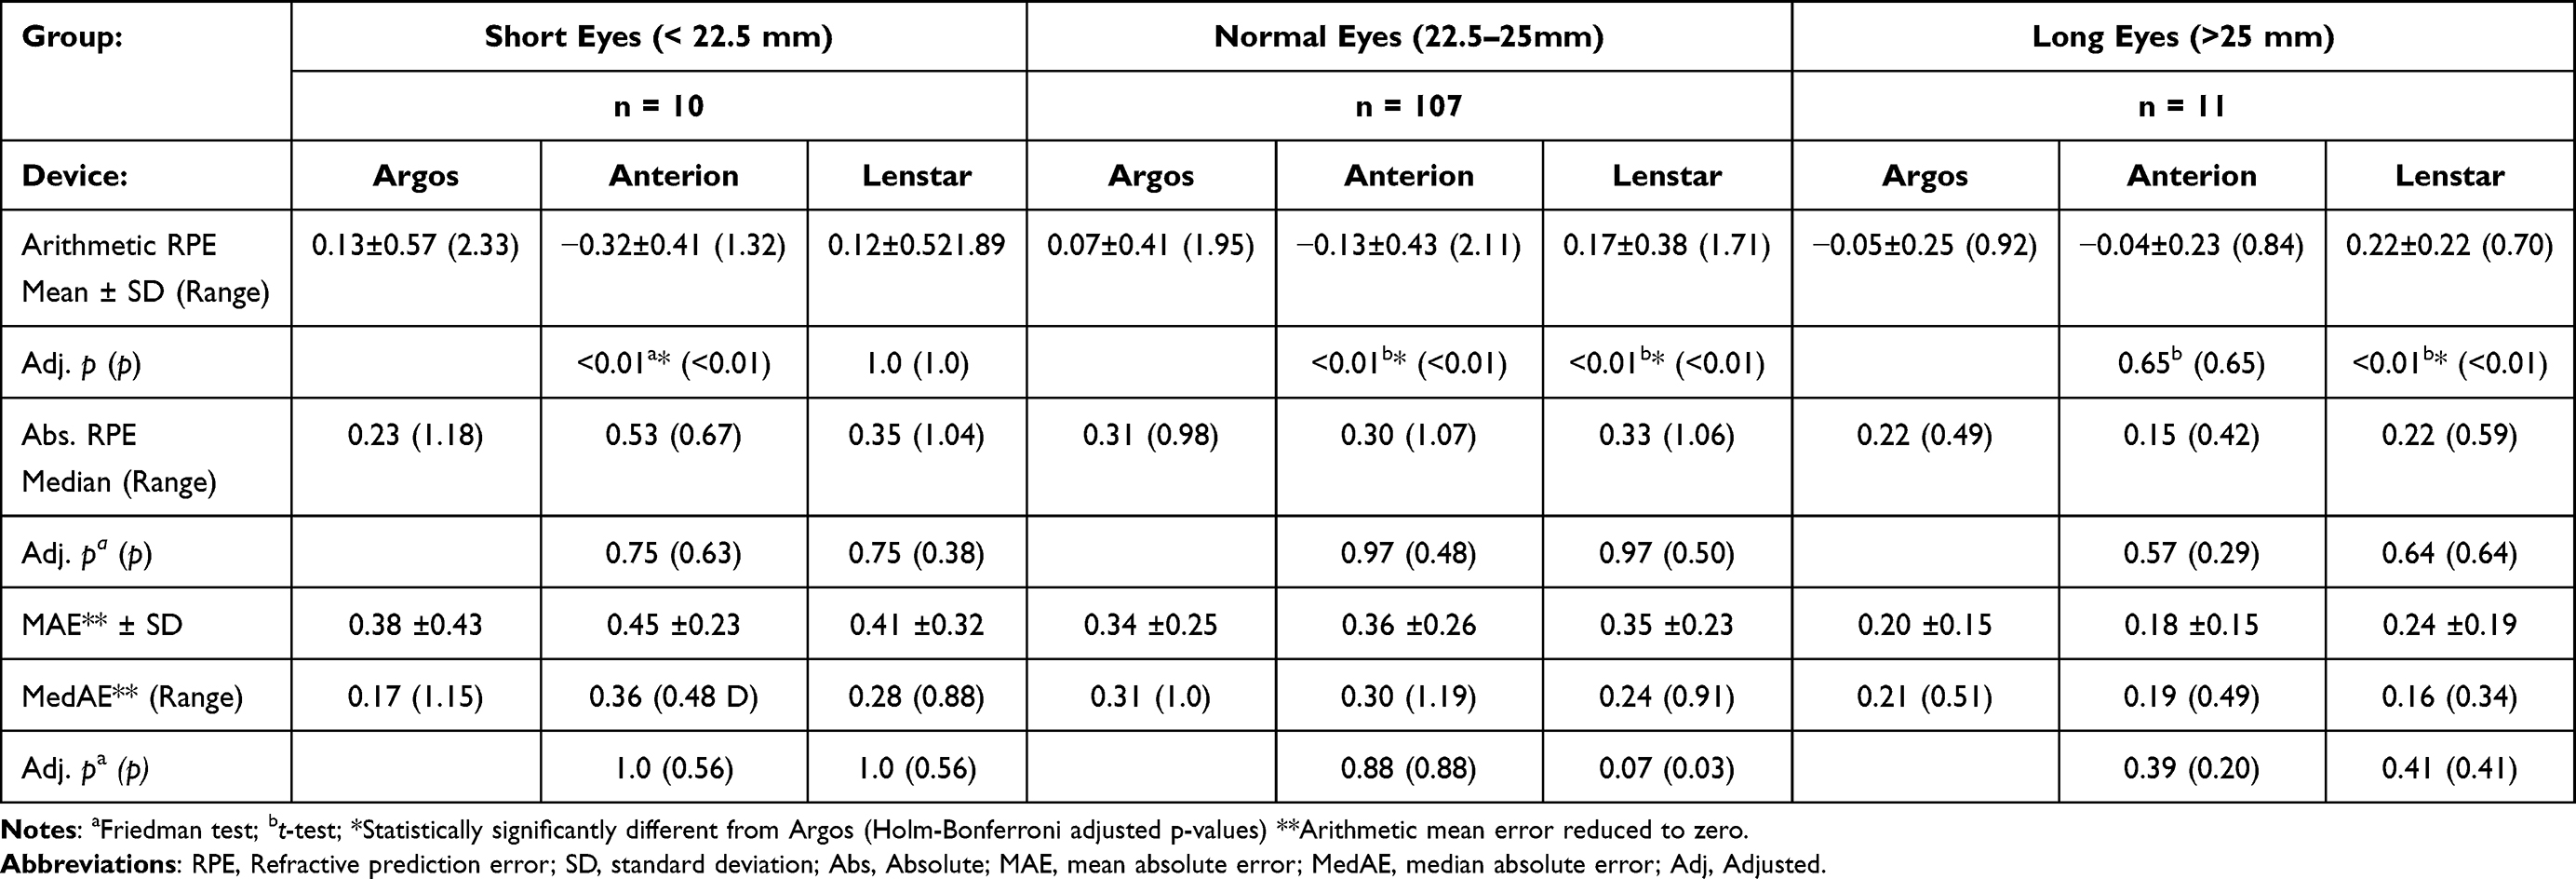 |
Table 4 Arithmetic RPE, Absolute RPE, Mean Absolute Error and Median Absolute Error (D) in Short, Normal, and Long Eyes |
Agreement of Biometry
Bland Altman plots with 95% limits of agreement was used to assess the agreement of average K, ACD, LT, AL and WTW between the Argos and the two other biometers. Average K showed no statistically significant bias for the Argos compared to the Lenstar (−0.02 D, p=0.12) with limits of agreement (LoA) of −0.38 D and 0.33D, respectively. For Argos versus Anterion there was a statistically significant bias of 0.26 D (p<0.01) with LoA of −0.27 D and 0.78 (Figure 1).
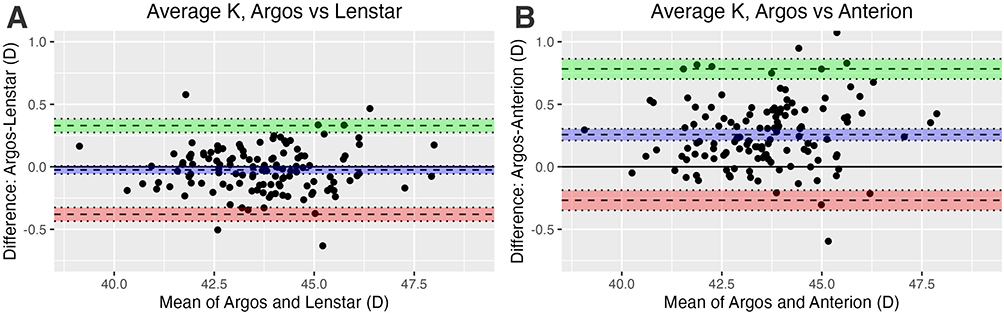 |
Figure 1 Bland-Altman plot of difference in Average K by mean average K for (A) Argos vs Lenstar, (B) Argos vs Anterion. Abbreviation: Average K, average of flat and step keratometry. |
The Argos AL showed a statistically significant bias of −0.02 mm versus the Lenstar (p < 0.01) with LoA of −0.1 mm and 0.06 mm. There was no statistically significant bias between Argos and Anterion (0.00 mm, p=0.12), with LoA of −0.08 and 0.07, respectively. However, both Anterion and Lenstar showed lower values for shorter AL and higher values for longer AL versus the Argos (Figure 2). AL measured with the Argos was statistically significantly longer in short eyes and shorter in long eyes compared to both Anterion and Lenstar. In normal eyes and all eyes, Argos AL was statistically significantly longer compared to Lenstar AL but not to Anterion AL (Table 5).
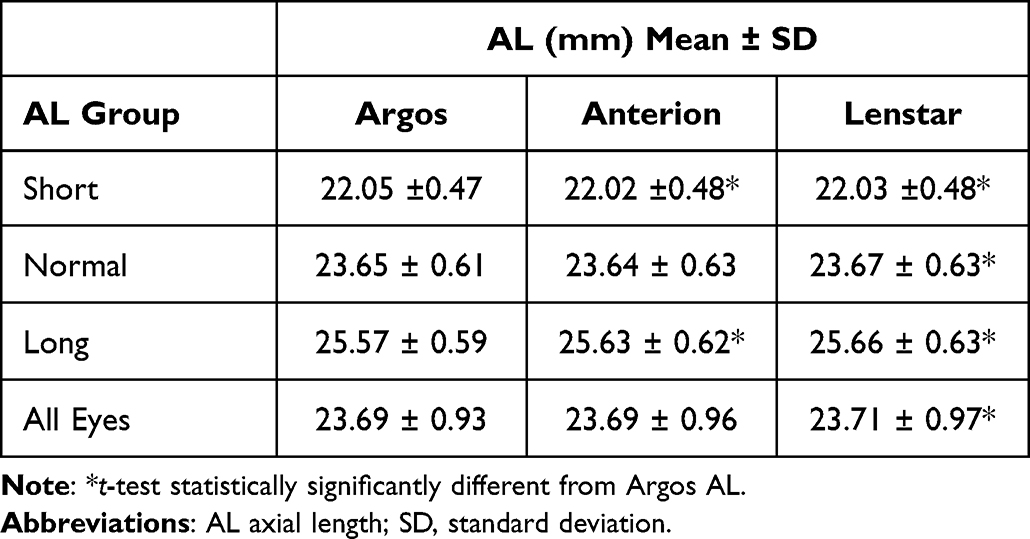 |
Table 5 Axial Length by Instrument and AL Groups |
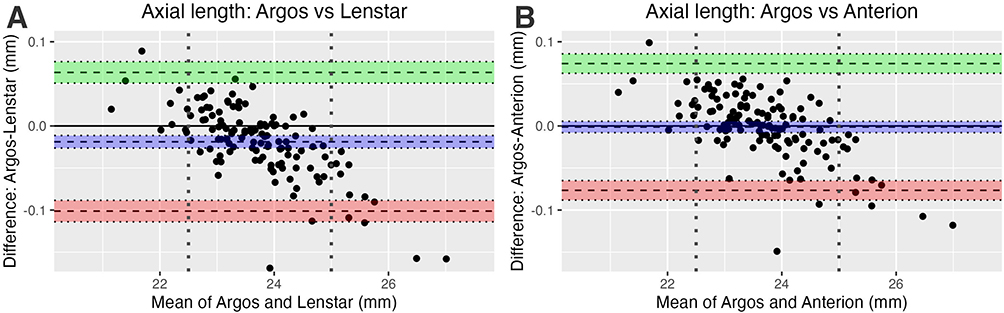 |
Figure 2 Bland-Altman plot of difference in axial length by mean axial length for (A) Argos vs Lenstar, (B) Argos vs Anterion. Note: Dotted vertical lines denote cutoff values of short and long eyes (22.5 mm and 25 mm). |
For both ACD and LT the Argos showed better agreement with Anterion than with the Lenstar. For ACD the agreement with Anterion showed a bias of 0.05 (p < 0.01) with upper and lower LoA of 0.02. and 0.13 (Figure 3). The agreement with Lenstar showed no statistically significant bias but with much wider limits of agreement (−0.34 to 0.36). For LT the Argos showed a bias of 0.25 (p < 0.01) versus the Lenstar with LoA of −0.29 and 0.80, respectively (Figure 4). The agreement with Anterion showed no statistically significant bias with LoA of −0.21 and 0.18.
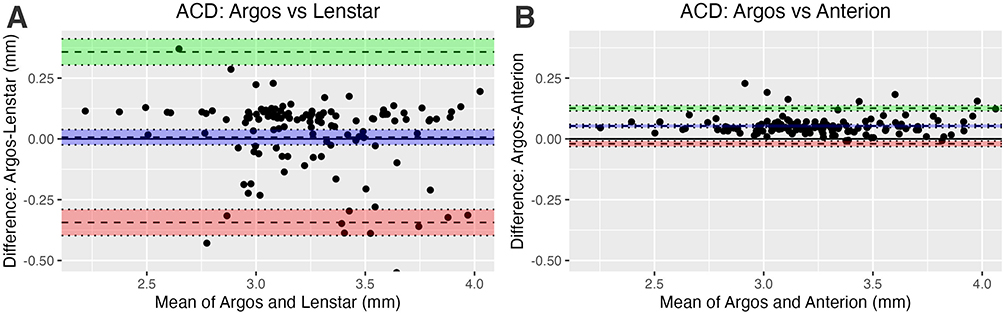 |
Figure 3 Bland-Altman plot of difference in ACD by mean ACD for (A) Argos vs Lenstar, (B) Argos vs Anterion. Abbreviation: ACD, anterior chamber depth. |
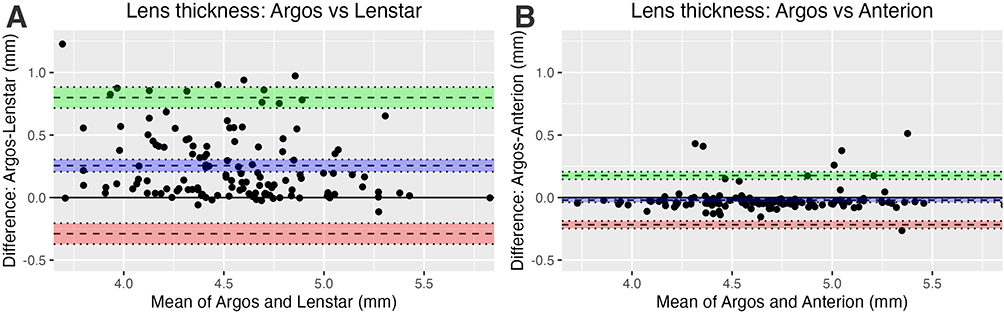 |
Figure 4 Bland-Altman plot of difference in LT by mean LT for (A) Argos vs Lenstar, (B) Argos vs Anterion. Abbreviation: LT, lens thickness. |
For agreement of WTW there was no bias between the Argos and the Lenstar but a statistically significant bias of 0.19 mm between the Argos and Anterion. The LoA with the Argos was slightly better for the Anterion than for the Lenstar (−0.29 to 0.70 and −0.64 to 0.62, respectively) (Figure 5). There were two distinct outliers identified in the plot. One was for the Argos which showed a WTW more than 2 mm higher than both the Anterion and Lenstar, and one for the Lenstar which showed a WTW more than 2 mm lower than the Argos (and Anterion).
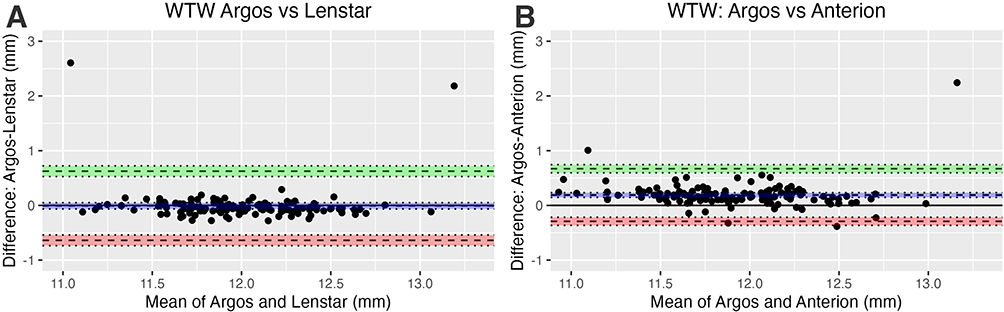 |
Figure 5 Bland-Altman plot of difference in WTW by mean WTW for (A) Argos vs Lenstar, (B) Argos vs Anterion. Abbreviation: WTW, cornea white to white diameter. |
Refractive Predictability Correlations
AL, ACD, LT
The RPE showed no statistically significant correlation with ACD or AL for any of the devices or with LT for the Argos. There was a weak positive correlation between RPE and LT for the Lenstar (r2 = 0.04, p = 0.01) and Anterion (r2 = 0.02, p = 0.05) (Figure 6).
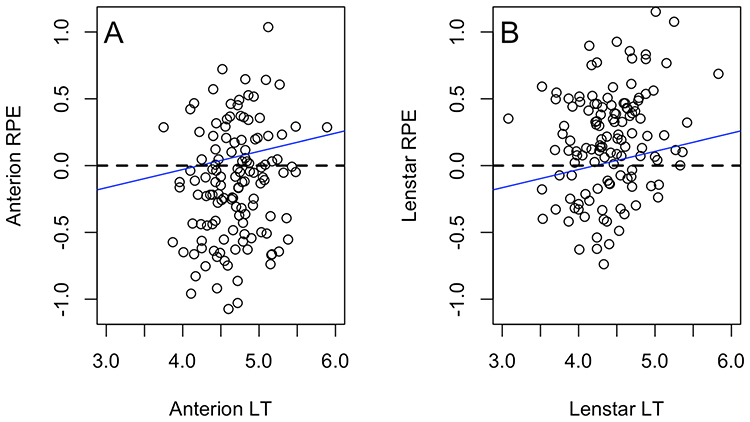 |
Figure 6 Example of week correlation between RPE and LT for (A) Lenstar and (B) Anterion. Abbreviations: RPE, refractive prediction error; LT, lens thickness. Notes: Correlations: Lenstar (r2 = 0.04, p = 0.01), Anterion (r2 = 0.02, p = 0.05). |
ACD/AL and LT/AL Ratio
There were no statistically significant correlations between RPE and ACD/AL ratio for any device, or between RPE and LT/AL ratio for the Argos or Anterion. For the Lenstar there was a statistically significant correlation between RPE and the LT/AL ratio (p =0.013, r2 =0.05) (Figure 7). The correlation is weak, but we found that when analyzing eyes with an RPE more than 0.5 different from the mean (less than −0.34 D or more than +0.67 D) for the Lenstar, the LT/AL ratio was statistically significantly different from the mean LT/AL ratio for the whole group. These differences were not seen for the Argos or the Anterion.
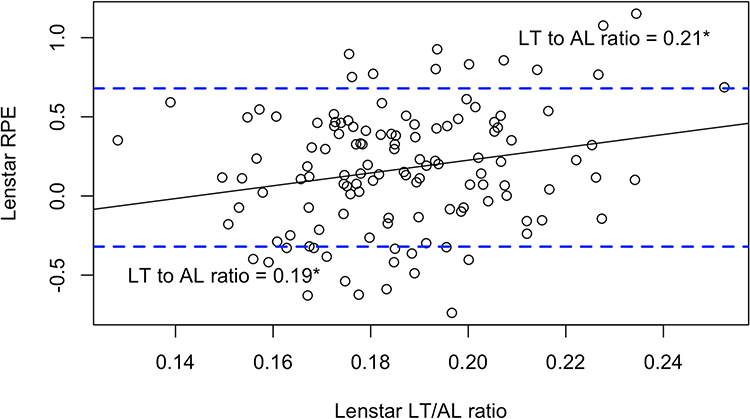 |
Figure 7 Correlation between RPE and LT to AL ratio for the Lenstar. Abbreviations: RPE, refractive prediction error; LT, lens thickness; AL, axial length. Notes: Correlation: r2 =0.05, p =0.013. Dotted lines denote mean RPE ± 0.5 D. *LT to AL ratio statistically significantly different from mean LT to AL ratio for all eyes. |
Discussion
The main purpose of this study was to compare the refractive predictability of the Argos SS OCT biometer, which incorporates separate refractive indices of the different segments of the eye, to an OLCR biometer and an SS OCT biometer that use a single composite refractive index for the entire eye. In this study, the Argos showed the lowest RPE of all devices for all and normal eyes, lower than the Anterion in short eyes and lower than the Lenstar in long eyes. However, no statistically significant differences of absolute RPE, medAE, or eyes within 0.5, 0.75 or 1 D were observed.
A systematic bias of the arithmetic RPE indicates that lens constants were not optimal for the study sample. In this study, only lens constants which were previously optimized for the Lenstar were available and were used for all three devices. This will be the situation in a clinical practice when a new biometric device should be put into use. The arithmetic RPE shows that even with optimized constants from previous results, the RPE is not guaranteed to be zero. Therefore, AE (with the mean RPE reduced to zero to simulate ideal lens constants for the study sample) was also analyzed This is one of two approaches suggested by Hoffer et al, and Wang et al16,20 We found no statistically significant difference in medAE in the whole group or the subgroups, although the Argos had the lowest MedAE in the short eyes group. This group also had the largest differences (0.17 D to 0.36 D).
These findings are reasonably consistent with those of Omoto et al who compared the biometry and refractive prediction of the Argos with an IOLMaster 700 OCT biometer (which uses a regression based single refractive index for AL) in medium and long eyes. They found lower arithmetic and absolute RPE, and higher percentages of eyes within ±0.5 D and ±1.0 D for the Argos using the Barrett formula, but this was only statistically significant for the RPE in all eyes and absolute RPE in long eyes. However, they used lens constants from the ULIB (User Group for Laser Interference Biometry) database for both devices. These are published constants optimized for the IOLMaster (based on reported results), and Omoto et al suggested that lens constants optimized for the Argos might have improved the results.21
Cooke and Cooke in 2019 used a theoretical approach in a retrospective study of more than 1400 eyes with data from OLCR biometry (Lenstar).22 They manually calculated a sum of segments AL from internally stored optical pathlength of the segments of the eye. This was compared to the displayed AL based on a single refractive index. They found that the segmental AL’s were longer in short eyes and shorter in long eyes compared to the displayed AL. Using lens constants optimized for each AL method for the study sample, they found that formulas which were originally developed for ultrasound (US) biometry improved significantly, but most formulas that were developed for optical biometry worsened, although the difference was relatively small (for the Barrett formula reduction in AE of ≤ 0.02 D and ≤ 4 percentage points of RPE within ± 0.5 D). Cooke and Cooke suggested that the reason for this result was that the optically derived formulas (although not disclosed) included corrections for errors in AL in long and short eyes based on a single (composite) refractive index.
Wang et al used data from OLCR biometry (Lenstar) and a similar approach in a retrospective study of more than 1700 eyes.14 They used lens constants from the ULIB database and compared refractive prediction error based on the displayed (single refractive index) AL and segmental AL and concluded that several formulas improved the mean absolute RPE when using segmental axial lengths: The Barrett formula showed statistically significant improvement of the mean absolute RPE and the percentage of eyes within ± 0.5 D of expected, both overall and in long eyes.14
Shammas et al used an Argos biometer in a “reversed” approach and compared the calculations based on the segmental AL with a theoretically calculated single refractive index AL. Using lens constants that were optimized for both AL methods in the study sample, they found that the mean RPE was lower and the percentage of RPE within ± 0.5 D was higher for the segmental AL with the Barrett formula, except in short eyes. However, these differences were not statistically significant.23
The results from the studies compared did show some differences: Two studies found improvement of prediction error with segmental AL overall and in long eyes, one study found indications of improvement in all groups, and one study found worsened results.14,21,22 The present study found improvements in RPE but not for AE or MedAE. However, the overall results appeared good and the differences, both within and between studies was relatively small (differences of AE less than 0.03 D and 5 percentage points or lower difference of RPE within ±0.5 D). One of the reasons for the relatively small differences seen between the two AL method could be that the Barrett Universal II formula was developed to be useful for short, medium, and long axial lengths.24 Therefore, the formula is likely to include some kind of corrections for errors in AL calculated with a single refractive index in long and short eyes. As discussed by Cooke and Cook this might affect the expected improvement when using segmental axial length calculations. A recent study from Shammas et al used the Argos and compared newer formulas which included artificial intelligence or machine learning of some kind. They found that a new formula developed for segmental AL (but not yet commercially available) performed the best.25
The differences seen between the studies could result from different use of optimized lens constants, but also the different instruments being used; One study compared the Argos to another SS-OCT with reflection keratometry, while three studies used one single instrument (Argos or Lenstar) and calculated segmental AL from single refractive index AL or vice versa. In that way only the differences in AL calculation method were compared. In the present study, calculations were based on measurements with different biometry devices using different technologies and approaches for the different biometric measurement; Both the Argos and Lenstar use reflection keratometry, while the Anterion uses OCT based keratometry. The Argos and Anterion use SS-OCT (1060 nm and 1300 nm light sources, respectively) to measure AL as well as ACD and LT, while the Lenstar uses OLCR with an 820 nm light source.
Another relevant issue regarding refractive prediction studies is the repeatability of subjective refraction. A literature review by Goss and Grosvenor concluded that both intra- and interexaminer reliability of subjective refraction were close to 80% agreement within ± 0.25D and 95% agreement within ±0.50 D for spherical equivalent power.26 This variability in subjective refraction is close to the overall refractive predictability of IOL calculations seen in the present and the cited studies. However, when using paired comparisons, as in the present study, the variability in subjective refraction is equal across groups and should not affect the results.
The agreement of axial length for both the Lenstar and Anterion showed lower values for shorter ALs and higher values for longer ALs compared to the Argos. This is in line with the other studies comparing segmental AL measurements to AL measurements based on a single refractive index, though Omoto et al found a significant bias of +0.07 mm but with a similar linear relation.14,21–23 The reason for this is that a single refractive index developed for average eyes will be too high in long eyes where the vitreous cavity (which has a lower actual refractive index) is relatively long, and vice versa for short eyes.21
The longer wavelength of light used with Argos and Anterion is likely to give more accurate measurements in LT and AL cases with dense cataract compared to the Lenstar.12,13 For AL agreement there was a small but statistically significant bias between the Argos and Lenstar, and a few more outliers outside the LoA compared to the Argos and Anterion. More apparent was the difference in agreement of ACD and LT between the Argos and the two other biometers: between the Argos and Anterion there was no bias and the LoA interval (upper LoA minus lower LoA) was 0.39 and 0.15 for LT and ACD, respectively. The difference between Argos and the Lenstar was more than three times higher. There was a significant bias of −0.25 for the Lenstar versus Argos for LT, but not for ACD. Omoto et al found comparable low LoA interval between the Argos and another SS-OCT device (0.29 for LT and 0.21 for ACD), while Shammas et al found comparable results between the Argos and the Lenstar (LoA interval of 0.80 and 0.58, for LT and ACD, respectively with a bias of −0.22 for LT and 0.08 for ACD for the Lenstar).15,21
The lower LT seen with the Lenstar together with similar ACD, suggests that the OLCR device more often fails in detecting the posterior surface of the crystalline lens, and possibly detects a signal peak from opacities inside the lens instead of the posterior capsule of the lens.
Both the Argos and the Lenstar use reflection keratometry at 2.2 and 1.65–2.3 mm diameter, respectively) while the Anterion extracts simulated keratometry at a 3 mm diameter from elevation maps created by the SS-OCT. Since the cornea is aspheric and on average has a prolate shape, a larger measurement diameter could be expected to yield a lower corneal power.27 This difference was demonstrated with the Bland-Altman plots: the Argos and Lenstar devices show a very high agreement (LoA interval 0.72 D) of keratometry with a minimal bias, while the Argos shows a statistically significant bias of ‑0.26 D (and larger LoA interval of 1.05 D) versus the Argos. This difference in keratometry would translate to about +0.2 D of difference in predicted refraction and ‑0.2 D of prediction error for an average eye, which is likely the main cause of the myopic mean RPE seen for the Anterion relative to the Argos. The larger LoA between the Argos and the Anterion could be caused by a variability in asphericity of the corneas, but it could also be a function of lower keratometric repeatability with the Anterion. A repeatability study from 2020 found larger variability of keratometry with the Anterion compared to the Lenstar.28 The authors suggested that this was related to keratometry based on single measurements with the Anterion compared to averaged values with the Lenstar. Omoto et al found similar agreement between the Argos and the IOLMaster 700, which both uses reflection keratometry: A LoA interval of 0.74 D, but with a bias of 0.15 D due to a greater keratometry diameter (2.5mm).21 Shammas et al found wider LoA interval (1.05 D) between the Argos and Lenstar, but with no bias.15
There was good agreement of WTW between the Argos and both the Anterion and Lenstar. There was a statistically significant bias of 0.2 mm for the Anterion, but this was considered not clinically relevant. The LoA interval of 1–1.3 mm would correspond to refractive differences within about ±0.07 D with the Barrett formula for an average eye. This was lower than what was found in the study by Shammas et al.15 However, two distinct outliers were identified in the Bland-Altman plot: one eye with about two mm higher WTW for the Argos which increased the RPE for this eye with about ‑0.2 D to ‑0.53 D, and another one with about two mm lower WTW for the Lenstar which increased the RPE with about +0.2 D to +0.42 D.
The analysis of refractive prediction in relation to different lengths of the various ocular segments showed no significant correlation between RPE and AL or ACD for any of the devices. A weak statistically significant positive correlation with LT was found for the Lenstar and the Anterion. The reason for this is not clear.
Variability in RPE was also evaluated in relation to relative lengths of the various ocular segments, specifically the correlation between the RPE and the ratio of LT to AL and ACD to AL. We found no statistically significant correlation with the ACD to AL ratio, but for the Lenstar there was a statistically significant correlation between RPE and the LT to AL ratio. The mean LT/AL ratio for eyes with outlier RPE (outside mean RPE ±0.5 D) was significantly different from the overall mean. This correlation was not seen with any of the OCT devices, so it seems not to be related to the method of AL measurement, but more likely to the LT measured with the Lenstar. The mean LT from the Lenstar was lower than from the two OCT devices, while the mean ACD was similar. Consequently, this could affect the estimation of the effective lens position, making it relatively anterior, resulting in a lower estimated IOL power and a more hyperopic RPE.
The present study has limitations. There were few eyes in the long and short eyes groups, which makes conclusions for these groups uncertain. The different technologies involved could affect the biometric measurements of the devices and these differences could possibly outweigh the differences between AL methods. The surgeries were performed by two different surgeons, and with 6 different IOL types, which could affect the results. However, all comparison were paired, and AE was calculated for each surgeon and IOL type. We did not have optimized lens constants for two of the devices. Instead, we calculated the AE by adjusting the mean error retrospectively to simulate optimal lens constants. Such adjustments are perfect in theory but may not reflect the true variability in future populations. We did not do a repeatability study, so no conclusion about the variability of the devices could be made.
Conclusion
The biometer devices studied here all showed good refractive predictability with no statistically significant differences in AE or percentages of eyes within ± 0.5 D of RPE or AE. However, the lowest arithmetic RPE was found with the Argos when using lens constants that were optimized for the Lenstar. The Argos device showed the best agreement of keratometry with the Lenstar and the best agreement of ACD and LT with the Anterion. The Argos, which uses segmental AL, showed lower values in long eyes and higher values in short eyes. The use of segmental AL could be beneficial in eyes with more extreme dimensions than seen in this study, or with formulas specially developed for segmental AL.
Acknowledgment
The authors wish to thank Rick Potvin, MASc, O.D. for critical review of the manuscript.
Disclosure
Dr. Gundersen is a consultant to Alcon, Staar, Santen, Centricity, and Glaukos. Mr Bjørn Gjerdrum reports grants from Alcon, during the conduct of the study. This study was supported by an investigator-initiated study grant from Alcon, Fort Worth, TX (IIT #68660849). The authors report no other conflicts of interest in this work.
References
1. de Vries NE, Webers CA, Touwslager WR, et al. Dissatisfaction after implantation of multifocal intraocular lenses. J Cataract Refract Surg. 2011;37(5):859–865. doi:10.1016/j.jcrs.2010.11.032
2. Gibbons A, Ali TK, Waren DP, Donaldson KE. Causes and correction of dissatisfaction after implantation of presbyopia-correcting intraocular lenses. Clin Ophthalmol. 2016;10:1965–1970. doi:10.2147/OPTH.S114890
3. Epitropoulos AT, Matossian C, Berdy GJ, Malhotra RP, Potvin R. Effect of tear osmolarity on repeatability of keratometry for cataract surgery planning. J Cataract Refract Surg. 2015;41(8):1672–1677. doi:10.1016/j.jcrs.2015.01.016
4. Olsen T. Calculation of intraocular lens power: a review. Acta Ophthalmol Scand. 2007;85(5):472–485. doi:10.1111/j.1755-3768.2007.00879.x
5. Kurz S, Krummenauer F, Hacker P, Pfeiffer N, Dick HB. Capsular bag shrinkage after implantation of a capsular bending or capsular tension ring. J Cataract Refract Surg. 2005;31(10):1915–1920. doi:10.1016/j.jcrs.2005.06.046
6. Olsen T. Sources of error in intraocular lens power calculation. J Cataract Refract Surg. 1992;18(2):125–129. doi:10.1016/S0886-3350(13)80917-0
7. Norrby S. Sources of error in intraocular lens power calculation. J Cataract Refract Surg. 2008;34(3):368–376. doi:10.1016/j.jcrs.2007.10.031
8. Savini G, Hoffer KJ. Intraocular lens power calculation in eyes with previous corneal refractive surgery. Eye Vis. 2018;5:18. doi:10.1186/s40662-018-0110-5
9. Fam HB, Lim KL. Improving refractive outcomes at extreme axial lengths with the IOLMaster: the optical axial length and keratometric transformation. Br J Ophthalmol. 2009;93(5):678–683. doi:10.1136/bjo.2008.148452
10. Wang L, Shirayama M, Ma XJ, Kohnen T, Koch DD. Optimizing intraocular lens power calculations in eyes with axial lengths above 25.0 mm. J Cataract Refract Surg. 2011;37(11):2018–2027. doi:10.1016/j.jcrs.2011.05.042
11. Wang L, Koch DD. Modified axial length adjustment formulas in long eyes. J Cataract Refract Surg. 2018;44(11):1396–1397. doi:10.1016/j.jcrs.2018.07.049
12. Srivannaboon S, Chirapapaisan C, Chonpimai P, Loket S. Clinical comparison of a new swept-source optical coherence tomography–based optical biometer and a time-domain optical coherence tomography–based optical biometer. J Cataract Refract Surg. 2015;41(10):2224–2232. doi:10.1016/j.jcrs.2015.03.019
13. Fisus AD, Hirnschall ND, Ruiss M, Pilwachs C, Georgiev S, Findl O. Repeatability of two swept-source optical coherence tomography biometers and one optical low coherence reflectometry biometer. J Cataract Refract Surg. 2021;47(10):1302–1307.
14. Wang L, Cao D, Weikert MP, Koch DD. Calculation of axial length using a single group refractive index versus using different refractive indices for each ocular segment: theoretical study and refractive outcomes. Ophthalmology. 2019;126(5):663–670. doi:10.1016/j.ophtha.2018.12.046
15. Shammas HJ, Ortiz S, Shammas MC, Kim SH, Chong C. Biometry measurements using a new large-coherence-length swept-source optical coherence tomographer. J Cataract Refract Surg. 2016;42(1):50–61. doi:10.1016/j.jcrs.2015.07.042
16. Wang L, Koch DD, Hill W, Abulafia A. Pursuing perfection in intraocular lens calculations: III. Criteria for analyzing outcomes. J Cataract Refract Surg. 2017;43(8):999–1002. doi:10.1016/j.jcrs.2017.08.003
17. Simpson MJ, Charman WN. The effect of testing distance on intraocular lens power calculation. J Refract Surg. 2014;30(11):726. doi:10.3928/1081597X-20141021-01
18. Hill WE, Abulafia A, Wang L, Koch DD. Pursuing perfection in IOL calculations. II. Measurement foibles: measurement errors, validation criteria, IOL constants, and lane length. J Cataract Refract Surg. 2017;43(7):869–870. doi:10.1016/j.jcrs.2017.07.006
19. Chen SY, Feng Z, Yi X. A general introduction to adjustment for multiple comparisons. J Thorac Dis. 2017;9(6):1725–1729. doi:10.21037/jtd.2017.05.34
20. Hoffer KJ, Aramberri J, Haigis W, et al. Protocols for studies of intraocular lens formula accuracy. Am J Ophthalmol. 2015;160(3):403–405.e401. doi:10.1016/j.ajo.2015.05.029
21. Omoto MK, Torii H, Masui S, Ayaki M, Tsubota K, Negishi K. Ocular biometry and refractive outcomes using two swept-source optical coherence tomography-based biometers with segmental or equivalent refractive indices. Sci Rep. 2019;9(1):6557. doi:10.1038/s41598-019-42968-3
22. Cooke DL, Cooke TL. A comparison of two methods to calculate axial length. J Cataract Refract Surg. 2019;45(3):284–292. doi:10.1016/j.jcrs.2018.10.039
23. Shammas HJ, Shammas MC, Jivrajka RV, Cooke DL, Potvin R. Effects on IOL power calculation and expected clinical outcomes of axial length measurements based on multiple vs single refractive indices. Clin Ophthalmol. 2020;14:1511–1519. doi:10.2147/OPTH.S256851
24. Barrett GD. An improved universal theoretical formula for intraocular lens power prediction. J Cataract Refract Surg. 1993;19(6):713–720. doi:10.1016/S0886-3350(13)80339-2
25. Shammas HJ, Taroni L, Pellegrini M, Shammas MC, Jivrajka RV. Accuracy of newer intraocular lens power formulas in short and long eyes using sum-of-segments biometry. J Cataract Refract Surg. 2022;48(10):1113–1120. doi:10.1097/j.jcrs.0000000000000958
26. Goss DA, Grosvenor T. Reliability of refraction--a literature review. J Am Optom Assoc. 1996;67(10):619–630.
27. Gatinel D, Haouat M, Hoang-Xuan T. Etude des paramètres permettant la description mathématique de l'asphéricite cornéenne [A review of mathematical descriptors of corneal asphericity]. J Fr Ophtalmol. 2002;25(1):81–90. French.
28. Gjerdrum B, Gundersen KG, Lundmark PO, Aakre BM. Repeatability of OCT-based versus scheimpflug- and reflection-based keratometry in patients with hyperosmolar and normal tear film. Clin Ophthalmol. 2020;14:3991–4003. doi:10.2147/OPTH.S280868
 © 2023 The Author(s). This work is published and licensed by Dove Medical Press Limited. The
full terms of this license are available at https://www.dovepress.com/terms
and incorporate the Creative Commons Attribution
- Non Commercial (unported, 3.0) License.
By accessing the work you hereby accept the Terms. Non-commercial uses of the work are permitted
without any further permission from Dove Medical Press Limited, provided the work is properly
attributed. For permission for commercial use of this work, please see paragraphs 4.2 and 5 of our Terms.
© 2023 The Author(s). This work is published and licensed by Dove Medical Press Limited. The
full terms of this license are available at https://www.dovepress.com/terms
and incorporate the Creative Commons Attribution
- Non Commercial (unported, 3.0) License.
By accessing the work you hereby accept the Terms. Non-commercial uses of the work are permitted
without any further permission from Dove Medical Press Limited, provided the work is properly
attributed. For permission for commercial use of this work, please see paragraphs 4.2 and 5 of our Terms.