")
Back to Journals » International Journal of Nanomedicine » Volume 10 » Issue 1
Reduction of graphene oxide by resveratrol: a novel and simple biological method for the synthesis of an effective anticancer nanotherapeutic molecule
Authors Gurunathan S , Han JW, Kim E, Park JH, Kim J
Received 25 December 2014
Accepted for publication 8 March 2015
Published 15 April 2015 Volume 2015:10(1) Pages 2951—2969
DOI https://doi.org/10.2147/IJN.S79879
Checked for plagiarism Yes
Review by Single anonymous peer review
Peer reviewer comments 8
Editor who approved publication: Dr Thomas Webster
Sangiliyandi Gurunathan, Jae Woong Han, Eun Su Kim, Jung Hyun Park, Jin-Hoi Kim
Department of Animal Biotechnology, Konkuk University, Seoul, Republic of Korea
Objective: Graphene represents a monolayer or a few layers of sp2-bonded carbon atoms with a honeycomb lattice structure. Unique physical, chemical, and biological properties of graphene have attracted great interest in various fields including electronics, energy, material industry, and medicine, where it is used for tissue engineering and scaffolding, drug delivery, and as an antibacterial and anticancer agent. However, graphene cytotoxicity for ovarian cancer cells is still not fully investigated. The objective of this study was to synthesize graphene using a natural polyphenol compound resveratrol and to investigate its toxicity for ovarian cancer cells.
Methods: The successful reduction of graphene oxide (GO) to graphene was confirmed by UV-vis and Fourier transform infrared spectroscopy. Dynamic light scattering and scanning electron microscopy were employed to evaluate particle size and surface morphology of GO and resveratrol-reduced GO (RES-rGO). Raman spectroscopy was used to determine the removal of oxygen-containing functional groups from GO surface and to ensure the formation of graphene. We also performed a comprehensive analysis of GO and RES-rGO cytotoxicity by examining the morphology, viability, membrane integrity, activation of caspase-3, apoptosis, and alkaline phosphatase activity of ovarian cancer cells.
Results: The results also show that resveratrol effectively reduced GO to graphene and the properties of RES-rGO nanosheets were comparable to those of chemically reduced graphene. Biological experiments showed that GO and RES-rGO caused a dose-dependent membrane leakage and oxidative stress in cancer cells, and reduced their viability via apoptosis confirmed by the upregulation of apoptosis executioner caspase-3.
Conclusion: Our data demonstrate a single, simple green approach for the synthesis of highly water-dispersible functionalized graphene nanosheets, suggesting a possibility of replacing toxic hydrazine by a natural and safe phenolic compound resveratrol, which has similar efficacy in the reduction of GO to rGO. Resveratrol-based GO reduction would facilitate large-scale production of graphene-based materials for the emerging graphene-based technologies and biomedical applications.
Keywords: reduced graphene oxide, Raman spectroscopy, scanning electron microscopy, UV-vis spectroscopy, ROS generation, membrane integrity
Introduction
Graphene oxide (GO) is a multipurpose, solution-processable next-generation candidate material for application in ultrathin electronics, optoelectronics, energy conversion, and storage technologies.1–4 Graphene, a two-dimensional allotrope of carbon that displays an unusual honeycomb crystal structure, has received considerable attention in the field of nanoscience and technology because of its excellent physical, chemical, electrical, mechanical, and optical properties,5–7 and biocompatibility.8,9 Owing to its excellent characteristics, graphene can be potentially used in electronic devices such as flexible thin-film transistors, touch panels, and solar cells.5–7,10 Furthermore, graphene has been used in various biomedical applications such as bio-sensing,11 antibacterial composites,12–14 drug delivery,15 and tissue scaffolds.16
Due to the increasing demand for graphene in a wide range of industries, the production of high-quality graphene should be established. Several techniques have been adopted to prepare high-quality graphene such as chemical vapor deposition onto thin films of metal, epitaxial growth on electrically insulating surfaces like silicon carbide, and the scotch tape method.7 All these methods can produce highly crystalline graphene but are unsuitable for mass production.6,7 The most promising method for the large-scale production of graphene is chemical oxidation of graphite (Gt), conversion of the resulting Gt oxide to GO, and subsequent GO reduction. The reduction of GO to graphene can be accomplished by using chemical-reducing agents, flash photolysis, microwave irradiation, thermal shock, photocatalytic degradation, and catalytic reduction in liquid phase.5,7 In addition, several other methods have been developed for the synthesis of graphene and its derivatives, including exfoliation of Gt,17 flash reduction,18 hydrothermal dehydration,19 mechanical exfoliation,20 epitaxial growth,21 photocatalysis,22 photodegradation,23 and electrochemical exfoliation.24 Recently, Yang et al25 employed a simple approach to synthesize reduced GO sheets (rGOSs) and gold nanoparticles at room temperature on indium tin oxide-coated glass slides as disposable working electrodes for sensing dopamine.
GO reduction by chemical methods results in very limited solubility or even irreversible agglomeration of reduced GO (rGO) during preparation in water and most organic solvents (unless capping reagents are used) because of strong π–π stacking tendency between rGOSs.6,26 Besides, chemical oxidation–reduction methods often use toxic reducing agents for π–π stacking of graphene to form a graphitic structure.6,7,26 The most commonly used chemical-reducing agents are hydrous hydrazine, hydrazine monohydrate, sodium borohydride, and hydrogen sulfide, which are highly toxic and harmful to living organisms and the environment.6,9,26–28 To overcome the aggregation and solubility problems, several polymers or surfactants have been used such as poly(sodium-4-styrenesulfonate),29 alkaline conditions,30 poly(N-vinyl-2-pyrrolidone),31 and poly(allylamine).32
Recently, biological molecules have been used to reduce GO; thus, Salas et al33 have reported “green” reduction of GO via bacterial respiration.33 Several microorganisms have been shown to reduce GO, including Shewanella spp.,34 Escherichia coli,35,36 Pseudomonas aeruginosa,13 Bacillus marisflavi,36 and Ganoderma spp.9 A number of studies have also reported GO reduction using various biomolecules such as ascorbic acid,37 amino acids,38 glucose,39,40 bovine serum albumin,41 melatonin,42 and humanin.8 The use of biomaterials for the synthesis of graphene would save energy and time in downstream processing, and compared to bacterial reduction, it does not have the danger of introducing endotoxins.43,44 Biological modification of GO using resveratrol could provide better biocompatibility, solubility, and selectivity than chemical-reducing agents such as hydrazine and citrate. Therefore, in this study, we investigated the use of a purified polyphenolic compound resveratrol for GO reduction.
Graphene and graphene-related materials have recently been used as drug delivery and anticancer agents. Yang et al45 have shown tumor uptake and photothermal therapeutic effects of PEGylated GO using xenograft tumor mouse models. Akhavan et al40 have reported the efficacy of the glucose-rGOSs in photothermal therapy of LNCaP prostate cancer cells; in that case, GO suspension reduced and functionalized by glucose in the presence of Fe catalyst showed biocompatibility and excellent near-infrared (NIR) photothermal therapeutic efficiency, which exceeded that of hydrazine-rGO (H-rGO) single-walled and multi-walled carbon nanotube suspensions. Markovic et al46 have demonstrated differential photothermal anticancer activity of NIR-excited graphene and carbon nanotubes, and Kam et al47 have shown that polyvinyl pyrrolidone-coated graphene nanoparticles display higher photothermal responsiveness than single-walled carbon nanotubes (SWCNTs). Zhang et al48 have developed doxorubicin-loaded PEGylated nanoGO to combine cancer chemotherapy and photothermal therapy in one system. Their results demonstrate that such a combination exhibited synergistic effect, significantly improving the therapeutic efficacy of cancer treatment compared to each therapy alone. Gurunathan et al36 have shown that biologically obtained rGO had a significant dose-dependent toxicity against breast cancer MCF-7 cells, which was superior to that of GO.
Epithelial ovarian carcinoma is the fifth most frequent cause of cancer death in women and the leading cause of death from gynecological cancers.49,50 Although the majority of the tumors initially respond to chemotherapy, they eventually acquire chemoresistance.51 The resistance of recurrent tumors to cytotoxic drugs is the principal factor limiting the success of long-term treatment for ovarian cancer. The development of ovarian cancer appears to involve the emergence and subsequent expansion of cell clones resistant to apoptosis. The mechanisms underlying reduced apoptosis and the resultant chemotherapy resistance in ovarian cancer are complex. Therefore, it is a challenge to identify lead nanomaterials that target the resistance mechanisms and increase the sensitivity of ovarian tumors to conventional chemotherapeutic agents.
Resveratrol (trans-3,5,4′-trihydroxystilbene), a natural phenolic compound found in several plants, displays multiple biological effects such as antioxidant and pro-oxidant properties, and regulates a number of cellular processes.52,53 In the cell, resveratrol has several molecular targets, directly binding to estrogen receptors and the F1 component of mitochondrial ATP synthase; it also inhibits tubulin polymerization and induces cell cycle arrest and apoptosis.54,55 Ragione et al56 have reported that resveratrol exerts antiproliferative effects via regulation of the expression and phosphorylation of cyclin E, cyclin A, cdc2, and Rb, causing cell cycle arrest at the G2–S checkpoint. Resveratrol-induced apoptosis appears to involve caspase activation and stabilization of p53.57 Resveratrol has been found to interact with multiple molecular targets involved in inflammation and immunity by modulating the functional activity of macrophages, lymphocytes, and dendritic cells.58 Because of multiple biological effects elicited by resveratrol and resveratrol-like compounds, they have been investigated in pharmacological studies as antioxidants with allosteric mechanism in epigenetic drug targets.
The objective of this study was to develop a simple, dependable, and environmentally friendly approach for green reduction and functionalization of GO using resveratrol. Furthermore, we conducted comprehensive evaluation of GO and resveratrol-rGO (RES-rGO) toxicity by analyzing cell viability, membrane integrity, reactive oxygen species (ROS) generation, and apoptosis in ovarian cancer cell line A2780, an in vitro model to study the induction of epithelial-to-mesenchymal transition. The results of this study could open a new avenue for using natural products like resveratrol as nontoxic substitutes for hydrazine in large-scale production of solution-processable graphene. The obtained graphene could be applied as a biocompatible and efficient anticancer agent in next-generation nanotechnology-based therapeutic approaches.
Materials and methods
Materials
Gt powder, NaOH, KMnO4, NaNO3, anhydrous ethanol, 98% H2SO4, 36% HCl, 30% H2O2, resveratrol, fetal bovine serum (FBS), and the in vitro toxicology assay kit were purchased from Sigma-Aldrich (St Louis, MO, USA). Penicillin–streptomycin, trypsin ethylenediaminetetraacetic acid (EDTA), Dulbecco’s Modified Eagle’s Medium (DMEM), and 1% antibiotic–antimycotic solution were obtained from GIBCO (Life Technologies, Carlsbad, CA, USA). All other chemicals were purchased from Sigma-Aldrich unless stated otherwise.
GO synthesis
GO was synthesized as described previously with some modifications.9,13,59 In a typical synthesis process, 2 g of natural Gt powder was added to 350 mL of cooled (0°C) H2SO4, and then 8 g of KMnO4 and 1 g of NaNO3 were added gradually while stirring. The mixture was transferred to a 40°C water bath and stirred for 60 minutes. Deionized water (250 mL) was slowly added, and the temperature was increased to 98°C. The mixture was maintained at 98°C for 30 minutes, and the reaction was terminated by the addition of 500 mL of deionized water and 40 mL of 30% H2O2. The color of the mixture changed to brilliant yellow, indicating the oxidation of pristine Gt to GO. The mixture was then filtered and washed with diluted HCl to remove metal ions. Finally, the product was washed repeatedly with distilled water until pH 7.0 was achieved, and the synthesized GO was sonicated for 60 minutes.
Preparation of RES-rGO
GO reduction was performed as described previously9,13 with some modifications. RES-rGO was obtained using resveratrol both as a reducing agent and as a stabilizer. In a typical procedure, 50 μM resveratrol was mixed with 1 mg/mL of GO, sonicated for 15 minutes, and incubated at 40°C for 1 hour. The mixture was then cooled to room temperature and sonicated for additional 15 minutes. After vigorous stirring for 5 minutes, the mixture was stirred in a 90°C water bath for 1 hour. The resulting stable black dispersion was then centrifuged and washed with water three times, producing a homogenous RES-rGO suspension without aggregation. The obtained RES-rGOSs were redispersed in water before further use. To compare the reduction efficiency of resveratrol of GO suspension as compared to efficacy of H-rGO, we prepared H-rGO as described earlier41 and used as a control in all our experiments.
Characterization of GO and RES-rGO
GO and RES-rGO were characterized as described previously.9,13 UV-vis spectra were recorded using a WPA Biowave II spectrophotometer (Biochrom, Cambridge, UK). Particle size of the GO and RES-rGO dispersions was measured using a ZetasizerNano ZS90 instrument (Malvern Instruments, Malvern, UK). X-ray diffraction (XRD) analysis was performed in a Bruker D8 DISCOVER X-ray diffractometer (Bruker AXS GmbH, Karlsruhe, Germany). The X-ray source was 3 kW with a Cu target, and high-resolution XRD patterns were measured using a scintillation counter (λ=1.5406 Å). XRD was run at 40 kV and 40 mA, and samples diffraction was recorded at 2θ values between 5° and 50°. Dry GO or RES-rGO powder was suspended in KBr, and Fourier transform infrared (FTIR) spectroscopy was performed using a Spectrum GX spectrometer (Perkin Elmer Inc., Waltham, MA, USA) within the range of 500–4,000 cm−1. A JSM-6700F semi-in-lens field emission scanning electron microscope was used to acquire scanning electron microscopy (SEM) images. Solid samples were transferred to a carbon tape in an SEM sample holder, and the analysis was performed at an average working distance of 6 mm. GO and RES-rGO Raman spectra were measured using a WITEC Alpha300 laser at the wavelength of 532 nm. Calibration was initially performed using an internal silicon reference at 500 cm−1, which gave peak resolution of less than 1 cm−1. The spectra were measured from 500 cm−1 to 4,500 cm−1. All samples were deposited onto glass slides in powdered form without using solvent.
Cell culture and exposure to GO, RES-rGO, and H-rGO
Human ovarian A2780 cancer cells were cultured in DMEM supplemented with 10% FBS, 2 mM glutamine, and 100 U/mL penicillin–streptomycin, in a humidified 5% CO2 incubator at 37°C. The medium was replaced three times a week, and cells were passaged at subconfluency. At approximately 75% confluence, cells were harvested using 0.25% trypsin–EDTA and seeded in 75 cm2 flasks, six-well plates, or 96-well plates depending on the experiment. After 24 hours, the medium was replaced with fresh medium containing GO or RES-rGO or H-rGO at different concentrations (20–100 μg/mL); cells not exposed to GO or RES-rGO or H-rGO served as negative control. After 24-hour incubation, the treated cells were analyzed for viability, lactate dehydrogenase (LDH) release, ROS generation, and cell morphology examined using an OLYMPUS IX71 microscope (Olympus, Tokyo, Japan) with appropriate filter sets.
Cell viability assay
Cell viability was examined using the WST-8 assay as described previously.9,36 Typically, 1×10⁴ cells were seeded in 100 L of 10% FBS-containing DMEM in a 96-well plate. After 24 hours, the cells were washed with 100 μL of serum-free DMEM two times and incubated in 100 μL of serum-free DMEM containing different concentrations of GO or RES-rGO suspensions. After 24 hours of exposure, the cells were washed twice with serum-free DMEM, and 15 μL of the WST-8 solution was added to each well containing 100 μL of serum-free DMEM. After 1-hour incubation, 80 μL of the mixture was transferred to another 96-well plate because residual GO or RES-rGO could affect the absorbance measured at 450 nm using a microplate reader. Cell-free control experiments were performed to determine whether GO and RES-rGO directly reacted with the WST-8 reagent. For this, various concentrations of resveratrol (0–200 μM) or 100 μL of GO or RES-rGO or H-rGO suspensions (20–100 μg/mL) was incubated with 10 μL of the WST-8 reagent in a 96-well plate for 1 hour. The plates were centrifuged to precipitate GO and RES-rGO, and 100 μL of the supernatant was transferred to another 96-well plate to measure optical density at 450 nm.
Cell morphology
Ovarian cancer cells were plated in six-well plates (1×10⁴ cells per well) in 10% FBS-containing DMEM. After 24 hours, medium was changed to serum-free DMEM without or with 20 μg/mL of GO or RES-rGO or H-rGO and incubated for 12 hours or 24 hours. Cell morphology was examined using an optical microscope.
Membrane integrity
Cell membrane integrity of human ovarian cancer cells (A2780) was evaluated by determining LDH activity in cell supernatants according to the manufacturer’s instructions (In Vitro Toxicology Assay kit; Sigma-Aldrich) and as described previously.9 Briefly, cells were exposed to various concentrations of GO or RES-rGO or H-rGO (20–100 μg/mL) in triplicate for 24 hours; 100 μL of each cell-free supernatant was transferred to a new 96-well plate and mixed with 100 μL of the LDH reagent. After 3-hour incubation under standard conditions, optical density was determined at 490 nm using a microplate reader.
Determination of ROS
Intracellular ROS were measured based on the intracellular peroxide-dependent oxidation of 2′,7′-dichlorodihydrofluorescein diacetate (DCFH-DA, Molecular Probes, Thermo Fisher Scientific, Waltham, MA, USA) to a fluorescent compound 2′,7′-dichlorofluorescein, as previously described.9,36 Cells were seeded onto 24-well plates at a density of 5×10⁴ cells per well and cultured for 24 hours. After washing twice with phosphate-buffered saline (PBS), fresh medium containing different concentrations of GO or RES-rGO or H-rGO (20–100 μg/mL) was added, and the cells were incubated for 24 hours. The cells were then supplemented with 20 μM DCFH-DA, and incubation continued for 30 minutes at 37°C. The cells were rinsed with PBS, and 2 mL of PBS was added to each well, and fluorescence intensity was determined using a Gemini EM spectrofluorometer with the excitation at 485 nm and emission at 530 nm.
Measurement of caspase-3 activity
Caspase-3 activity was assayed as described earlier60 using a commercial kit (Sigma-Aldrich) according to the manufacturer’s instructions. Cancer cells were plated as above and treated without or with GO or RES-rGO or H-rGO (50 μg/mL), or caspase-3 inhibitor for 24 hours, washed with ice-cold PBS, and lysed with 100 μL of lysis buffer (50 mM Tris–HCl, pH 7.5, 150 mM NaCl, 1 mM ethylene glycol tetraacetic acid, 1 mM NaF, 1% Nonidet P-40, 1 mM phenylmethanesulfonylfluoride, and protease inhibitor cocktail) for 30 minutes at 4°C. The extracts were collected after centrifugation at 10,000 rpm for 10 minutes, and protein concentration was determined using the Bio-Rad protein assay kit (Bio-Rad, Hercules, CA, USA). Equal amounts (50 μg) of protein extracts were mixed with assay buffer (20 mM 4-(2-hydroxyethyl)-1-piperazineethanesulfonic acid, pH 7.4, 100 mM NaCl, 0.1% 3-[(3-cholamidopropyl)dimethylammonio]-1-propanesulfonate, 10 mM DTT, 1 mM EDTA, 10% sucrose), added to 96-well plates, and incubated with caspase-3 substrate acetyl-Asp-Glu-Val-Asp p-nitroanilide (Ac-DEVD-pNA) and caspase-3 inhibitor (Ac-DEVD-CHO) for 1 hour, and the absorbance was measured at 405 nm. The colorimetric assay is based on the hydrolysis of caspase-3 substrate by caspase-3, resulting in the release of the p-nitroaniline.
TUNEL assay
Apoptosis induced by RES-rGO was determined by terminal deoxynucleotidyl transferase dUTP nick end labeling (TUNEL) assay using the DNA fragmentation Imaging Kit (Roche) as per manufacturer’s instruction. Briefly, A2780 cells were seeded in six-well plates (1.5×10⁶ cells per well) for 24 hours, and then treated with 20 μg/mL of GO or RES-rGO or H-rGO for another 24 hours. Cells were detached with trypsin–EDTA, placed on 0.01% polylysine-coated slides, fixed with 4% methanol-free formaldehyde solution, and stained using terminal deoxynucleotidyltransferase and fluorescein-labeled deoxyuridine triphosphate for fluorescence-based detection of cells containing DNA breaks; cells were counterstained with 4′,6-diamidino-2-phenylindole (DAPI) to evaluate total cell number. Stained cells were observed using a Carl-Zeiss (Axiovert) epifluorescence microscope equipped with a triple band-pass filter. To determine the percentage of apoptotic cells, 1,000 cells were counted in each experiment. Merged images of TUNEL- and DAPI-stained cells were observed using a fluorescence microscope (OLYMPUS) at ×500 magnification.
Alkaline phosphatase activity
Alkaline phosphatase (ALP) activity was measured as described earlier.61 Briefly, A2780 cells were seeded in 2 mL of 10% FBS-supplemented DMEM at the density of 5×10⁴ cells/mL in a six-well plate and incubated for 24 hours. The medium was replaced with 10% FBS-DMEM containing GO or RES-rGO or H-rGO (50 μg/mL), and the cells were incubated for 5 days. ALP activity in cell lysates was measured using the DALP 250 QuantiChrom™ Alkaline Phosphatase Assay Kit (Gentaur, Brussels, Belgium) and expressed as units per milligram of protein. Protein concentration was measured using the Bradford assay kit (Thermo Fisher Scientific, Rockford, IL, USA).
Statistical analyses
The results are presented as the mean ± standard deviation of at least three independent experiments; all assays were performed in triplicate. The data were compared using Student’s t-test, and the difference was considered statistically significant at P-value less than 0.05.
Results and discussion
Synthesis and characterization of RES-rGO
First, we prepared GO sheets using the Hummers method.59 The optical absorption spectra of GO and RES-rGO suspensions are shown in Figure 1. After GO reduction by resveratrol, the color of suspension changed from light brown to black (Figure 1, inset), which can be attributed to partial restoration of the π network between the sheets due to the removal of oxygen-containing bonds, resulting in electronic conjugation within reduced sheets.10,39,40 The absorption spectra also showed that the absorption peak of GO suspension was around 231 nm, gradually red shifted to 260 nm, and the absorption in the whole spectral region increases with reaction time, suggesting that GO is reduced and the electronic conjugation within the graphene sheets is restored upon resveratrol reduction.40 Similarly, Zhu et al39 reported using glucose as a reducing agent for synthesis of graphene. The as-prepared GO samples showed a characteristic main absorbance peak at 231 nm, attributed to π–π* transitions of C=C in amorphous carbon systems, and broad absorption in the visible region. In addition, a broad shoulder at 300 nm indicating π–π* transitions of C=O was observed during the entire course of GO preparation, whereas RES-rGO showed a clear red shift to 260 nm, as reported earlier for rGO samples.40,62 The phenomenon of red shift has been used as an indicator of GO reduction (Figure 1). As a control, resveratrol alone shows the absorption spectra between 305 nm and 320 nm.
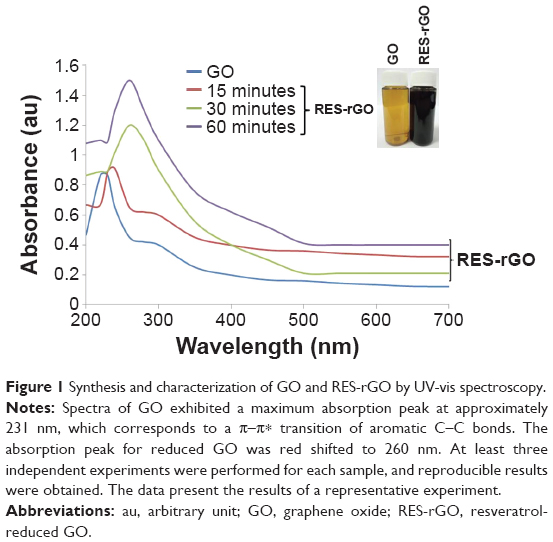 | Figure 1 Synthesis and characterization of GO and RES-rGO by UV-vis spectroscopy. |
XRD analysis of GO and RES-rGO
The crystallographic phase of GO and RES-rGO was examined by XRD. A strong diffraction peak was observed at 2θ=10.8°, indicating GO formation via chemical oxidation of Gt powder.63 The XRD pattern of GO showed a strong peak located in the low-angle region (approximately 10.8°), which is similar to those of other GO precursors.31,63 Gt oxidation involves the insertion of oxygen-containing groups, mainly carboxylic acid at the periphery and epoxide and hydroxyl groups between the planes, which leads to an increase in d-spacing to 7.8 Å with the diffraction peak at 2θ=10.8° (Figure 2A). This peak completely disappeared after resveratrol treatment, and a new peak at 2θ=25.9° emerged due to graphene diffraction.17 Thus, it can be concluded that resveratrol effectively rGO to graphene (Figure 2B). Interestingly, there were no obvious diffraction peaks of graphene observed in RES-rGO spectra, indicating that graphene sheets were homogeneously dispersed. Recently, Mhamane et al64 have reported a facile single-step synthesis of highly water-dispersible functionalized graphene nanosheets by plant extract-induced deoxygenation of GO. Our data indicate that GO reduction can be performed using resveratrol, which is in agreement with earlier studies using various natural products such as vitamin C,65 l-cysteine,66 and humanin8 as reducing agents. The results also show that the properties of resveratrol-converted graphene nanosheets are comparable to those of chemically reduced graphene nanosheets.
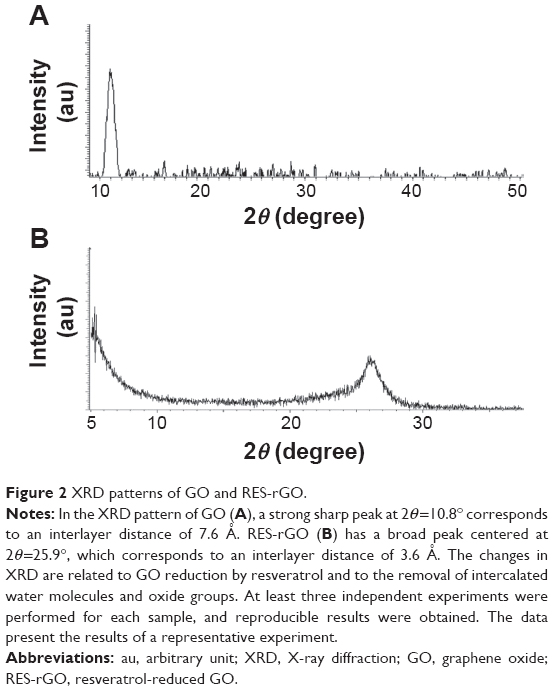 | Figure 2 XRD patterns of GO and RES-rGO. |
FTIR spectra of GO and RES-rGO
The reduction of oxygen-containing functional groups in GO and RES-rGO was confirmed by FTIR spectroscopy (Figure 2). The FTIR spectrum of GO revealed the presence of different oxygen-containing functional groups, OH (3,277 cm−1), C–OH (1,339 cm−1), C–O (1,096 cm−1), and C=O (1,016 cm−1), indicating that oxygen-containing groups were introduced into GO (Figure 3A). However, the FTIR spectrum of graphene was completely different from that of GO: after the treatment with resveratrol, the intensities of absorption peaks corresponding to oxygen-containing groups significantly decreased, indicating nearly complete reduction. The FTIR peak of RES-rGO showed stretching vibrations from O–H (3,314 cm−1) and C=C (1,639 cm−1); however, C–OH (1,391 cm−1) and C–O (1,099 cm−1) peaks almost disappeared (Figure 3B), indicating that GO was significantly reduced by resveratrol.
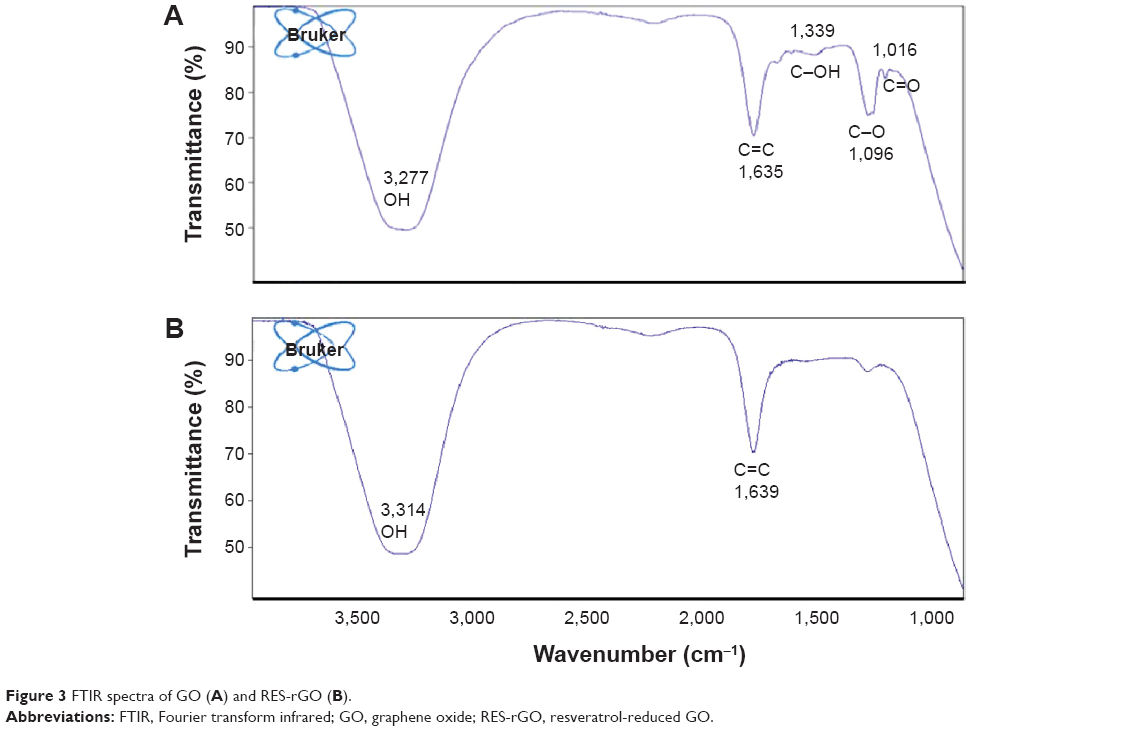 | Figure 3 FTIR spectra of GO (A) and RES-rGO (B). |
Dynamic light scattering analysis of GO and RES-rGO
Dynamic light scattering was employed to measure size distribution of GO and RES-rGO in aqueous solutions (250 μg/mL).9 The average hydrodynamic diameter of GO and RES-rGO was 325±7 nm and 540±20 nm, respectively (Figure 4A and B), indicating a significant increase in the particle size after GO reduction by resveratrol. This obvious change of size distribution suggests that resveratrol not only acted as a reducing agent but also functionalized the surface of the resulting rGO particles.67 From the Scherrer formula, the average size of the GO and RES-rGO crystallites can be calculated using the full width at half maximum of the most intense peak. For GO and RES-rGO, the average crystallite size was calculated to be 98.14 nm and 180.55 nm, respectively.
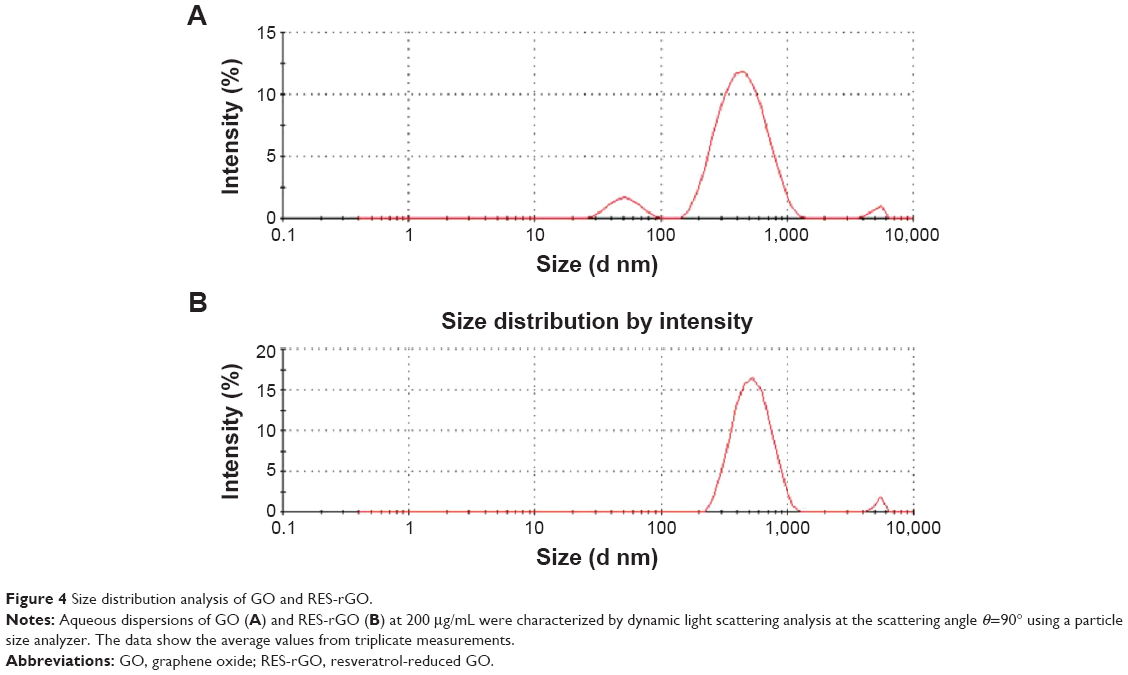 | Figure 4 Size distribution analysis of GO and RES-rGO. |
Lammel et al68 have observed size increase from 385 nm (GO) to 1,110 nm of carboxyl-functionalized graphene nanoplatelets. Wang et al69 have reported the increase in graphene particle size when GO was functionalized with heparin. Stankovich et al17 have shown that graphene nanoplates functionalized with isocyanate have effective hydrodynamic diameter of 560±60 nm. Liu et al70 have reported a significant increase in the size of aqueous dispersed graphene (2,930 nm) compared to that of GO (560 nm). We have also observed the increase in the size of rGO after the reduction with B. marisflavi,36 P. aeruginosa,13 Ginkgo biloba,61 and Ganoderma spp.9 and enhanced green fluorescent protein.66 Our present data are in good agreement with previous reports, indicating that resveratrol reduction effectively increased the size of rGO particles.
Surface morphology of GO and RES-rGO
The surface morphology of GO and RES-rGO was analyzed by SEM (Figure 5). GO was observed to have flaky texture, reflecting its layered microstructure (Figure 5A). GO samples contained several layers of aggregated and crumpled sheets closely associated with each other to form a continuous conducting network.67 Because of Gt exfoliation into GO, the edges of GO sheets appeared crumpled, folded, and closely restacked, and the surface had soft carpet-like morphology, possibly because of the presence of residual H2O molecules and hydroxyl or carboxyl groups.71 In contrast to GO, RES-rGO samples resembled transparent and rippled silk-like waves (Figure 5B). During the reduction process, RES-rGO acquired flaky, scale-like, or layered structure; it consisted of individual closely associated nanosheets with silky leaf-like morphology. These observations are in agreement with a previous study where graphene sheets obtained from GO by rapid thermal expansion in a nitrogen atmosphere showed a curled morphology consisting of thin, wrinkled, paper-like structures, and had fewer layers (approximately four) and larger specific surface area compared to GO.72 Graphene nanosheets functionalized with long chains and polymers showed coarse and hairy surface with blurry edges of the flakes.73
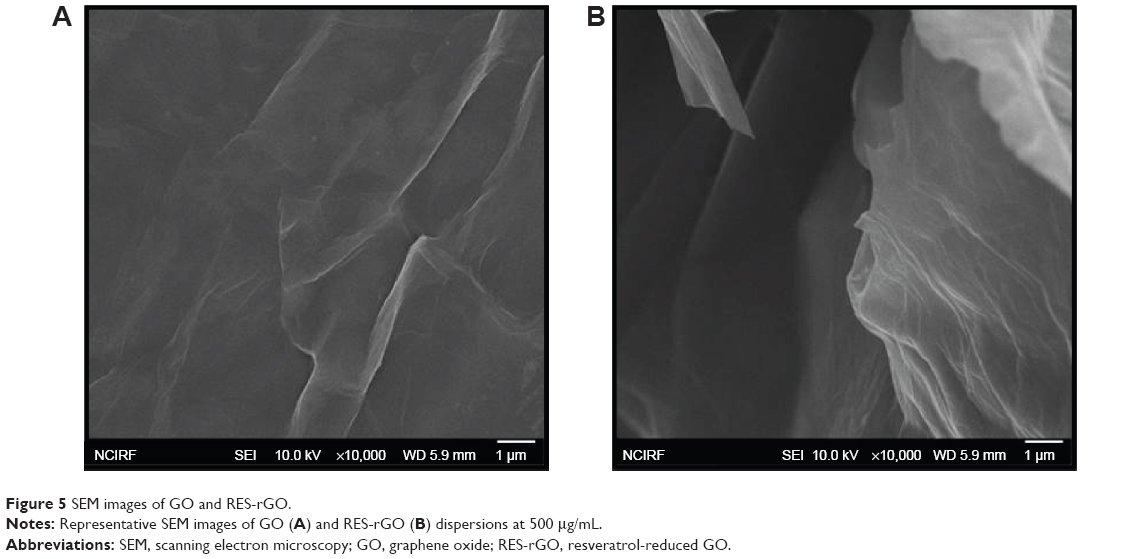 | Figure 5 SEM images of GO and RES-rGO. |
Raman spectroscopy analysis of GO and RES-rGO
Raman spectroscopy is employed to characterize the structural electronic properties, crystal structure, and disorders and defects in Gt, GO, and graphene-based materials; it is also used to measure induced structural changes during chemical oxidation of pristine Gt and GO to rGO reduction.74,75 In Raman spectra, GO reduction can be manifested by the changes in the relative intensity of two main D and G peaks. As shown in Figure 6A, D and G peaks of GO were located at 1,359 cm−1 and at 1,607 cm−1, whereas those of rGO shifted to 1,351 cm−1 and at 1,605 cm−1, respectively (Figure 6B), indicating a defect-induced breathing mode of sp2 rings74,75 common to an sp2-bonded carbon lattice, which originates from the stretching of C–C bonds. The G peaks at 1,607 cm−1 (GO) and 1,605 cm−1 (rGO) are due to the first-order scattering of the E2g phonon of sp2C atoms.74,75 The intensity of the D band is related to the size of the in-plane sp2 domains,76 and the increase in D peak intensity indicates the formation of additional sp2 domains. The intensity ratio of the two peaks (ID/IG) is a measure of disorder degree and is inversely proportional to the average size of the sp2 clusters.35,76 Here, we found that the ID/IG ratio for RES-rGO increased compared to that for GO (2.1 vs 1.70, respectively), suggesting the formation of new graphitic domains and the increase in the number of sp2 clusters,74 confirming that GO was successfully reduced by resveratrol.
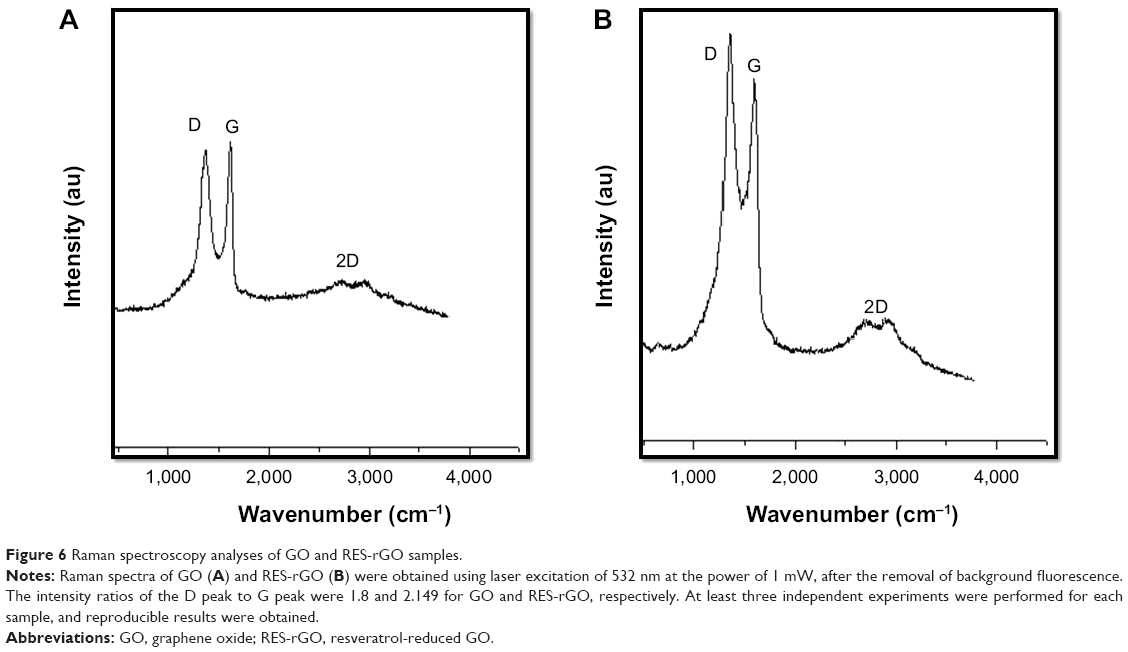 | Figure 6 Raman spectroscopy analyses of GO and RES-rGO samples. |
Atomic force microscopy imaging of GO and HN-rGO
Atomic force microscopy (AFM) is a valuable technique to examine surface morphology and height profiles of individual graphene sheets,73,77–79 and AFM images are regarded as the most important indication of the successful functionalization of graphene.73,77–79 Figure 7 shows typical AFM images of GO (Figure 7A) and RES-rGO (Figure 7B) dispersions in water after their deposition on a freshly cleaned glass surface. The AFM images of GO and RES-rGO samples displayed single-layer graphene sheets with lateral dimensions of several micrometers. RES-rGO height (11.14 nm) was larger than GO height (4.74 nm), which can be attributable to the presence of resveratrol functional groups in RES-rGO.
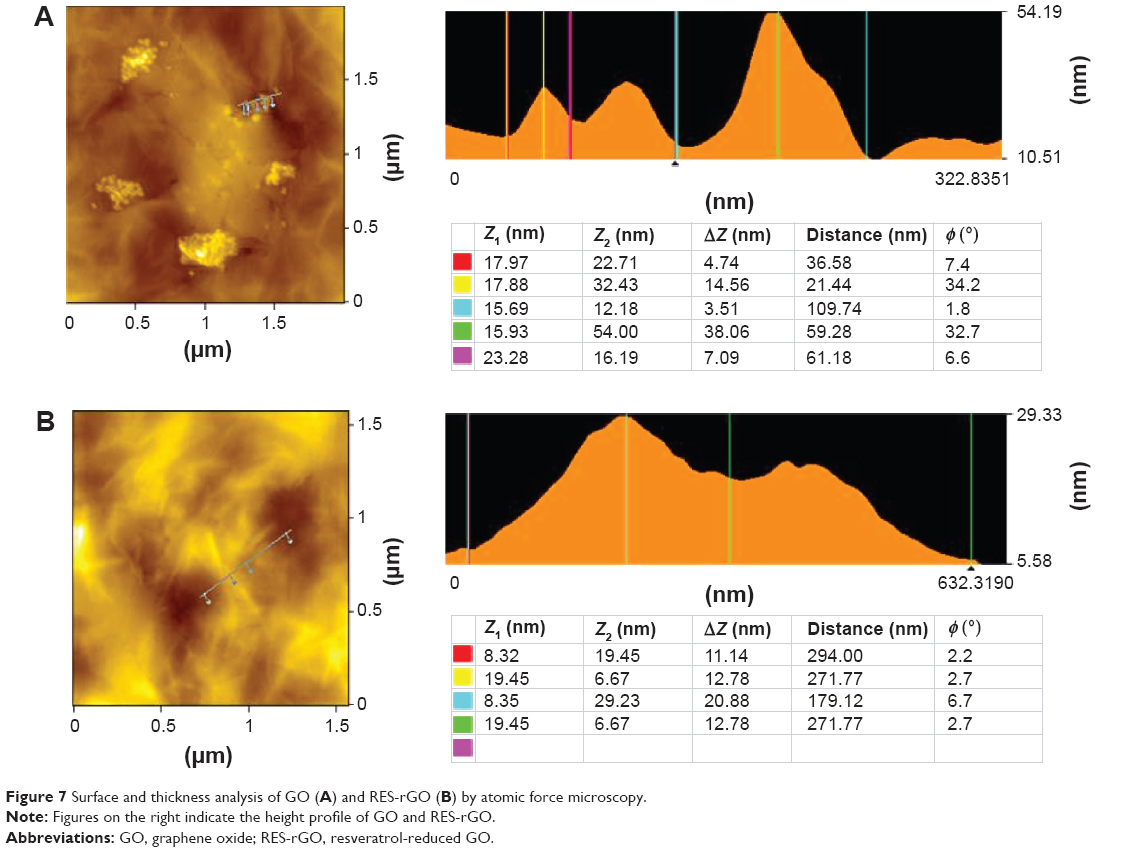 | Figure 7 Surface and thickness analysis of GO (A) and RES-rGO (B) by atomic force microscopy. |
The capping reagents may increase the thickness of the prepared graphene, although most of the oxygen-containing functional groups are removed after reduction.39 The biological molecules such as melatonin and glucose have been shown to increase graphene thickness through the attachment of oxidized melatonin and glucose molecules to both sides of the rGO, suggesting that the increase in thickness can be attributed to the adsorption of reductant entities.42 Our findings indicate that resveratrol can be a suitable reducing agent for the synthesis of graphene. Su et al80 have reported that molecules with large aromatic structure and extra negative charge are non-covalently immobilized on the basal plane of graphene sheets via strong interactions; they demonstrated that functionalization-based methodology is reliable and eventually produces graphene sheets of better quality and solubility. Interestingly, the results presented here reveal that single-layer distribution state prevents the aggregation of functionalized graphene, which should greatly facilitate further visualization, manipulation, modification, and application of graphene.73 Liu et al81 reported that small-sized GO had sheet structures with the thickness ranging from 0.7 nm to 1.5 nm, suggesting single- or double-layered sheets.
Effect of resveratrol on viability of ovarian cancer cells
In order to confirm the inhibitory effect of resveratrol, we first treated cells with various concentrations of resveratrol (0–200 μM) for 24 hours. The cytotoxicity of resveratrol on ovarian cancer cells was determined using the MTT (3-[4,5-dimethylthiazol-2-yl]-2,5-diphenyltetrazolium bromide) assay. The ovarian cancer cells were treated with resveratrol at various concentrations (5 μM, 10 μM, 25 μM, 50 μM, 100 μM, 150 μM, or 200 μM) for 24 hours. Resveratrol inhibited the viability of ovarian cancer cell in a dose- and time-dependent manner (Figure 8). The results showed that treatment with resveratrol at different concentrations ranging from 0 μM to 50 μM shows no significant effect on cell viability. However, the concentrations of 100 μM and 200 μM of resveratrol show significant inhibitory effect on cell viability.
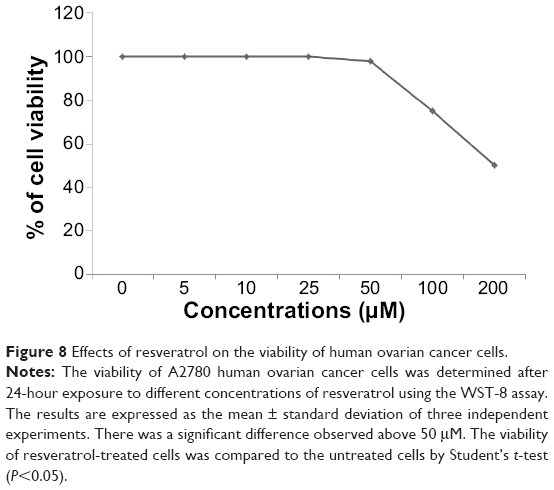 | Figure 8 Effects of resveratrol on the viability of human ovarian cancer cells. |
Dose-dependent effect of resveratrol, GO, RES-rGO, and H-rGO on cell viability
To assess cytotoxic effects of GO and RES-rGO, A2780 human ovarian cancer cells were incubated with different concentrations of GO and RES-rGO (20–100 μg/mL) for 24 hours. As shown in Figure 9, both GO and RES-rGO decreased the viability of A2780 cells in a dose-dependent manner. However, RES-rGO was significantly more cytotoxic compared to GO, which could induce cell death in less than 60% of A2780 cells even at the highest tested concentration, whereas RES-rGO already caused significant cytotoxicity at 20 μg/mL, and at 80 μg/mL, 90% of the cells were dead, whereas H-rGO also shows significant toxicity. These data demonstrate that RES-rGO exerts a considerable dose-dependent cytotoxic effect, which is consistent with that of other nanomaterials.82,83 Akhavan et al84,85 have reported that graphene sheets and rGO nanoplatelets (rGONPs) affected the viability of human mesenchymal stem cells in a concentration- and size-dependent manner. They showed that rGONPs with the average lateral dimension (ALD) of 11±4 nm exhibited a significant cytotoxic effect at 1.0 μg/mL after 1-hour treatment, whereas rGOSs with 3.8±0.4 μm ALD were markedly cytotoxic only at the high concentration of 100 μg/mL. Jaworski et al86 have reported that graphene platelets at the concentration of 100 μg/mL reduced the viability of human glioblastoma U87 and U118 cells to 54% and 60%, respectively. It has been suggested that the cytotoxicity of rGOSs was due to extremely sharp edges and charge transfer between the cells and graphene material.14 On the other hand, graphene could interact with the cell surface causing cell detachment or, depending on the particle size, enter the intracellular environment where it may interact with intracellular proteins, organelles, and DNA, inducing apoptosis and ultimately, cell death.87
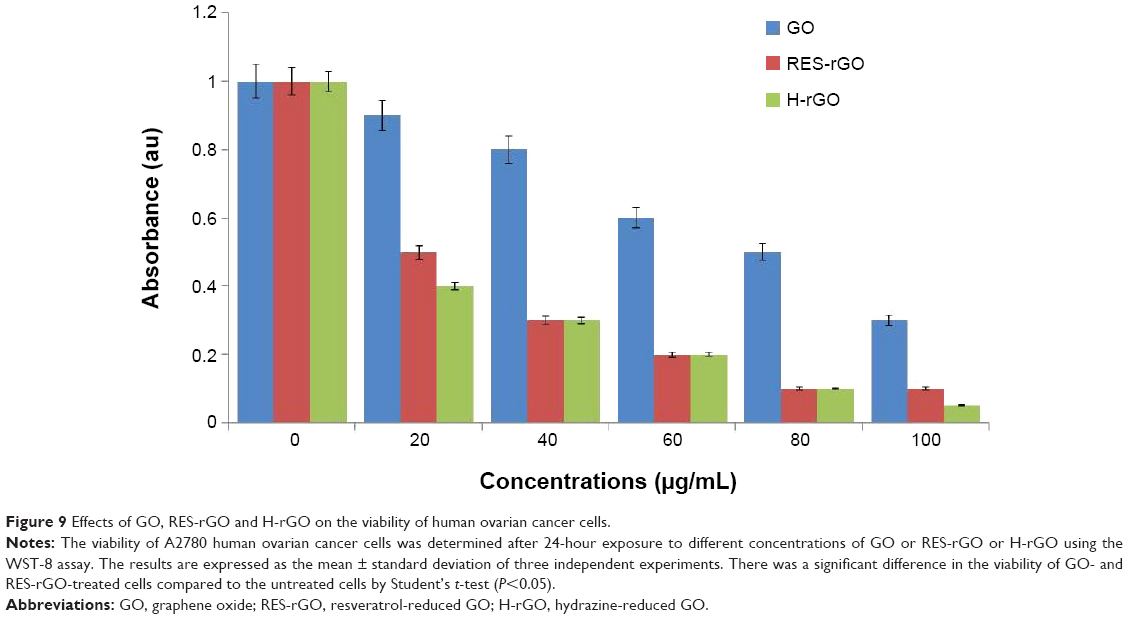 | Figure 9 Effects of GO, RES-rGO and H-rGO on the viability of human ovarian cancer cells. |
Effect of RES-rGO on cell morphology
To further explore cytotoxicity of GO, RES-rGO, and H-rGO, we examined their effects on the morphology of A2780 cells by light microscopy. GO, RES-rGO, and H-rGO induced significant time-dependent morphological changes, including the loss of cell shape, disruption of cell monolayers, and reduction of cell adhesion, indicative of impaired cell vitality. Figure 10 shows the morphology of A2780 cell monolayers incubated without (control) or with 20 μg/mL of GO or RES-rGO or H-rGO for 24 hours. The analysis revealed a clear difference between RES-rGO-treated and the control cells. Control A2780 monolayers appeared as small round clumps of undifferentiated cells with indistinct cellular borders, whereas RES-rGO- and H-rGO-treated cells had a more columnar epithelial-like appearance with distinct cellular boundaries, and developed more protrusions, which were longer and more numerous compared to the untreated cells. GO, RES-rGO, and H-rGO affected cell structural integrity and substrate adhesion, but cytotoxic effects of RES-rGO and H-rGO were more significant. These results are in agreement with those reported by Jaworski et al86 who showed that graphene platelets affected the adhesion of glioblastoma U87 and U118 cells.
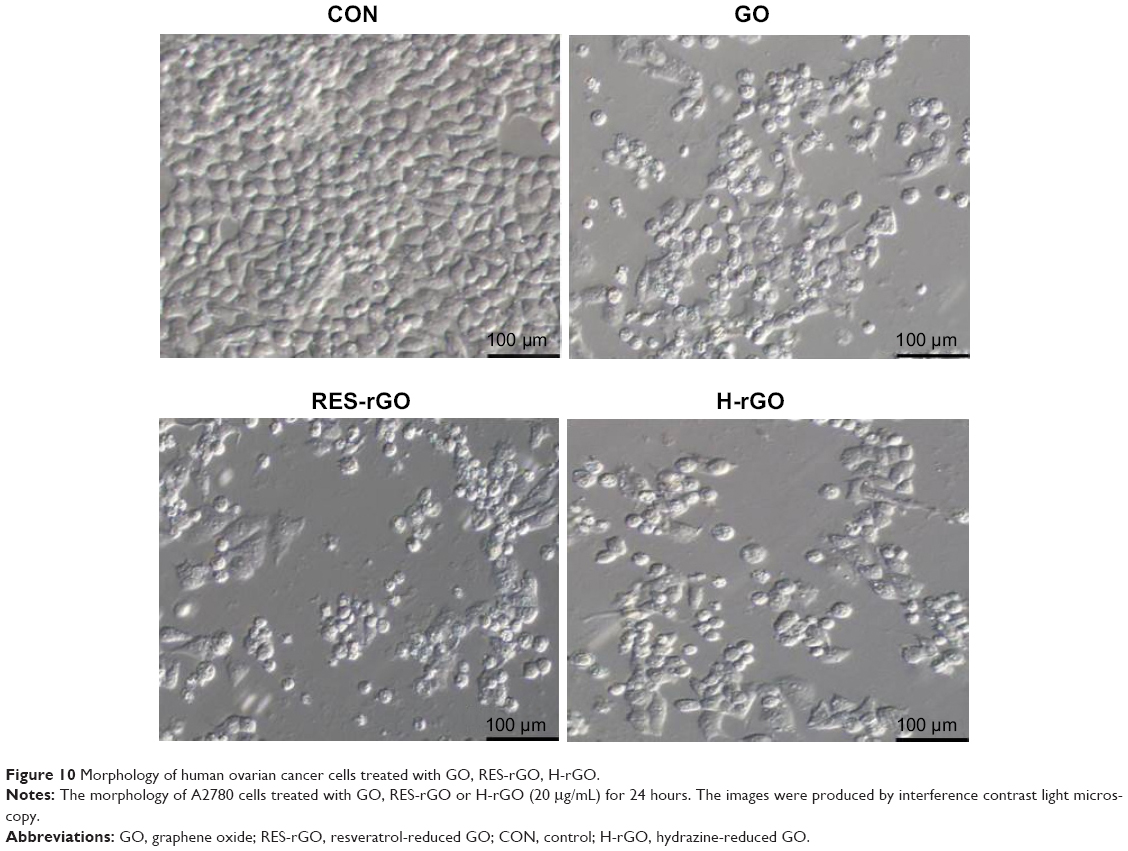 | Figure 10 Morphology of human ovarian cancer cells treated with GO, RES-rGO, H-rGO. |
Effect of RES-rGO on membrane integrity
Membrane integrity, which is an important factor determining cell survival, was analyzed by the leakage of intracellular LDH molecules into culture medium.86 GO, RES-rGO, and H-rGO caused dose-dependent LDH release into A2780 cell culture supernatant (Figure 11), suggesting the disruption of the cell membrane. The treatment with RES-rGO and H-rGO caused a more pronounced negative effect on the membrane integrity of A2780 cells than GO, indicating enhanced cytotoxicity, whereas RES-rGO and H-rGO show significant leakage. Zhang et al83 have reported that graphene aggregation induced LDH leakage in rat pheochromocytoma PC12 cells, while Wang et al88 have demonstrated that GO caused cytotoxicity and genotoxicity in human lung fibroblast cells, which correlated with its effects on cell membrane integrity and depended on particle size, shape, composition, and surface charge and chemistry.
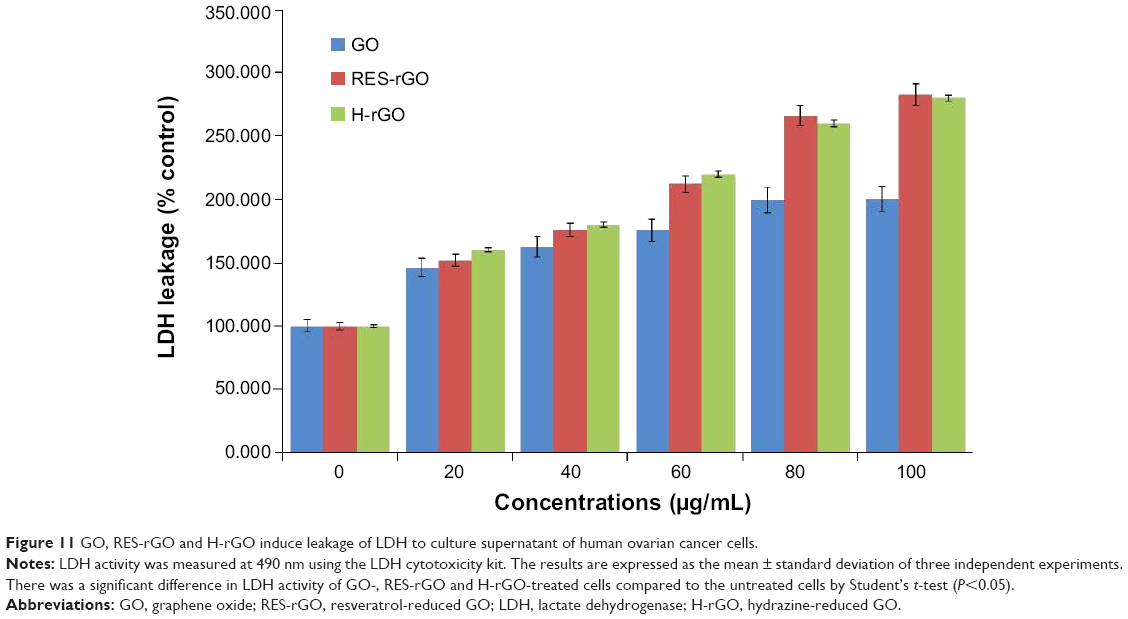 | Figure 11 GO, RES-rGO and H-rGO induce leakage of LDH to culture supernatant of human ovarian cancer cells. |
RES-rGO-induced oxidative stress
The generation of oxidative stress is one of the important factors involved in triggering cell death. Earlier studies have found the increase in ROS production in the cells exposed to nanoparticles such as fullerenes and single-walled nanotubes,89 and graphene.9,13,60 In this study, oxidative stress was evaluated by the measurement of ROS levels. As shown in Figure 12, GO and RES-rGO and H-rGO induce ROS generation in a concentration-dependent manner, and significantly induced ROS generation compared to the untreated control cells, and as it was observed for other cytotoxicity parameters, the effect of RES-rGO was stronger than that of GO. H-rGO-treated cells also show similar effect of RES-rGO. Excessive ROS generation may be a mechanism underlying the cytotoxicity of GO and RES-rGO, as has been shown to be the case for other nanomaterials such as SWCNTs or silver nanoparticles.60 Previous studies have indicated that the interaction of nanoparticles with the cell membrane triggered ROS generation and oxidative stress, which may cause breakdown of membrane lipids, alterations in metabolic pathways, and apoptosis.88,90,91 The increase in ROS production by GO and RES-rGO is in agreement with the results of the WST-8 and LDH assays, suggesting that GO and RES-rGO induce cytotoxicity via oxidative stress. Reddy et al92 have shown that multi-walled carbon nanotubes induce oxidative stress-dependent cytotoxicity in cultured human embryonic kidney cells. Another study has demonstrated that GO and carboxyl graphene nanoplatelets concentration- and time dependently induce ROS in human hepatocellular carcinoma HepG2 cells.68 Wu et al93 have reported dose-dependent toxicity of GO in Caenorhabditis elegans. The morphology of graphene nanoparticles and their chemical and physical properties significantly depend on the synthesis method, which thus play an important role in defining differential cellular responses.94 It is known that surface functionality of nanomaterials directly affects cell viability and intracellular particle accumulation.83,95 Both graphene and SWCNTs induce cytotoxic effects, which depend on their concentration and shape.
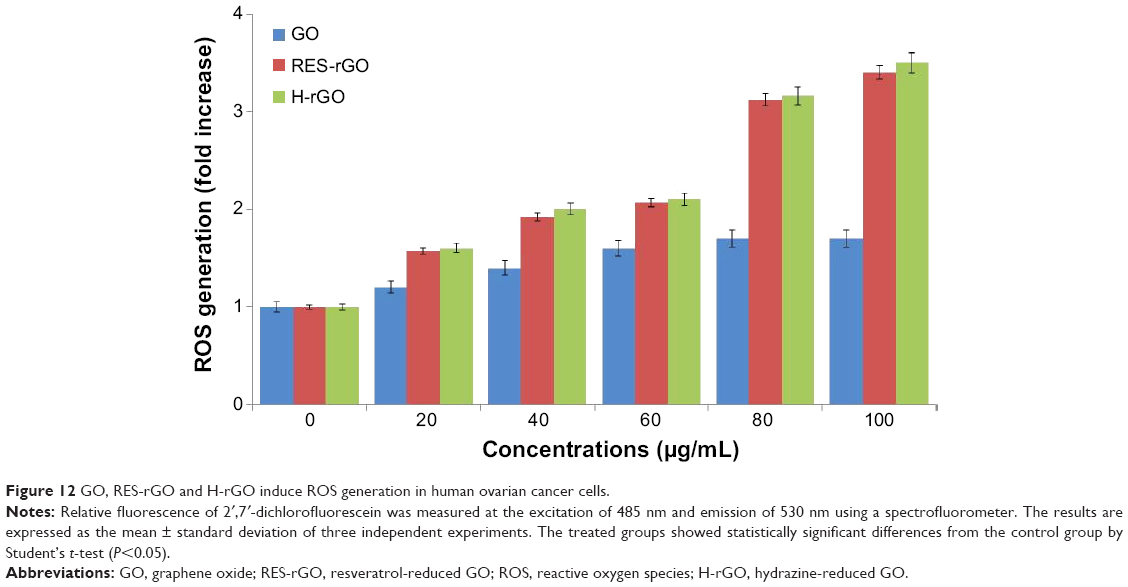 | Figure 12 GO, RES-rGO and H-rGO induce ROS generation in human ovarian cancer cells. |
Involvement of caspase-3 in RES-rGO-induced toxicity
Cysteine proteases of the caspase family are critical components of the apoptotic machinery in mammals, and are involved in other important biological processes such as inflammation, cell differentiation, proliferation, and cell cycle regulation, cell division, and fusion.96 To further understand the molecular mechanisms underlying cytotoxic effects of RES-rGO in A2780 cells, we investigated possible involvement of apoptosis by measuring the activity of caspase-3. The cells were treated or not with a caspase inhibitor DEVD-CHO and challenged with GO or RES-rGO or H-rGO for 24 hours; cell lysates were then analyzed for caspase-3 activity by a spectrophotometric assay. Figure 13 illustrates the increase in the levels of caspase-3 activity induced by GO, RES-rGO, and H-rGO treatment, whereas the caspase-3 inhibitor reduced the level of caspase-3 activation back to that of the untreated cells, suggesting that graphene may induce apoptosis in ovarian cancer cells in a caspase-3-dependent manner. Consistent with the results presented above, RES-rGO stimulated a more significant increase (16-fold) in caspase-3 activity compared to that of GO (tenfold). Li et al82 have shown the activation of caspase-3 in pristine graphene-treated RAW 264.7 cells, confirming the involvement of caspase-3 in graphene-mediated apoptosis. Caspase-3 is one of the most important executioner caspases activated by both extrinsic (death ligand-mediated) and intrinsic (mitochondria-mediated) cellular apoptotic pathways.82,97,98 Zhang et al83 have demonstrated that graphene stimulates both ROS generation and caspase-3 activation in a concentration- and time-dependent manner, indicating the induction of apoptosis. Our results and previously reported data suggest that graphene nanoparticles may induce apoptotic cell death via activation of caspase-3.
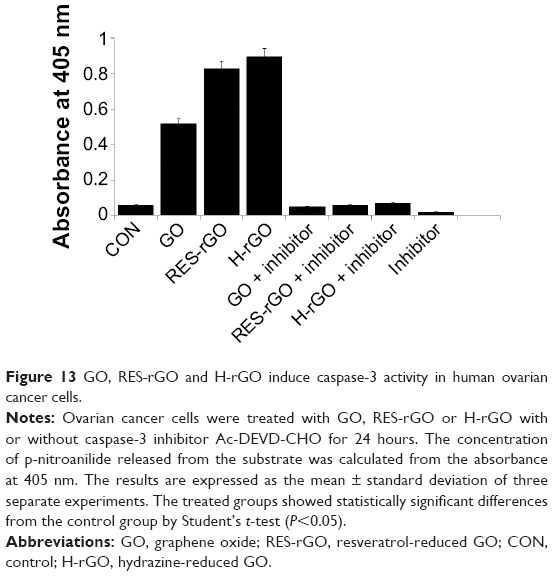 | Figure 13 GO, RES-rGO and H-rGO induce caspase-3 activity in human ovarian cancer cells. |
RES-rGO promoted apoptosis
To further confirm the induction of apoptosis by graphene nanoparticles, we investigated cellular DNA fragmentation, which is a hallmark of apoptosis. Several reports have shown that carbon nanomaterials such as nanodiamonds and multi-walled carbon nanotubes can induce the expression of chromosomal DNA-damage biomarkers p53, MOGG-1, and Rad51. In addition, the present and earlier data show that GO, RES-rGO, and other carbon nanomaterials induce ROS generation, which can also cause DNA fragmentation81,99,100 via PARP activity involved in various cellular functions, including DNA repair, cell cycle, and cell death.101 To confirm the induction of apoptosis in A2780 cells by GO and RES-rGO, the TUNEL assay was performed. The treatment with RES-rGO and H-rGO caused the appearance of a significant number of TUNEL-positive A2780 cells, whereas in control, no apoptotic cells were observed (Figure 14). GO also induced DNA fragmentation in A2780 cells, although to a lesser degree than RES-rGO, which, consistent with the cytotoxicity assays, caused apoptosis in almost 90% of the cells after 24-hour exposure (Figure 14). These data indicate that RES-rGO cytotoxicity is associated with the induction of apoptosis. Zhang et al102 have shown that daunorubicin-loaded graphene–gold nanocomposites induce apoptosis by activating caspases 8 and 3 and inhibit the growth of multidrug-resistant leukemia cells in vivo. Collectively, these data strongly suggest that graphene nanoparticles can induce apoptosis in cancer cells.
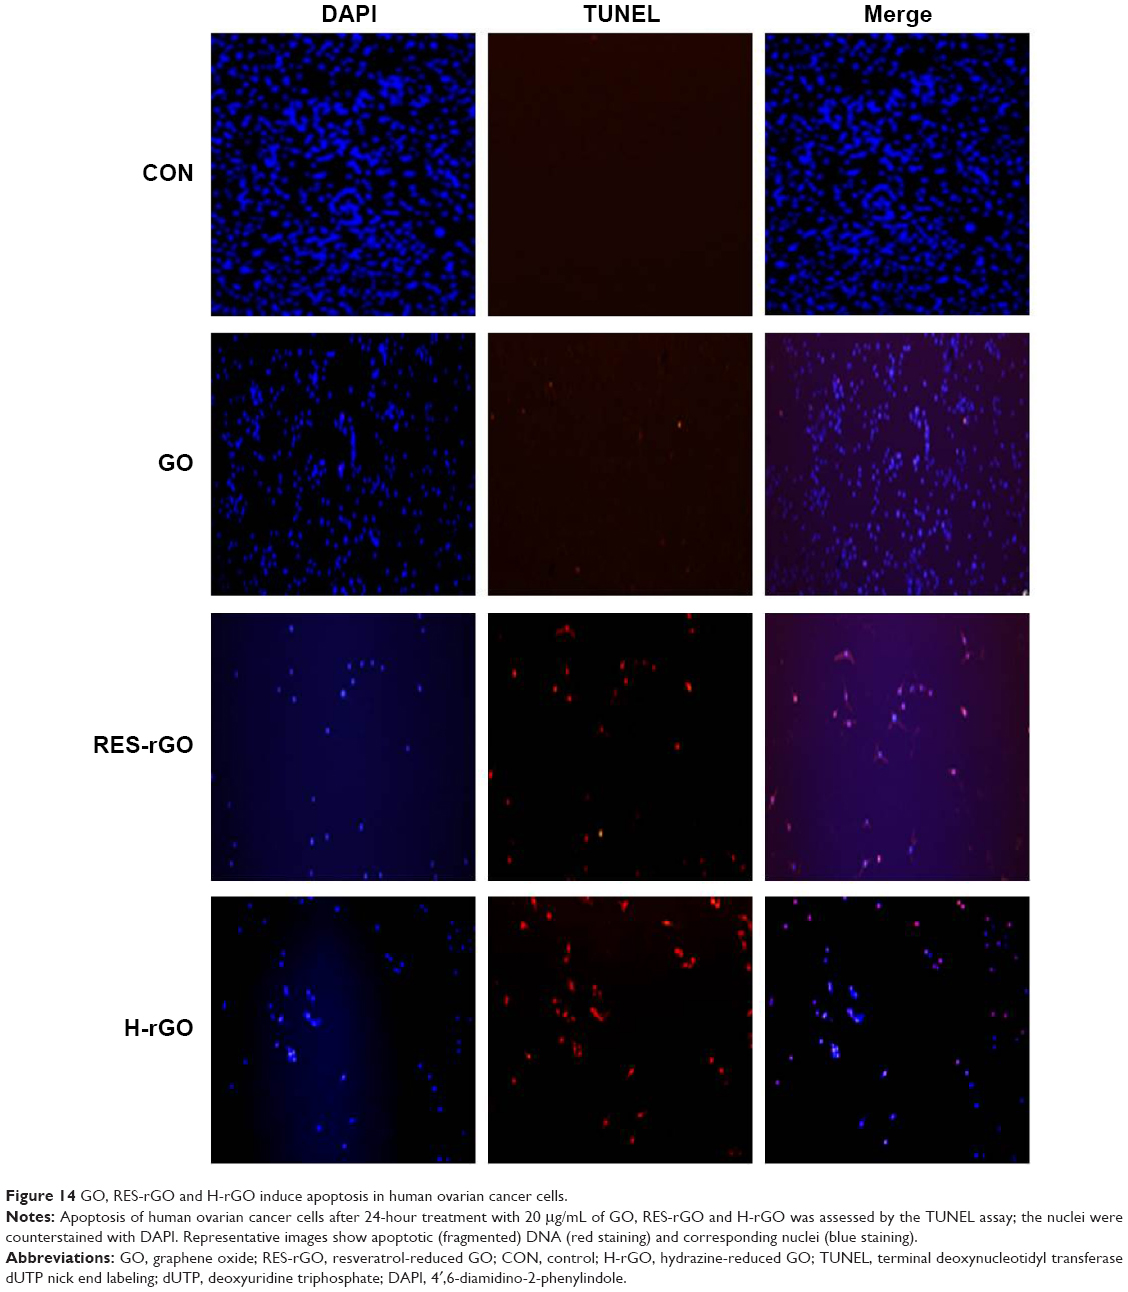 | Figure 14 GO, RES-rGO and H-rGO induce apoptosis in human ovarian cancer cells. |
Effect of RES-rGO on ALP activity
ALP is a membrane enzyme involved in the mineralization of skeletal tissues, and ALP activity is considered a biomarker of differentiation in various cell types, including osteoblasts and ovarian cancer cells.103,104 To examine whether the changes in cell morphology, reduced cell viability, and increased apoptosis of graphene-treated ovarian cancer cells correlated with cellular differentiation, we examined ALP activity in post-proliferative A2780 cells exposed to GO or RES-rGO or H-rGO (20 μg/mL) for 5 days. RES-rGO significantly decreased the activity of ALP compared to untreated control cells (Figure 15). It has been previously shown that mesenchymal stromal cells adhered and proliferated better on graphene films than on an SiO2 substrate.105 Other studies have demonstrated that osteoblast cells treated with hydroxyapatite-rGO showed higher ALP activity than untreated cells.106,107 In contrast, Zhang et al108 have shown that bone osteosarcoma MG63 cells treated with nanographene platelets had reduced ALP expression compared to untreated cells.108 In our previous study, we have not observed changes in ALP activity in MDA-MB-231 human breast cancer cells treated with G. biloba leaf extract-rGO.61 Such a discrepancy in the results suggests that the biocompatibility or toxicity of rGO is dependent on physicochemical and biological properties of graphene-based materials, including size, conductivity, density of functional groups, and type of reducing agents used for GO deoxygenation as well as tested cell types.
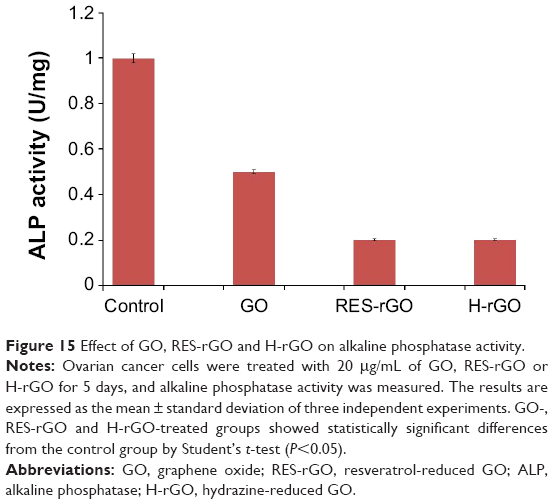 | Figure 15 Effect of GO, RES-rGO and H-rGO on alkaline phosphatase activity. |
Conclusion
Here we described a simple, facile, and quick one-step green approach for GO reduction using a natural phenolic compound resveratrol. This method allows avoiding toxic and environmentally harmful reducing agents such as hydrazine and hydrogen sulfide often used for chemical GO reduction to obtain graphene. UV-vis spectroscopy, XRD, SEM, and Raman spectroscopy provide clear evidence for the formation of graphene after GO reduction with resveratrol. These findings suggest that a powerful natural reducing agent can be highly efficient in causing deoxygenation of GO suspensions and can thus serve as a suitable substitute for hydrazine in large-scale production and application of graphene-based materials. Furthermore, RES-rGO demonstrated significant dose-dependent cytotoxicity for A2780 ovarian cancer cells in that it reduced cell viability and produced marked changes in cellular morphology via activation of caspase-3-mediated apoptosis and reduction of ALP activity. These results open a new avenue for potential application of RES-rGO as a promising biocompatible nanomaterial to effective nanotherapy of cancer and prevention and treatment of osteoporosis. Further studies are required to clarify the detailed molecular mechanisms underlying the activity of GO and rGO in cancer treatment.
Acknowledgments
This work was supported by the KU-Research Professor Program of Konkuk University. Dr Sangiliyandi Gurunathan was supported by a Konkuk University KU-Full-time Professorship. This work was also supported by the Woo Jang-Choon project (PJ007849).
Disclosure
The authors report no conflicts of interest in this work.
References
Loh KP, Bao QL, Eda G, Chhowalla M. Graphene oxide as a chemically tunable platform for optical applications. Nat Chem. 2010;2(12):1015–1024. | ||
Eda G, Fanchini G, Chhowalla M. Large-area ultrathin films of reduced graphene oxide as a transparent and flexible electronic material. Nat Nanotechnol. 2008;3(5):270–274. | ||
Zhu XJ, Zhu YW, Murali S, Stollers MD, Ruoff RS. Nanostructured reduced graphene oxide/Fe2O3 composite as a high-performance anode material for lithium ion batteries. ACS Nano. 2011;5(4):3333–3338. | ||
Kumar PV, Bardhan NM, Tongay S, Wu J, Belcher AM, Grossman JC. Scalable enhancement of graphene oxide properties by thermally driven phase transformation. Nat Chem. 2014;6(2):151–158. | ||
Geim AK, Novoselov KS. The rise of graphene. Nat Mater. 2007;6(3):183–191. | ||
Kim YK, Kim MH, Min DH. Biocompatible reduced graphene oxide prepared by using dextran as a multifunctional reducing agent. Chem Commun. 2011;47(11):3195–3197. | ||
Park S, Ruoff RS. Chemical methods for the production of graphenes. Nat Nanotechnol. 2009;4(4):217–224. | ||
Gurunathan S, Han J, Kim JH. Humanin: a novel functional molecule for the green synthesis of graphene. Colloids Surf B Biointerfaces. 2013;111:376–383. | ||
Gurunathan S, Han J, Park JH, Kim JH. An in vitro evaluation of graphene oxide reduced by Ganoderma spp. in human breast cancer cells (MDA-MB-231). Int J Nanomedicine. 2014;9:1783–1797. | ||
Li XL, Wang XR, Zhang L, Lee SW, Dai HJ. Chemically derived, ultrasmooth graphene nanoribbon semiconductors. Science. 2008;319(5867):1229–1232. | ||
Lu CH, Yang HH, Zhu CL, Chen X, Chen GN. A graphene platform for sensing biomolecules. Angew Chem Int Ed Engl. 2009;48(26):4785–4787. | ||
Hu W, Peng C, Luo W, et al. Graphene-based antibacterial paper. ACS Nano. 2010;4(7):4317–4323. | ||
Gurunathan S, Han JW, Dayem AA, Eppakayala V, Kim JH. Oxidative stress-mediated antibacterial activity of graphene oxide and reduced graphene oxide in Pseudomonas aeruginosa. Int J Nanomedicine. 2012;7:5901–5914. | ||
Akhavan O, Ghaderi E. Toxicity of graphene and graphene oxide nanowalls against bacteria. ACS Nano. 2010;4(10):5731–5736. | ||
Sun X, Liu Z, Welsher K, et al. Nano-graphene oxide for cellular imaging and drug delivery. Nano Res. 2008;1(3):203–212. | ||
Nayak TR, Andersen H, Makam VS, et al. Graphene for controlled and accelerated osteogenic differentiation of human mesenchymal stem cells. ACS Nano. 2011;5(6):4670–4678. | ||
Stankovich S, Dikin DA, Piner RD, et al. Synthesis of graphene-based nanosheets via chemical reduction of exfoliated graphite oxide. Carbon N Y. 2007;45(7):1558–1565. | ||
Cote LJ, Cruz-Silva R, Huang JX. Flash reduction and patterning of graphite oxide and its polymer composite. J Am Chem Soc. 2009;131(31):11027–11032. | ||
Zhou Y, Bao QL, Tang LAL, Zhong YL, Loh KP. Hydrothermal dehydration for the “green” reduction of exfoliated graphene oxide to graphene and demonstration of tunable optical limiting properties. Chem Mater. 2009;21(13):2950–2956. | ||
Dreyer DR, Ruoff RS, Bielawski CW. From conception to realization: an historial account of graphene and some perspectives for its future. Angew Chem Int Ed Engl. 2010;49(49):9336–9344. | ||
Hass J, de Heer WA, Conrad EH. The growth and morphology of epitaxial multilayer graphene. J Phys Condens Matter. 2008;20(32):323202. | ||
Akhavan O, Ghaderi E. Photocatalytic reduction of graphene oxide nanosheets on TiO2 thin film for photoinactivation of bacteria in solar light irradiation. J Phys Chem C. 2009;113(47):20214–20220. | ||
Akhavan O, Abdolahad M, Esfandiar A, Mohatashamifar M. Photodegradation of graphene oxide sheets by TiO2 nanoparticles after a photocatalytic reduction. J Phys Chem C. 2010;114(30):12955–12959. | ||
Su CY, Lu AY, Xu YP, Chen FR, Khlobystov AN, Li LJ. High-quality thin graphene films from fast electrochemical exfoliation. ACS Nano. 2011;5(3):2332–2339. | ||
Yang J, Strickler JR, Gunasekaran S. Indium tin oxide-coated glass modified with reduced graphene oxide sheets and gold nanoparticles as disposable working electrodes for dopamine sensing in meat samples. Nanoscale. 2012;4(15):4594–4602. | ||
Khanra P, Kuila T, Kim NH, Bae SH, Yu DS, Lee JH. Simultaneous bio-functionalization and reduction of graphene oxide by baker’s yeast. Chem Eng J. 2012;183:526–533. | ||
Akhavan O, Choobtashani M, Ghaderi E. Protein degradation and RNA efflux of viruses photocatalyzed by graphene-tungsten oxide composite under visible light irradiation. J Phys Chem C. 2012;116(17):9653–9659. | ||
Gurunathan S, Han JW, Eppakayala V, Kim JH. Biocompatibility of microbially reduced graphene oxide in primary mouse embryonic fibroblast cells. Colloids Surf B Biointerfaces. 2013;105:58–66. | ||
Stankovich S, Piner RD, Chen XQ, Wu NQ, Nguyen ST, Ruoff RS. Stable aqueous dispersions of graphitic nanoplatelets via the reduction of exfoliated graphite oxide in the presence of poly(sodium 4-styrenesulfonate). J Mater Chem. 2006;16(2):155–158. | ||
Fan XB, Peng WC, Li Y, et al. Deoxygenation of exfoliated graphite oxide under alkaline conditions: a green route to graphene preparation. Adv Mater. 2008;20(23):4490–4493. | ||
Tang LA, Lee WC, Shi H, et al. Highly wrinkled cross-linked graphene oxide membranes for biological and charge-storage applications. Small. 2012;8(3):423–431. | ||
Min K, Han TH, Kim J, et al. A facile route to fabricate stable reduced graphene oxide dispersions in various media and their transparent conductive thin films. J Colloid Interface Sci. 2012;383:36–42. | ||
Salas EC, Sun ZZ, Luttge A, Tour JM. Reduction of graphene oxide via bacterial respiration. ACS Nano. 2010;4(8):4852–4856. | ||
Wang GM, Qian F, Saltikov C, Jiao YQ, Li Y. Microbial reduction of graphene oxide by Shewanella. Nano Res. 2011;4(6):563–570. | ||
Akhavan O, Ghaderi E. Escherichia coli bacteria reduce graphene oxide to bactericidal graphene in a self-limiting manner. Carbon N Y. 2012;50(5):1853–1860. | ||
Gurunathan S, Han JW, Eppakayala V, Kim JH. Green synthesis of graphene and its cytotoxic effects in human breast cancer cells. Int J Nanomedicine. 2013;8:1015–1027. | ||
Fernandez-Merino MJ, Guardia L, Paredes JI, et al. Vitamin C Is an ideal substitute for hydrazine in the reduction of graphene oxide suspensions. J Phys Chem C. 2010;114(14):6426–6432. | ||
Gao J, Liu F, Liu YL, Ma N, Wang ZQ, Zhang X. Environment-friendly method to produce graphene that employs vitamin c and amino acid. Chem Mater. 2010;22(7):2213–2218. | ||
Zhu CZ, Guo SJ, Fang YX, Dong S. Reducing sugar: new functional molecules for the green synthesis of graphene nanosheets. ACS Nano. 2010;4(4):2429–2437. | ||
Akhavan O, Ghaderi E, Aghayee S, Fereydooni Y, Talebi A. The use of a glucose-reduced graphene oxide suspension for photothermal cancer therapy. J Mater Chem. 2012;22(27):13773–13781. | ||
Liu JB, Fu SH, Yuan B, Li YL, Deng ZX. Toward a universal “adhesive nanosheet” for the assembly of multiple nanoparticles based on a protein-induced reduction/decoration of graphene oxide. J Am Chem Soc. 2010;132(21):7279. | ||
Esfandiar A, Akhavan O, Irajizad A. Melatonin as a powerful bio-antioxidant for reduction of graphene oxide. J Mater Chem. 2011;21(29):10907–10914. | ||
Deepak V, Umamaheshwaran PS, Guhan K, et al. Synthesis of gold and silver nanoparticles using purified URAK. Colloids Surf B Biointerfaces. 2011;86(2):353–358. | ||
Vallhov H, Qin J, Johansson SM, et al. The importance of an endotoxin-free environment during the production of nanoparticles used in medical applications. Nano Lett. 2006;6(8):1682–1686. | ||
Yang K, Zhang SA, Zhang GX, Sun XM, Lee ST, Liu ZA. Graphene in mice: ultrahigh in vivo tumor uptake and efficient photothermal therapy. Nano Lett. 2010;10(9):3318–3323. | ||
Markovic ZM, Harhaji-Trajkovic LM, Todorovic-Markovic BM, et al. In vitro comparison of the photothermal anticancer activity of graphene nanoparticles and carbon nanotubes. Biomaterials. 2011;32(4): 1121–1129. | ||
Kam NWS, O’Connell M, Wisdom JA, Dai HJ. Carbon nanotubes as multifunctional biological transporters and near-infrared agents for selective cancer cell destruction. Proc Natl Acad Sci U S A. 2005;102(33):11600–11605. | ||
Zhang W, Guo ZY, Huang DQ, Liu ZM, Guo X, Zhong HQ. Synergistic effect of chemo-photothermal therapy using PEGylated graphene oxide. Biomaterials. 2011;32(33):8555–8561. | ||
Jemal A, Thomas A, Murray T, Thun M. Cancer statistics, 2002. CA Cancer J Clin. 2002;52(1):23–47. | ||
Opipari AW, Tan LJ, Boitano AE, Sorenson DR, Aurora A, Liu JR. Resveratrol-induced autophagocytosis in ovarian cancer cells. Cancer Res. 2004;64(2):696–703. | ||
Kalil NGN, McGuire WP. Chemotherapy for advanced epithelial ovarian carcinoma. Best Pract Res Clin Obstet Gynaecol. 2002;16(4):553. | ||
Gusman J, Malonne H, Atassi G. A reappraisal of the potential chemopreventive and chemotherapeutic properties of resveratrol. Carcinogenesis. 2001;22(8):1111–1117. | ||
Pervaiz S, Holme AL. Resveratrol: its biologic targets and functional activity. Antioxid Redox Signal. 2009;11(11):2851–2897. | ||
Bhat KPL, Pezzuto JM. Cancer chemopreventive activity of resveratrol. Ann N Y Acad Sci. 2002;957:210–229. | ||
Mgbonyebi OP, Russo J, Russo IH. Antiproliferative effect of synthetic resveratrol on human breast epithelial cells. Int J Oncol. 1998;12(4):865–869. | ||
Ragione FD, Cucciolla V, Borriello A, et al. Resveratrol arrests the cell division cycle at S/G2 phase transition. Biochem Biophys Res Commun. 1998;250(1):53–58. | ||
Hsieh TC, Juan G, Darzynkiewicz Z, Wu JM. Resveratrol increases nitric oxide synthase, induces accumulation of p53 and p21(WAF1/CIP1), and suppresses cultured bovine pulmonary artery endothelial cell proliferation by perturbing progression through S and G2. Cancer Res. 1999;59(11):2596–2601. | ||
Svajger U, Jeras M. Anti-inflammatory effects of resveratrol and its potential use in therapy of Immune-mediated diseases. Int Rev Immunol. 2012;31(3):202–222. | ||
Hummers WS, Offeman RE. Preparation of graphitic oxide. J Am Chem Soc. 1958;80:1339. | ||
Gurunathan S, Han JW, Eppakayala V, Jeyaraj M, Kim JH. Cytotoxicity of biologically synthesized silver nanoparticles in MDA-MB-231 human breast cancer cells. Biomed Res Int. 2013:535796. | ||
Gurunathan S, Han JW, Park JH, Eppakayala V, Kim JH. Ginkgo biloba: a natural reducing agent for the synthesis of cytocompatible graphene. Int J Nanomedicine. 2014;9:363–377. | ||
Eda G, Lin YY, Mattevi C, et al. Blue photoluminescence from chemically derived graphene oxide. Adv Mater. 2010;22(4):505. | ||
Ding SJ, Chen JS, Luan DY, Boey FYC, Madhavi S, Lou XW. Graphene-supported anatase TiO2 nanosheets for fast lithium storage. Chem Commun. 2011;47(20):5780–5782. | ||
Mhamane D, Ramadan W, Fawzy M, et al. From graphite oxide to highly water dispersible functionalized graphene by single step plant extract-induced deoxygenation. Green Chem. 2011;13(8):1990–1996. | ||
Zhang JL, Yang HJ, Shen GX, Cheng P, Zhang JY, Guo SW. Reduction of graphene oxide via L-ascorbic acid. Chem Commun. 2010;46(7):1112–1114. | ||
Chen DZ, Li LD, Guo L. An environment-friendly preparation of reduced graphene oxide nanosheets via amino acid. Nanotechnology. 2011;22(32):325601. | ||
Gurunathan S, Han JW, Kim E, Kwon DN, Park JK, Kim JH. Enhanced green fluorescent protein-mediated synthesis of biocompatible graphene. J Nanobiotechnology. 2014;12:41. | ||
Lammel T, Boisseaux P, Fernandez-Cruz ML, Navas JM. Internalization and cytotoxicity of graphene oxide and carboxyl graphene nanoplatelets in the human hepatocellular carcinoma cell line Hep G2. Part Fibre Toxicol. 2013;10:27. | ||
Wang Y, Zhang P, Liu CF, Zhan L, Li YF, Huang CZ. Green and easy synthesis of biocompatible graphene for use as an anticoagulant. RSC Adv. 2012;2(6):2322–2328. | ||
Liu S, Zeng TH, Hofmann M, et al. Antibacterial activity of graphite, graphite oxide, graphene oxide, and reduced graphene oxide: membrane and oxidative stress. ACS Nano. 2011;5(9):6971–6980. | ||
Jeong HK, Lee YP, Lahaye RJ, et al. Evidence of graphitic AB stacking order of graphite oxides. J Am Chem Soc. 2008;130(4):1362–1366. | ||
Lian PC, Zhu XF, Liang SZ, Li Z, Yang WS, Wang HH. Large reversible capacity of high quality graphene sheets as an anode material for lithium-ion batteries. Electrochim Acta. 2010;55(12):3909–3914. | ||
He HK, Gao C. Supraparamagnetic, conductive, and processable multifunctional graphene nanosheets coated with high-density Fe3O4 nanoparticles. ACS Appl Mater Interfaces. 2010;2(11):3201–3210. | ||
Ferrari AC, Robertson J. Resonant Raman spectroscopy of disordered, amorphous, and diamondlike carbon. Phys Rev B. 2001;64(7):075414. | ||
Wang GX, Yang J, Park J, et al. Facile synthesis and characterization of graphene nanosheets. J Phys Chem C. 2008;112(22):8192–8195. | ||
Guo YQ, Sun XY, Liu Y, Wang W, Qiu HX, Gao JP. One pot preparation of reduced graphene oxide (RGO) or Au (Ag) nanoparticle-RGO hybrids using chitosan as a reducing and stabilizing agent and their use in methanol electrooxidation. Carbon N Y. 2012;50(7):2513–2523. | ||
Gurunathan S, Han JW, Eppakayala V, Dayem AA, Kwon DN, Kim JH. Biocompatibility effects of biologically synthesized graphene in primary mouse embryonic fibroblast cells. Nanoscale Res Lett. 2013;8(1):393. | ||
Hu XZ, Xu Z, Gao C. Multifunctional, supramolecular, continuous artificial nacre fibres. Sci Rep. 2012;2:767. | ||
Xu Z, Gao C. Graphene chiral liquid crystals and macroscopic assembled fibres. Nat Commun. 2011;2:571. | ||
Su CY, Xu YP, Zhang WJ, et al. Electrical and spectroscopic characterizations of ultra-large reduced graphene oxide monolayers. Chem Mater. 2009;21(23):5674–5680. | ||
Liu Y, Luo Y, Wu J, et al. Graphene oxide can induce in vitro and in vivo mutagenesis. Sci Rep. 2013;3:3469. | ||
Li Y, Liu Y, Fu Y, et al. The triggering of apoptosis in macrophages by pristine graphene through the MAPK and TGF-beta signaling pathways. Biomaterials. 2012;33(2):402–411. | ||
Zhang Y, Ali SF, Dervishi E, et al. Cytotoxicity effects of graphene and single-wall carbon nanotubes in neural phaeochromocytoma-derived PC12 cells. ACS Nano. 2010;4(6):3181–3186. | ||
Akhavan O, Ghaderi E, Akhavan A. Size-dependent genotoxicity of graphene nanoplatelets in human stem cells. Biomaterials. 2012;33(32):8017–8025. | ||
Akhavan O, Ghaderi E, Emamy H, Akhavan F. Genotoxicity of graphene nanoribbons in human mesenchymal stem cells. Carbon N Y. 2013;54:419–431. | ||
Jaworski S, Sawosz E, Grodzik M, et al. In vitro evaluation of the effects of graphene platelets on glioblastoma multiforme cells. Int J Nanomedicine. 2013;8:413–420. | ||
Wang K, Ruan J, Song H, et al. Biocompatibility of graphene oxide. Nanoscale Res Lett. 2011;6(1):8. | ||
Wang A, Pu K, Dong B, et al. Role of surface charge and oxidative stress in cytotoxicity and genotoxicity of graphene oxide towards human lung fibroblast cells. J Appl Toxicol. 2013;33(10):1156–1164. | ||
Sayes CM, Liang F, Hudson JL, et al. Functionalization density dependence of single-walled carbon nanotubes cytotoxicity in vitro. Toxicol Lett. 2006;161(2):135–142. | ||
Clutton S. The importance of oxidative stress in apoptosis. Br Med Bull. 1997;53(3):662–668. | ||
Knaapen AM, Borm PJA, Albrecht C, Schins RPF. Inhaled particles and lung cancer. Part A: Mechanisms. Int J Cancer. 2004;109(6):799–809. | ||
Reddy ARN, Reddy YN, Krishna DR, Himabindu V. Multi wall carbon nanotubes induce oxidative stress and cytotoxicity in human embryonic kidney (HEK293) cells. Toxicology. 2010;272(1–3):11–16. | ||
Wu QL, Zhao YL, Li YP, Wang DY. Molecular signals regulating translocation and toxicity of graphene oxide in the nematode Caenorhabditis elegans. Nanoscale. 2014;6(19):11204–11212. | ||
Shen JF, Hu YH, Li C, Qin C, Ye MX. Synthesis of amphiphilic graphene nanoplatelets. Small. 2009;5(1):82–85. | ||
Thevenot P, Cho J, Wavhal D, Timmons RB, Tang LP. Surface chemistry influences cancer killing effect of TiO2 nanoparticles. Nanomedicine. 2008;4(3):226–236. | ||
Nhan TQ, Liles WC, Schwartz SM. Physiological functions of caspases beyond cell death. Am J Pathol. 2006;169(3):729–737. | ||
Ghavami S, Hashemi M, Ande SR, et al. Apoptosis and cancer: mutations within caspase genes. J Med Genet. 2009;46(8):497–510. | ||
Salvesen GS. Caspases and apoptosis. Essays Biochem. 2002;38:9–19. | ||
Xing Y, Xiong W, Zhu L, Osawa E, Hussin S, Dai LM. DNA damage in embryonic stem cells caused by nanodiamonds. ACS Nano. 2011;5(3):2376–2384. | ||
Zhu L, Chang DW, Dai LM, Hong YL. DNA damage induced by multiwalled carbon nanotubes in mouse embryonic stem cells. Nano Lett. 2007;7(12):3592–3597. | ||
Nicholson DW, Ali A, Thornberry NA, et al. Identification and inhibition of the ICE/CED-3 protease necessary for mammalian apoptosis. Nature. 1995;376(6535):37–43. | ||
Zhang G, Chang HC, Amatore C, Chen Y, Jiang H, Wang XM. Apoptosis induction and inhibition of drug resistant tumor growth in vivo involving daunorubicin-loaded graphene-gold composites. J Mater Chem B. 2013;1(4):493–499. | ||
Gotoh Y, Hiraiwa K, Nagayama M. In vitro mineralization of osteoblastic cells derived from human bone. Bone Miner. 1990;8(3):239–250. | ||
Strait KA, Dabbas B, Hammond EH, Warnick CT, Iistrup SJ, Ford CD. Cell cycle blockade and differentiation of ovarian cancer cells by the histone deacetylase inhibitor trichostatin a are associated with changes in p21, Rb, and Id proteins. Mol Cancer Ther. 2002;1(13):1181–1190. | ||
Kalbacova M, Broz A, Kong J, Kalbac M. Graphene substrates promote adherence of human osteoblasts and mesenchymal stromal cells. Carbon N Y. 2010;48(15):4323–4329. | ||
Li M, Wang YB, Liu Q, et al. In situ synthesis and biocompatibility of nano hydroxyapatite on pristine and chitosan functionalized graphene oxide. J Mater Chem B. 2013;1(4):475–484. | ||
Liu Y, Huang J, Li H. Synthesis of hydroxyapatite-reduced graphite oxide nanocomposites for biomedical applications: oriented nucleation and epitaxial growth of hydroxyapatite. J Mater Chem B. 2013;1(13):1826–1834. | ||
Zhang X, Li M, Wang YB, et al. Cell response of nanographene platelets to human osteoblast-like MG63 cells. J Biomed Mater Res A. 2014;102(3):732–742. |
 © 2015 The Author(s). This work is published and licensed by Dove Medical Press Limited. The
full terms of this license are available at https://www.dovepress.com/terms.php
and incorporate the Creative Commons Attribution
- Non Commercial (unported, v3.0) License.
By accessing the work you hereby accept the Terms. Non-commercial uses of the work are permitted
without any further permission from Dove Medical Press Limited, provided the work is properly
attributed. For permission for commercial use of this work, please see paragraphs 4.2 and 5 of our Terms.
© 2015 The Author(s). This work is published and licensed by Dove Medical Press Limited. The
full terms of this license are available at https://www.dovepress.com/terms.php
and incorporate the Creative Commons Attribution
- Non Commercial (unported, v3.0) License.
By accessing the work you hereby accept the Terms. Non-commercial uses of the work are permitted
without any further permission from Dove Medical Press Limited, provided the work is properly
attributed. For permission for commercial use of this work, please see paragraphs 4.2 and 5 of our Terms.