Back to Journals » Journal of Inflammation Research » Volume 19
Reduced C3 Levels Link Dyslipidemia and Renal Involvement in Systemic Lupus Erythematosus
Authors Cheng S ![]() , Jiang Y, Hu Z, Guo X, Lai Q, Fan C, Zhang S
, Jiang Y, Hu Z, Guo X, Lai Q, Fan C, Zhang S ![]() , Yuan B, Wei Y
, Yuan B, Wei Y ![]() , Wang M
, Wang M
Received 24 November 2025
Accepted for publication 14 March 2026
Published 25 May 2026 Volume 2026:19 572649
DOI https://doi.org/10.2147/JIR.S572649
Checked for plagiarism Yes
Review by Single anonymous peer review
Peer reviewer comments 4
Editor who approved publication: Dr Adrian Lee
Shuo Cheng,1,2 Yi Jiang,1 Zhanheng Hu,1,2 Xue Guo,1,2 Qin Lai,3 Cuiling Fan,1 Suo Zhang,1 Bing Yuan,3 Yushuang Wei,3 Meiying Wang1,2
1Department of Rheumatology and Immunology, The First Affiliated Hospital of Shenzhen University, Shenzhen University, Shenzhen, People’s Republic of China; 2Shenzhen Medical School, Shenzhen University, Shenzhen, People’s Republic of China; 3Songshan Lake Materials Laboratory, Dongguan, People’s Republic of China
Correspondence: Meiying Wang, Email [email protected]
Background: Dyslipidemia is more frequently observed in systemic lupus erythematosus (SLE) patients with hypocomplementemia, suggesting potential connections between immune dysregulation and lipid metabolism. This study aims to explore the association between complement components and lipid profiles, and investigate the influence in organ involvement among SLE patients.
Methods: A total of 935 patients diagnosed with SLE were enrolled and stratified based on their baseline lipid profiles. Logistic regression, stratified analyses and ROC curves analyses were employed to evaluate the predictive value of complements with other factors for dyslipidemia and organ involvement.
Results: Among the 935 enrolled SLE patients, 527 (56.4%) were diagnosed with dyslipidemia. Patients in the dyslipidemia group exhibited higher erythrocyte sedimentation rate (ESR), C-reactive protein (CRP), and lower complement 3 (C3) levels compared to those without dyslipidemia. Lower C3 levels were independently associated with an increased risk of dyslipidemia (OR = 0.29, 95% CI: 0.18– 0.47, P < 0.0001) and renal involvement (OR = 0.21, 95% CI: 0.12– 0.37, P < 0.0001). This association of dyslipidemia were further strengthened in patients with C3 ≤ 0.7 g/L (OR = 0.08, 95% CI: 0.01– 0.48, P = 0.0061). In addition, a predictive model for dyslipidemia risk among SLE patients was developed. Using criteria of C3 (≤ 0.68 g/L) and ESR (≥ 33.65 mm/h), the model achieved 64.1% sensitivity, 74.7% specificity, and an AUC of 0.71 for dyslipidemia prediction.
Conclusion: Reduced C3 levels serve as a significant independent risk factor for dyslipidemia and renal involvement. Furthermore, the combination of C3 and ESR enhances the identification of dyslipidemia.
Keywords: dyslipidemia, systemic lupus erythematosus, complement C3, immune dysregulation, lipid metabolism
Introduction
Systemic lupus erythematosus (SLE) is a complex, chronic autoimmune disease characterized by autoantibody production and immune complex deposition.1 Clinically, patients with SLE frequently exhibit a special pattern of dyslipidemia.2 Furthermore, this dyslipidemia typically accompanied disease flares and contribute to an elevated risk of cardiovascular disease (CVD) in SLE patients, potentially leading to mortality in severe cases.3,4
Some traditional inflammatory markers, such as ESR and CRP, are susceptible to influences from external factors like infections and pregnancy, resulting in decreased specificity. Recent studies indicate that the complement system plays a central role in the pathogenesis of SLE.5 During the active phase of SLE, the complement system is activated by immune complexes, resulting in complement consumption. Low serum C3 levels are well-established indicators of SLE activity.6–8 Importantly, chronic immune system activation in SLE patients may partially contribute to the development of CVD.9 Although dyslipidemia is highly prevalent among individuals with SLE, indicating that it may play a critical role in CVD progression.10–12 Persistent dyslipidemia in systemic lupus erythematosus represents a critical driver of accelerated atherosclerosis and is robustly associated with substantially elevated long-term risks of myocardial infarction, stroke, and cardiovascular mortality.13 Complement activation may directly influence lipid metabolism through several interconnected mechanisms. The central component C3 is cleaved into C3a-desArg, which regulates triglyceride synthesis and lipid storage in adipose tissue.14 In addition, complement activation products promote macrophage uptake of oxidized LDL and induce endothelial dysfunction via sublytic membrane attack complex deposition, Furthermore, complement system disruption, particularly reduced C3, is independently linked to impaired HDL cholesterol efflux capacity.15 These mechanisms collectively link immune activation to dyslipidemia and accelerated atherogenesis.16 However, assessing this “complement-lipid axis” clinically is complicated by treatments: HCQ improves lipid profiles and reduces organ damage,17 while long-term corticosteroids worsen dyslipidemia and accelerate atherosclerosis.18
The contribution of complement, particularly C3, to dyslipidemia has not yet been investigated. Given that SLE-related factors such as C3 may influence CVD pathogenesis,19 clarifying whether C3 can serve as a biomarker for predicting dyslipidemia in SLE patients is of particular importance.
Materials and Methods
Study Design and Participants
This study was designed as a cross-sectional analysis of baseline data derived from a prospectively maintained observational cohort established in 2004 at The First Affiliated Hospital, Shenzhen University, Shenzhen, China. This cross-sectional study included a total of 935 patients. Participants were stratified based on baseline lipid profiles into 2 groups: Non-Dyslipidemia (N=408) Dyslipidemia (N=527). Baseline demographic, clinical, and laboratory data were collected and compared across 2 groups.
In the current study, baseline information including clinical characteristics, biomarkers, and medications was used for analysis. Patients complicated with the following diseases were excluded: (i) missing lipid profile data; (ii) presence of malignant tumors; (iii) acute infections, such as tuberculosis or/and hepatitis. The baseline data of patients enrolled from Jan 2004 to Jan 2024 was extracted as the dataset. The investigation protocol was conformed with the Helsinki Declaration and approved by the Ethics Committee of The First Affiliated Hospital, Shenzhen University.
Data Collection
Data were extracted from medical records, including demographics and clinical manifestations such as age, sex, smoking and alcohol history, as well as the presence or absence of fever, facial erythema, Raynaud phenomenon, oral ulcers, hair loss, joint pain, limb muscle weakness, edema, and psychiatric abnormalities. Comorbidities and signs included hypertension, diabetes mellitus, coronary heart disease, history of tumor, and qualitative urine protein (graded 0–4+ by dipstick). Laboratory parameters comprised white blood cell count (WBC), hemoglobin (Hb), platelet count (PLT), erythrocyte sedimentation rate (ESR), serum uric acid (UA), serum creatinine (Cr), and SLE Disease Activity Index (SLEDAI). Autoantibodies assessed were anti-Smith (Sm), anti-SSA, anti-SSB, and anti–double-stranded DNA (ds-DNA), evaluated by standard ELISA or immunofluorescence assays. Complement and immunoglobulins measured included serum C3, C4, IgG, IgA, and IgM using nephelometry. Inflammatory markers consisted of C-reactive protein (CRP) determined by immunoturbidimetry. Medication history documented the use of hydroxychloroquine (HCQ), methotrexate, azathioprine, leflunomide, mycophenolate mofetil, and systemic corticosteroids.
Definition
Dyslipidemia is characterized by abnormal blood lipid levels, defined by: 1. Total Cholesterol (TC): ≥ 200 mg/dL (≥ 5.18 mmol/L) 2. Low-Density Lipoprotein Cholesterol (LDL-C): ≥ 130 mg/dL (≥ 3.37 mmol/L) 3. Triglycerides (TG): ≥ 150 mg/dL (≥ 1.70 mmol/L) 4. High-Density Lipoprotein Cholesterol (HDL-C): < 50 mg/dL (< 1.29 mmol/L). Diagnosis is based on fasting lipid profile testing per AHA guidelines.20
The study included patients diagnosed with Systemic Lupus Erythematosus (SLE). All enrolled patients fulfilled the 1997 revised classification criteria of the American College of Rheumatology (ACR) for SLE.21 Renal involvement was defined as the presence of any of the following clinical laboratory findings: (1) positive urine protein, (2) positive urine occult blood, or (3) persistent 24-hour proteinuria > 0.5 g.
Statistical Analysis
All statistical procedures were conducted using R (version 4.5.1) and GraphPad Prism 10.1.2. Continuous variables are presented as mean ± standard deviation, whereas categorical variables are summarized as counts and corresponding proportions. Group differences were examined with Student’s t-tests for continuous measures, while chi-square or Fisher’s exact tests were applied for categorical data, depending on suitability.
To explore potential determinants of dyslipidemia, univariate logistic regression analyses were carried out initially. Variables that met the threshold of P < 0.05 or were deemed clinically important were subsequently entered into multivariable logistic regression models. Three models were generated: an unadjusted model; Model I, which accounted for sex, age, fever, edema, hemoglobin, CRP, and ESR; and Model II, which additionally incorporated ds-DNA, IgG, urine protein qualitative results, uric acid, and hydroxychloroquine usage.
An independent multivariable model was also constructed to assess the relationship between complement C3 and both dyslipidemia and renal involvement, adjusting for age, sex, fever, edema, hemoglobin, CRP, ESR, ds-DNA, and IgG. Pearson correlation tests were performed to examine associations between lipid parameters and selected clinical or laboratory indicators.
Stratified analyses were used to further evaluate potential effect modification on the association between C3 and dyslipidemia. Receiver operating characteristic (ROC) curves were generated to assess the predictive utility of C3 for identifying dyslipidemia. The area under the curve (AUC) and its 95% confidence interval were reported, and the optimal threshold value was determined using the Youden index. All effect estimates were expressed as odds ratios (ORs) with 95% confidence intervals. For other included covariates, the missing data rate was minimal (< 5%), and these missing values were handled via multiple imputation. A two-tailed P-value of < 0.05 was regarded as statistically significant.
Result
Comparisons of Disease Characteristics Between Non-Dyslipidemia and Dyslipidemia Patients
As shown in Table 1, patients with dyslipidemia, compared to those without, were more likely to be male (12.33% vs. 6.37%, P = 0.002) and had higher rates of fever (31.31% vs. 18.14%, P < 0.001), Raynaud’s phenomenon (9.30% vs. 5.15%, P = 0.017), and edema (29.98% vs. 11.27%, P < 0.001). Additionally, they had lower hemoglobin levels (107.48 ± 23.52 vs. 115.71 ± 18.21 g/L, P < 0.001), higher ESR values (46.59 ± 33.70 vs. 26.11 ± 25.63 mm/h, P < 0.001), elevated uric acid levels (362.00 ± 118.94 vs. 302.06 ± 85.82 μmol/L, P < 0.001), and higher SLEDAI scores (10.82 ± 6.77 vs. 7.48 ± 4.95, P < 0.001). IgG levels were higher in the dyslipidemia group (15.48 ± 7.81 vs. 14.23 ± 6.10 g/L; P = 0.008), indicating augmented humoral immune activation.
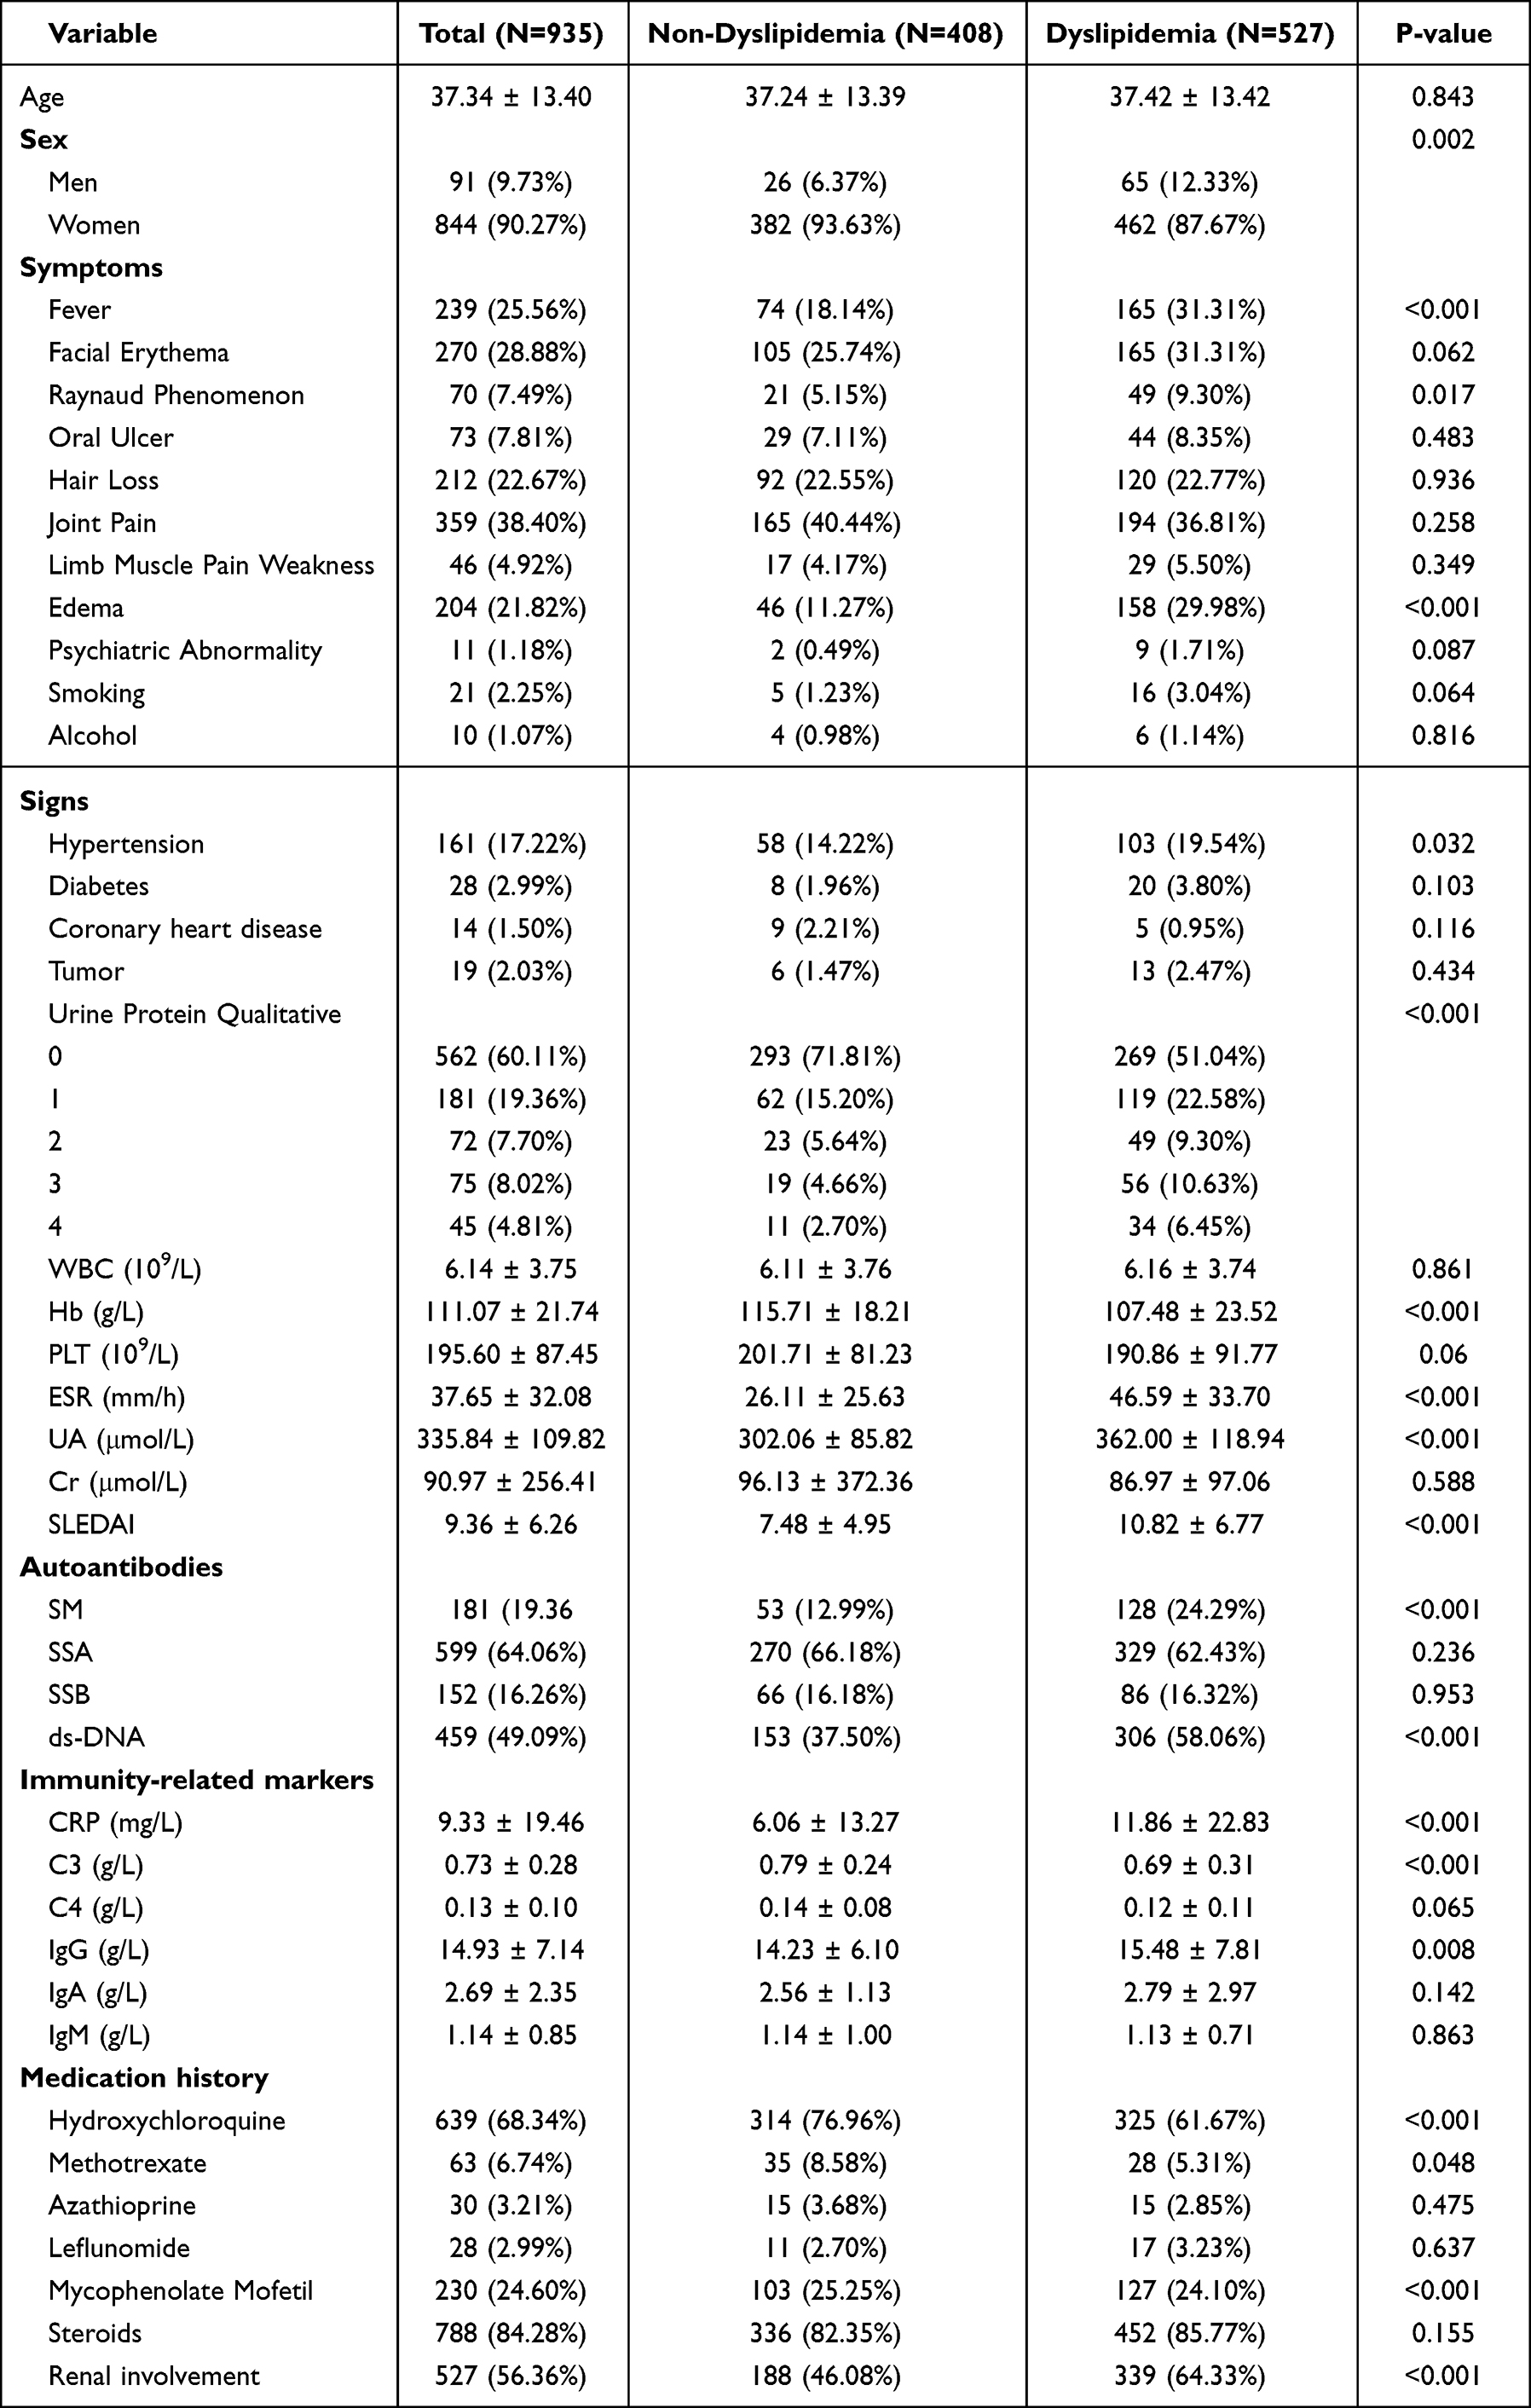 |
Table 1 The Baseline Characteristics of SLE Patients in Relation to Dyslipidemia Status |
Furthermore, patients in the dyslipidemia group patients had higher positivity rates for SM (24.29% vs. 12.99%, P < 0.001) and ds-DNA (58.06% vs. 37.50%, P < 0.001), lower C3 levels (0.69 ± 0.31 vs. 0.79 ± 0.24 g/L, P < 0.001), and higher CRP (11.86 ± 22.83 vs. 6.06 ± 13.27 mg/L, P < 0.001). They were less likely to use HCQ (61.67% vs. 76.96%, P < 0.001), and had a higher prevalence of renal involvement was more prevalent (64.33% vs. 46.08%, P < 0.001).
The Relationships Between Complements and Other Biomarkers with Dyslipidemia
Univariate logistic regression analysis in Table 2 demonstrated that lower C3 levels were strongly associated with an increased risk of dyslipidemia (OR = 0.29, 95% CI: 0.18–0.47, P < 0.0001). This association persisted in multivariable models after adjusting for potential confounders. In Model I, which accounted for sex, age, fever, edema, CRP, ESR, and Hb, the OR for C3 was 0.34 (95% CI: 0.19–0.60, P = 0.0002). In Model II, which further adjusted for additional factors including ds-DNA, IgG, qualitative urine protein, uric acid, and hydroxychloroquine use, the OR for C3 became 0.50 (95% CI: 0.26–0.95, P = 0.0332).
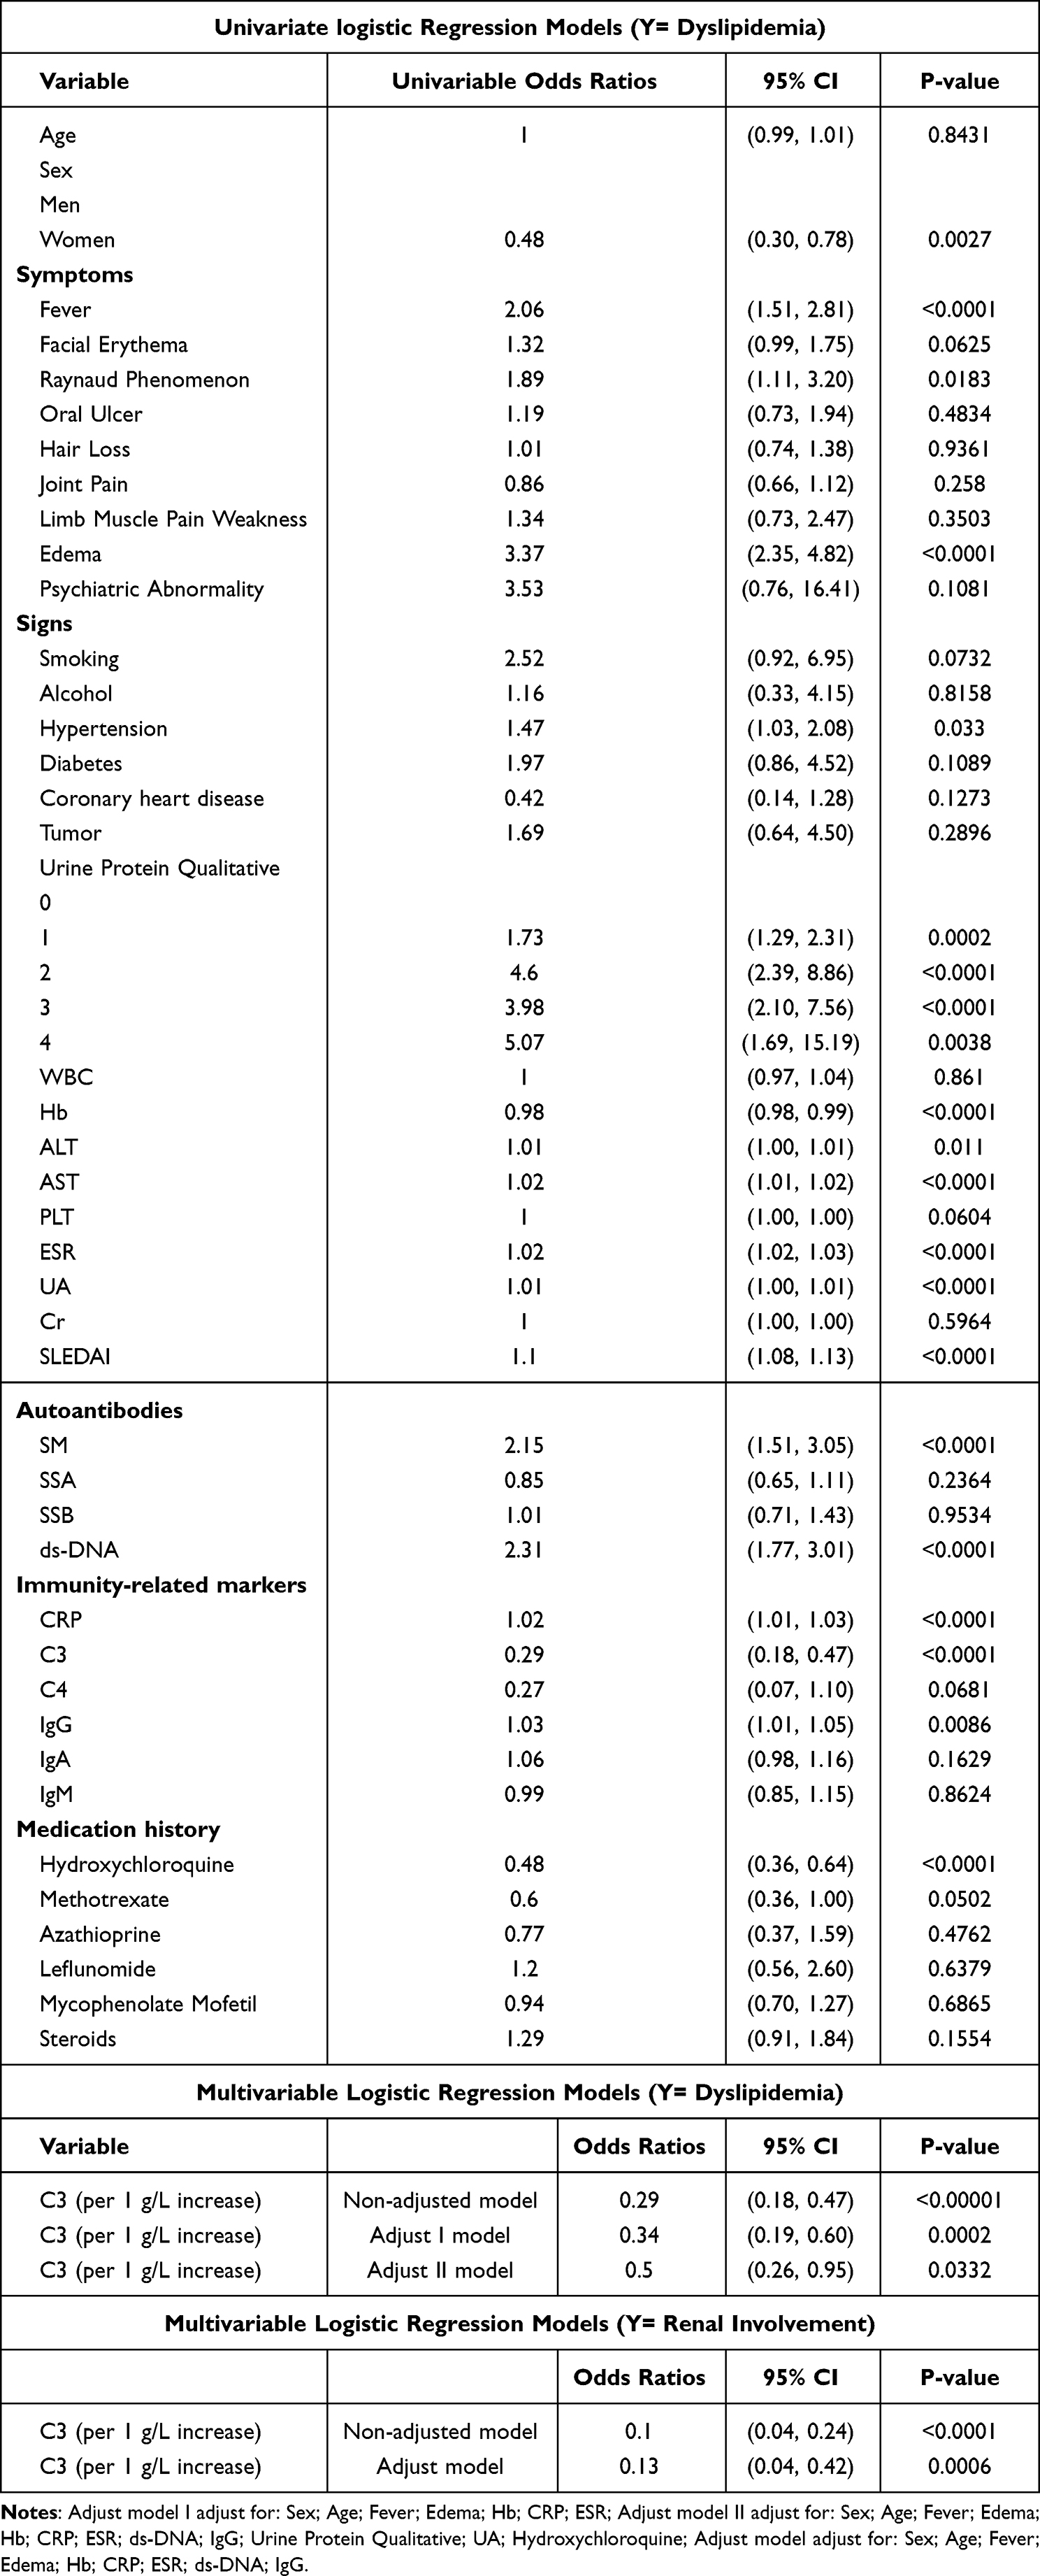 |
Table 2 Univariate and Multivariable Logistic Regression Models Between Various Factors and Dyslipidemia |
These findings indicate that lower serum C3 levels are strongly and independently associated with dyslipidemia among SLE patients, even after controlling for inflammatory markers and disease activity, suggesting that C3 may serve as a potential biomarker or mechanistic link in lupus-related lipid metabolism disturbances.
Smooth curve fitting revealed a non-linear negative association between C3 levels and the probability of dyslipidemia in patients with SLE (Figure 1A). Patients with lower C3 levels exhibited a markedly higher risk of dyslipidemia, indicating a potential link between hypocomplementemia and abnormal lipid metabolism. Violin plots further demonstrated that C3 levels were significantly reduced in patients with dyslipidemia compared with those without (P < 0.0001), and similarly, patients with renal involvement had significantly lower C3 levels than non-LN patients (P < 0.0001) (Figure 1B), suggesting that complement depletion is associated with both disease activity and organ involvement.
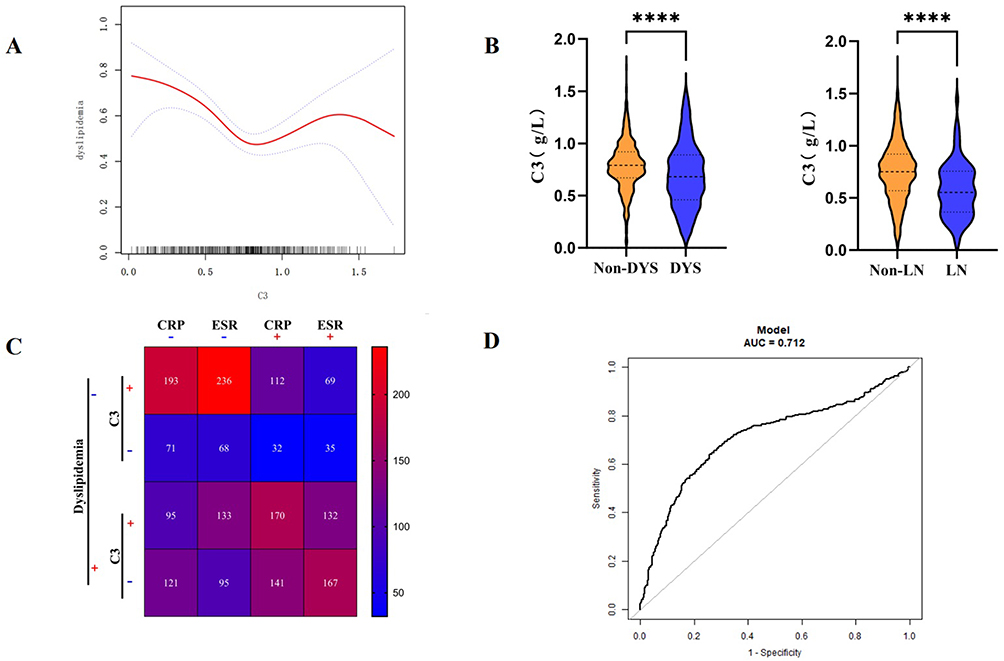 |
Figure 1 The value of C3 in identifying Dyslipidemia and Organ Involvement. (A) Smooth curve fitting C3 for dyslipidemia. (B) The distribution of C3 in different patients. (C) The summary of C3, CRP, ESR, and dyslipidemia in different subgroups based on the cut-off value. “+” (high) and “-” (low) denote values above or below optimal thresholds determined by smooth curve fitting. (D) The ROC curve of C3 to distinguish dyslipidemia. |
Heatmap analysis integrating C3 (high/low), CRP (positive/negative), and ESR (high/low) status revealed that patients with low C3 combined with elevated CRP or ESR had the highest prevalence of dyslipidemia (Figure 1C). The cutoff values were determined based on the cutoff points from the ROC curves (Figure 1D), supporting the hypothesis of a synergistic effect between inflammatory activity and complement consumption on lipid abnormalities.
Cluster and Stratified Analysis of Associations Between Various Factors and Dyslipidemia
Stratified analyses in Table 3 revealed that the association between lower C3 levels and dyslipidemia was particularly pronounced in specific subgroups.
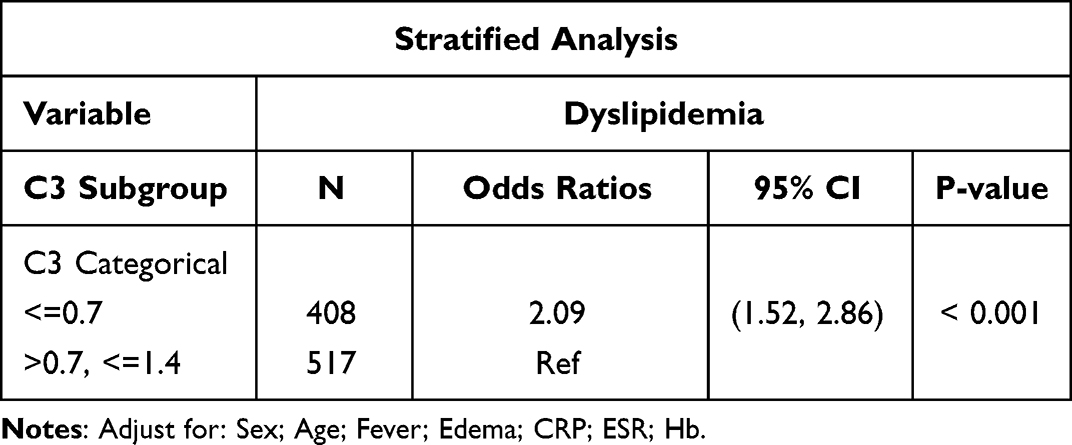 |
Table 3 Stratified Analysis of Associations Between Various Factors and Dyslipidemia |
The stratified analysis examining the associations between various factors and dyslipidemia is presented in Table 3. The analysis was adjusted for sex, age, fever, edema, CRP, ESR and Hb. In the C3 categorical subgroup analysis, significant associations were observed for specific C3 levels. For C3 levels ≤ 0.7, the odds ratio (OR) for dyslipidemia was 0.08 (95% CI: 0.01–0.48, P = 0.0061), indicating a strong and significant inverse association. However, for C3 levels between > 0.7 and ≤ 1.4, the OR was 1.62 (95% CI: 0.39–6.81, P = 0.5069), suggesting no significant association with dyslipidemia.
To explore the multidimensional relationships between clinical variables and dyslipidemia status, we applied unsupervised clustering and PCA. The elbow method identified k = 2 as the optimal number of clusters (Figure 2A), corresponding to patients with normal lipid profiles and those with dyslipidemia. K-means clustering with k = 2 achieved clear separation between these two groups (Figure 2B), showing high concordance with the clinical diagnosis.
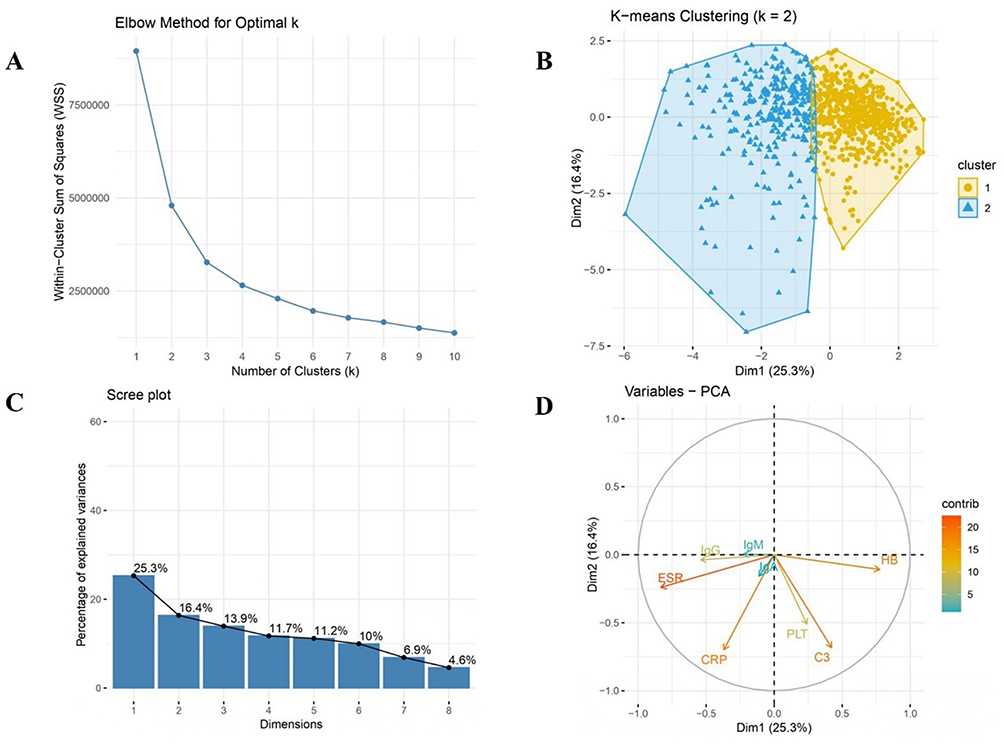 |
Figure 2 Elbow Method, K-means Clustering, and PCA Analysis of Dyslipidemia in SLE Patients. (A) Elbow plot: WSS shows an elbow at k=2, indicating optimal clustering into normal and dyslipidemia groups. (B) K-means (k=2): Scatter plot clusters, convex hulls show distribution. (C) Scree plot: Dim1 (25.3%) and Dim2 (16.4%) explain 41.7% of variance. (D) Variables-PCA: CRP and HB contribute >15% to Dim1 and Dim2, linking inflammation to lipid metabolism. |
PCA results indicated that the first two principal components (PC1 25.3%, PC2 16.4%) explained 41.7% of the total variance (Figure 2C). Variable contribution plots showed that CRP and HB contributed more than 15% to both PC1 and PC2, while C3, platelet count (PLT), and ESR also exhibited substantial contributions (Figure 2D). Notably, C3 loaded separately from the inflammatory cluster of CRP and ESR, highlighting its distinct variance profile within the dataset.
Correlation Between Serum Lipid Levels and Clinical Indices
Correlation analyses between serum lipid levels and clinical indices are presented in Table 4. Serum C3 levels were negatively correlated with triglyceride (TG) levels (r = −0.1506, P < 0.0001) and positively correlated with high-density lipoprotein (HDL) levels (r = 0.1846, P < 0.0001). These findings suggest that lower C3 levels are associated with unfavorable lipid profiles, particularly elevated TG and reduced HDL, which are hallmarks of dyslipidemia.
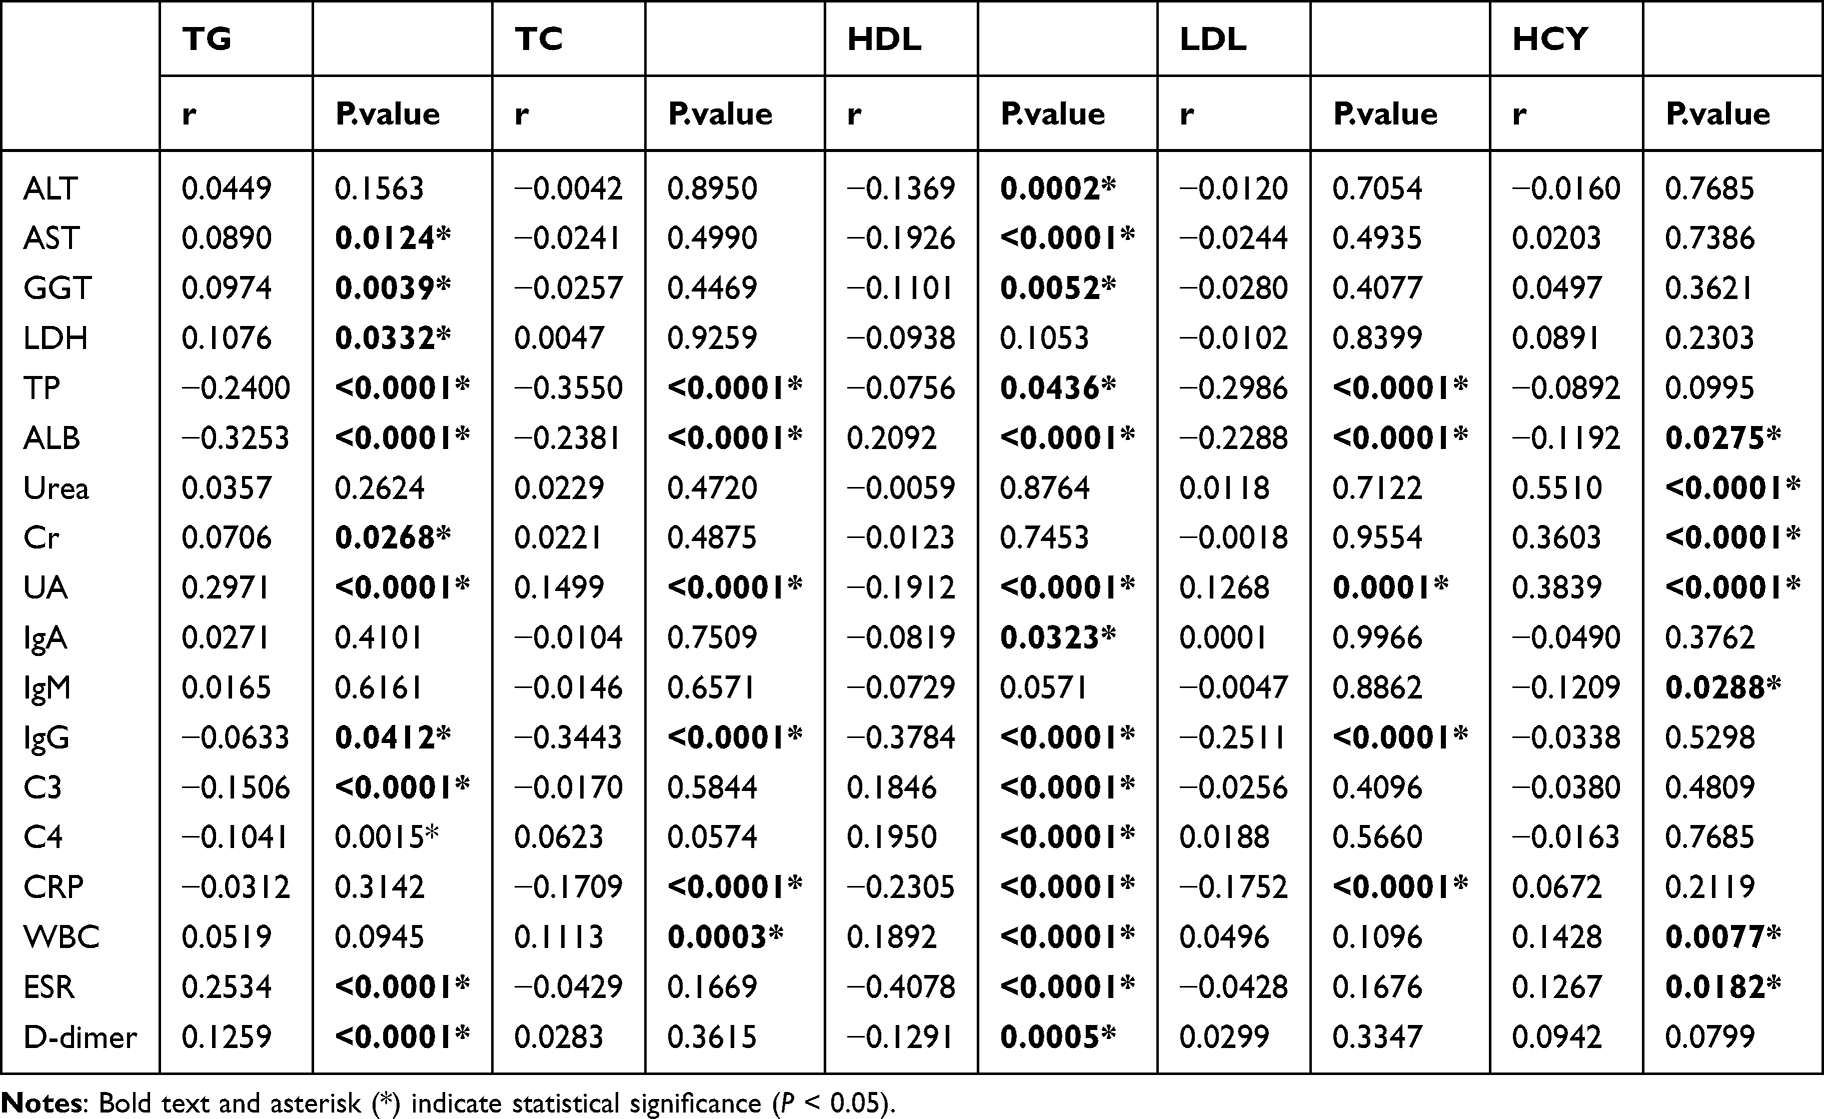 |
Table 4 Correlation Between Serum Lipid Levels and Clinical Index |
The analysis highlights a complex interplay between liver function, inflammation, immune response, and lipid metabolism. Liver enzymes (ALT, AST, GGT) and inflammatory markers (CRP, ESR) showed significant correlations with lipid profiles, particularly affecting TG and HDL levels. Immunological markers, notably C3 and IgG, exhibited strong associations with multiple lipid parameters, suggesting a mechanistic link in dyslipidemia pathogenesis. Renal function markers, especially UA and CysC, also demonstrated significant correlations with lipid and metabolic profiles. These findings provide valuable insights into the multifactorial mechanisms underlying dyslipidemia in this patient cohort, emphasizing the roles of inflammation and immune activation in lipid dysregulation.
The Value of C3 and Other Biomarkers in Identifying Dyslipidemia and Organ Involvement in SLE
In the diagnostic test analysis, the optimal cut-off value for complement C3 in identifying dyslipidemia was 0.68 g/L, with a sensitivity of 51.0%, a specificity of 73.7%, and an area under the curve (AUC) of 0.61 (0.58–0.65). For erythrocyte sedimentation rate (ESR), the cut-off was 33.65 mm/h, with a sensitivity of 56.7%, a specificity of 74.5%, and an AUC of 0.70 (0.67–0.74). In comparison, the cut-off for C-reactive protein (CRP) was 3.16 mg/L, with a sensitivity of 59.0%, a specificity of 64.7%, and an AUC of 0.64 (0.602–0.674).
The diagnostic performance of the combined model incorporating C3 and ESR was evaluated by receiver operating characteristic (ROC) analysis, yielding an area under the curve (AUC) of 0.71 (95% CI: 0.68–0.75), indicating moderate discriminative power. Parallel testing of C3 and ESR improved sensitivity to 64.1% while maintaining specificity at 74.4%. In contrast, serial testing further enhanced specificity, albeit with a corresponding decrease in sensitivity, as suggested by the optimized threshold analysis in (Figure 1D).
Discussion
To our knowledge, this is the first study to investigate the value of complement 3 in assessing dyslipidemia-related disease activity in SLE and to characterize the clinical profiles associated with lipid profile disturbances in these patients. In addition, we aim to construct a clinical prediction model integrating C3 with conventional biomarkers by using ROC curve analysis, thereby clarifying the associations between circulating C3 levels and common clinical complications in SLE patients. Our cohort demonstrated a robust association between dyslipidemia and markers of disease activity, including higher SLEDAI scores, elevated CRP and ESR, and increased renal involvement. These findings align with prior studies reporting an atherogenic lipid profile in SLE patients, particularly during active disease phases.2,22 Moreover, Dyslipidemia in patients with systemic lupus erythematosus is more severe in those with active disease or lupus nephritis. In pediatric SLE, patients with biopsy-proven nephritis exhibit a significantly higher incidence of dyslipidemia at 79.9%, accompanied by markedly reduced complement C3 and C4 levels.23
Clinically, we found that lupus patients often have lipid profile disorders. Our data indicate that low C3 is significantly associated with lipid profile disorders in lupus, demonstrating acceptable specificity as an adjunctive indicator. Its combined diagnosis with classic biomarkers is of great significance.
The risk of lipid profile disturbances has been reported in patients with active lupus.22,24 50–89% of SLE patients have hypocomplementemia at diagnosis, and persistently low C3 is a risk factor for relapse.25,26 Our results extend this understanding by showing that low C3 not only signals inflammation but also identifies patients at risk for lipid derangements. In our models, C3 remained significantly inversely associated with dyslipidemia even after adjusting for CRP, ESR, and other confounders. Thus, monitoring C3 alongside standard markers could provide a dual benefit in managing SLE: guiding immunosuppression and flagging metabolic risk. In fact, EULAR guidelines now recognize “persistent serological activity” (low complement and/or high anti-dsDNA) as a risk factor for adverse outcomes,5 underscoring the need to integrate immunologic and metabolic surveillance in routine care.
Although direct studies on C3 and lipid metabolism are limited in the literature, several reports have demonstrated that dyslipidemia in SLE patients is associated with disease activity.24,27 There is a direct correlation between small HDL and complement (C3/C4/CH50), and complement activation can affect lipid metabolism through inflammation.28 Our study revealed for the first time a significant correlation between C3 levels and parameters such as TG, TC or HDL-C, suggesting that the complement system is involved in the metabolic disorder mechanism of SLE.
Dyslipidemia in SLE arises from the convergence of multiple distinct yet tightly interrelated pathophysiological processes, most notably autoantibody mediated impairment of endothelial lipoprotein lipase activity and the hepatic overproduction of apolipoproteins secondary to renal protein loss.29 Against this backdrop of immune metabolic dysregulation, the complement cascade assumes a central and mechanistically indispensable role.30 Positioned at the obligatory nodal point where the classical, alternative, and lectin pathways intersect, C3 functions not merely as a sentinel marker of systemic immune activation but as a pivotal biological intermediary that couples innate immune dysregulation to downstream metabolic disturbance.31,32 Accordingly, beyond its canonical roles in innate immunity, including pathogen opsonization, anaphylatoxin driven leukocyte recruitment, and membrane attack complex mediated cytolysis,33 complement signaling is now increasingly recognized as a critical regulator of lipid homeostasis, adipose tissue remodeling, and inflammation driven atherogenesis.34
We suggest that tighter control of disease activity and complement normalization help prevent metabolic complications in SLE. Future research should explore whether interventions that modulate complement activation can favorably impact lipid profiles and cardiovascular risk in lupus.
Limitation
We acknowledge that hyperlipidemia can affect immunoturbidimetric C3 measurements. Residual interference from high lipid levels remains a potential limitation. The cross-sectional design precludes causal inference between C3 activation and lipid alterations. Additionally, C3 suggesting its utility as an adjunctive risk indicator rather than a standalone diagnostic tool. These findings should validated in future prospective cohorts.
Conclusion
Our findings position serum complement C3 as a potential biomarker for dyslipidemia in SLE patients. Reduced C3 levels were significantly associated with adverse lipid profiles and organ involvement, independent of traditional inflammatory markers. The combination of C3 and ESR enhanced the identification of patients at metabolic risk. These results suggest that complement monitoring may serve a dual role in assessing both disease activity and cardiometabolic risk, facilitating more tailored disease management in SLE.
Data Sharing Statement
The datasets used and/or analysed during the current study are available from the corresponding author on reasonable request.
Ethics Statement
The study was approved by the Ethics Committee of the First Affiliated Hospital of Shenzhen University (Approval No. 2024-209-01PJ). All procedures involving human participants were conducted in accordance with the ethical standards of the institutional research committee and the Declaration of Helsinki. All patients signed the informed consent.
Acknowledgments
We are grateful to Qizhou Liang, and to the patients and clinical staff for their participation in this study.
Author Contributions
Shuo Cheng: Conceptualization, Methodology, Data curation, Investigation, Formal analysis, Writing – original draft. Yi Jiang: Methodology, Validation, Writing – original draft. Zhanheng Hu: Methodology, Data curation, Formal analysis, Writing – original draft. Xue Guo: Investigation, Resources, Validation, Writing – original draft. Qin Lai: Data curation, Investigation, Resources, Writing – original draft. Cuiling Fan: Investigation, Resources, Methodology, Writing – original draft. Suo Zhang: Formal analysis, Data curation, Writing – original draft. Bing Yuan: Formal analysis, Writing – review & editing. Yushuang Wei: Validation, Writing – review & editing. Meiying Wang: Project administration, Supervision, Writing – review & editing, Funding acquisition.
All authors took part in drafting, revising or critically reviewing the article; gave final approval of the version to be published; have agreed on the journal to which the article has been submitted; and agree to be accountable for all aspects of the work.
Funding
This study was supported by Sanming Project of Medicine in Shenzhen (SZSM202411006).
Disclosure
The authors declare that they have no competing interests. The authors declare no competing interests. Specifically, no authors have any affiliations with or financial involvement in any pharmaceutical companies, diagnostic firms, or commercial entities developing complement-targeting therapies relevant to this study.
References
1. Corona-Meraz FI, Vázquez-Del Mercado M, Sandoval-García F, et al. Biomarkers in systemic lupus erythematosus along with metabolic syndrome. J Clin Med. 2024;13(7):1988. doi:10.3390/jcm13071988
2. Xuan J, Deng C, Lu H, et al. Serum lipid profile in systemic lupus erythematosus. Front Immunol. 2024;15:1503434. doi:10.3389/fimmu.2024.1503434
3. Mok CC. Metabolic syndrome and systemic lupus erythematosus: the connection. Expert Rev Clin Immunol. 2019;15(7):765–12. doi:10.1080/1744666X.2019.1620601
4. Bello N, Meyers KJ, Workman J, Hartley L, McMahon M. Cardiovascular events and risk in patients with systemic lupus erythematosus: systematic literature review and meta-analysis. Lupus. 2023;32(3):325–341. doi:10.1177/09612033221147471
5. Ayano M, Horiuchi T. Complement as a biomarker for systemic lupus erythematosus. Biomolecules. 2023;13(2):367. doi:10.3390/biom13020367
6. Gandino IJ, Scolnik M, Bertiller E, Scaglioni V, Catoggio LJ, Soriano ER. Complement levels and risk of organ involvement in patients with systemic lupus erythematosus. Lupus Sci Med. 2017;4(1):e000209. doi:10.1136/lupus-2017-000209
7. Paglialunga S, Fisette A, Yan Y, et al. Acylation-stimulating protein deficiency and altered adipose tissue in alternative complement pathway knockout mice. Am J Physiol Endocrinol Metab. 2008;294(3):E521–9. doi:10.1152/ajpendo.00590.2007
8. Martínez-Urbistondo M, Higuera-Gómez A, de Cuevillas B, et al. Visceral fat, cardiovascular risk factors and quality of life in lupus activity categorised via complement C3. Lupus Sci Med. 2025;12(1):e001423. doi:10.1136/lupus-2024-001423
9. Szabó MZ, Szodoray P, Kiss E. Dyslipidemia in systemic lupus erythematosus. Immunol Res. 2017;65(2):543–550. doi:10.1007/s12026-016-8892-9
10. Benagiano M, Borghi MO, Romagnoli J, et al. Interleukin-17/Interleukin-21 and Interferon-γ producing T cells specific for β2 Glycoprotein I in atherosclerosis inflammation of systemic lupus erythematosus patients with antiphospholipid syndrome. Haematologica. 2019;104(12):2519–2527. doi:10.3324/haematol.2018.209536
11. Atta AM, Silva J, Santiago MB, Oliveira IS, Oliveira RC, Sousa Atta MLB. Clinical and laboratory aspects of dyslipidemia in Brazilian women with systemic lupus erythematosus. Clin Rheumatol. 2018;37(6):1539–1546. doi:10.1007/s10067-018-4051-0
12. Andersen CJ. Impact of dietary cholesterol on the pathophysiology of infectious and autoimmune disease. Nutrients. 2018;10(6):764. doi:10.3390/nu10060764
13. Tselios K, Koumaras C, Gladman DD, Urowitz MB. Dyslipidemia in systemic lupus erythematosus: just another comorbidity? Semin Arthritis Rheum. 2016;45(5):604–610. doi:10.1016/j.semarthrit.2015.10.010
14. Feng L, Zhao Y, Wang WL. Association between complement C3 and the prevalence of metabolic-associated fatty liver disease in a Chinese population: a cross-sectional study. BMJ Open. 2021;11(10):e051218. doi:10.1136/bmjopen-2021-051218
15. García-González M, Gómez-Bernal F, Quevedo-Abeledo JC, et al. HDL cholesterol efflux and the complement system are linked in systemic lupus erythematosus. J Clin Med. 2023;12(16):5405. doi:10.3390/jcm12165405
16. Kiss MG, Binder CJ. The multifaceted impact of complement on atherosclerosis. Atherosclerosis. 2022;351:29–40. doi:10.1016/j.atherosclerosis.2022.03.014
17. Wahlin B, Braune A, Jönsson E, Wållberg-Jonsson S, Bengtsson C. Beneficial effects of hydroxychloroquine on blood lipids and glycated haemoglobin: a randomised interventional study in patients with rheumatoid arthritis and systemic lupus erythematosus. PLoS One. 2024;19(10):e0312546. doi:10.1371/journal.pone.0312546
18. Nashel DJ. Is atherosclerosis a complication of long-term corticosteroid treatment? Am J Med. 1986;80(5):925–929. doi:10.1016/0002-9343(86)90639-X
19. Roldan PC, Greene ER, Qualls CR, Sibbitt WL, Roldan CA. Progression of atherosclerosis versus arterial stiffness with age within and between arteries in systemic lupus erythematosus. Rheumatol Int. 2019;39(6):1027–1036. doi:10.1007/s00296-019-04267-y
20. Wilson PWF, Polonsky TS, Miedema MD, Khera A, Kosinski AS, Kuvin JT. Systematic review for the 2018 AHA/ACC/AACVPR/AAPA/ABC/ACPM/ADA/AGS/APhA/ASPC/NLA/PCNA guideline on the management of blood cholesterol: a Report of the American College of Cardiology/American Heart Association Task Force on clinical practice guidelines. J Am Coll Cardiol. 2019;73(24):3210–3227. doi:10.1016/j.jacc.2018.11.004
21. Hochberg MC. Updating the American College of Rheumatology revised criteria for the classification of systemic lupus erythematosus. Arthritis Rheum. 1997;40(9):1725. doi:10.1002/art.1780400928
22. Huang S, Zhang Z, Cui Y, Yao G, Ma X, Zhang H. Dyslipidemia is associated with inflammation and organ involvement in systemic lupus erythematosus. Clin Rheumatol. 2023;42(6):1565–1572. doi:10.1007/s10067-023-06539-2
23. Liu J, Song W, Cui D. Relationship between blood lipid profiles and risk of lupus nephritis in children. Int J Clin Pract. 2022;2022:6130774. doi:10.1155/2022/6130774
24. Zhou B, Xia Y, She J. Dysregulated serum lipid profile and its correlation to disease activity in young female adults diagnosed with systemic lupus erythematosus: a cross-sectional study. Lipids Health Dis. 2020;19(1):40. doi:10.1186/s12944-020-01232-8
25. Weinstein A, Alexander RV, Zack DJ. A Review of Complement Activation in SLE. Curr Rheumatol Rep. 2021;23(3):16. doi:10.1007/s11926-021-00984-1
26. Swaak AJ, van Rooyen A, Vogelaar C, Pillay M, Hack E. Complement (C3) metabolism in systemic lupus erythematosus in relation to the disease course. Rheumatol Int. 1986;6(5):221–226. doi:10.1007/BF00541371
27. Diószegi Á, Lőrincz H, Kaáli E, et al. Role of altered metabolism of triglyceride-rich lipoprotein particles in the development of vascular dysfunction in systemic lupus erythematosus. Biomolecules. 2023;13(3):401. doi:10.3390/biom13030401
28. Parra S, Vives G, Ferré R, et al. Complement system and small HDL particles are associated with subclinical atherosclerosis in SLE patients. Atherosclerosis. 2012;225(1):224–230. doi:10.1016/j.atherosclerosis.2012.08.029
29. Sun W, Li P, Cai J, et al. Lipid metabolism: immune regulation and therapeutic prospectives in systemic lupus erythematosus. Front Immunol. 2022;13:860586. doi:10.3389/fimmu.2022.860586
30. Hess C, Kemper C. Complement-mediated regulation of metabolism and basic cellular processes. Immunity. 2016;45(2):240–254. doi:10.1016/j.immuni.2016.08.003
31. Zhang L, Dai Y, Huang P, et al. Absence of complement component 3 does not prevent classical pathway-mediated hemolysis. Blood Adv. 2019;3(12):1808–1814. doi:10.1182/bloodadvances.2019031591
32. Xu Z, Tao L, Su H. The complement system in metabolic-associated kidney diseases. Front Immunol. 2022;13:902063. doi:10.3389/fimmu.2022.902063
33. Rodríguez-González D, García-González M, Gómez-Bernal F, et al. Relationship between the complement system and serum lipid profile in patients with rheumatoid arthritis. Front Immunol. 2024;15:1420292. doi:10.3389/fimmu.2024.1420292
34. Alic L, Dendinovic K, Papac-Milicevic N. The complement system in lipid-mediated pathologies. Front Immunol. 2024;15:1511886. doi:10.3389/fimmu.2024.1511886
 © 2026 The Author(s). This work is published and licensed by Dove Medical Press Limited. The
full terms of this license are available at https://www.dovepress.com/terms
and incorporate the Creative Commons Attribution
- Non Commercial (unported, 4.0) License.
By accessing the work you hereby accept the Terms. Non-commercial uses of the work are permitted
without any further permission from Dove Medical Press Limited, provided the work is properly
attributed. For permission for commercial use of this work, please see paragraphs 4.2 and 5 of our Terms.
© 2026 The Author(s). This work is published and licensed by Dove Medical Press Limited. The
full terms of this license are available at https://www.dovepress.com/terms
and incorporate the Creative Commons Attribution
- Non Commercial (unported, 4.0) License.
By accessing the work you hereby accept the Terms. Non-commercial uses of the work are permitted
without any further permission from Dove Medical Press Limited, provided the work is properly
attributed. For permission for commercial use of this work, please see paragraphs 4.2 and 5 of our Terms.