Back to Journals » Diabetes, Metabolic Syndrome and Obesity » Volume 13
Red Blood Cell Parameters and Their Correlation with Renal Function Tests Among Diabetes Mellitus Patients: A Comparative Cross-Sectional Study
Authors Adane T ![]() , Getaneh Z
, Getaneh Z ![]() , Asrie F
, Asrie F
Received 4 August 2020
Accepted for publication 25 September 2020
Published 23 October 2020 Volume 2020:13 Pages 3937—3946
DOI https://doi.org/10.2147/DMSO.S275392
Checked for plagiarism Yes
Review by Single anonymous peer review
Peer reviewer comments 2
Editor who approved publication: Prof. Dr. Juei-Tang Cheng
Tiruneh Adane, Zegeye Getaneh, Fikir Asrie
School of Biomedical and Laboratory Sciences, Department of Hematology and Immunohematology, College of Medicine and Health Sciences, University of Gondar, Gondar, Ethiopia
Correspondence: Tiruneh Adane
School of Biomedical and Laboratory Sciences, Department of Hematology and Immunohematology, College of Medicine and Health Sciences, University of Gondar, PO Box 196, Gondar, Ethiopia
Tel +251949914917
Email [email protected]
Background: Diabetes mellitus (DM) patients show a significant derangement in various hematological parameters including changes affecting the red blood cells (RBCs). All these derangements have an imposing effect on any of the RBC indices. Thus, the main aim of this study was determining the RBCs parameters and their correlation with renal function, and also the magnitude of anemia in DM patients in comparison with healthy controls.
Methods: A comparative cross-sectional study was conducted at the chronic illness clinic of University of Gondar Hospital from January to April 2020. A total of 246 participants (164 DM and 82 controls) were selected using a simple random sampling technique. Data were collected using a pretested structured questionnaire. Five milliliters venous blood was collected by vacutainer blood collection technique. RBC parameters and renal function tests were determined by using Sysmex KX21N and BS-200E Mindray analyzers, respectively. The data were tested for normality using Shapiro–Wilk and Kolmogorov–Smirnov tests. Independent sample t-test and Pearson’s and Spearman correlation statistics were used to analyze variables. A p-value ˂0.05 was considered as statistically significant.
Results: The mean hemoglobin (Hgb) concentration was 13.8± 0.7 and 15± 1.3 among DM and controls, respectively. RBC (p=0.014), Hgb (p ˂0.001), hematocrit (Hct) (p ˂0.001), and mean cell volume (MCV) (p ˂0.001) were significantly lower in DM patients as compared to controls. On the other hand, mean cell hemoglobin concentration (MCHC) was significantly increased in DM patients (p ˂0.001) than the controls. Besides, a significant negative correlation was found between Hgb and creatinine (Cr) in DM patients.
Conclusion: The mean values of RBC parameters (RBC, Hgb, Hct, and MCV) for DM patients were found significantly lower than the control groups. Besides a significant negative correlation was found between Cr and RBC indices (RBC, Hgb, Hct, and MCV) in DM patients. It is, therefore, suggested that RBC parameters abnormalities should be evaluated and treated periodically in DM patients for better prognosis and quality of life.
Keywords: anemia, diabetes mellitus, Ethiopia, Gondar, RBC parameters, renal function
Introduction
DM is a group of metabolic disorders characterized by hyperglycemia resulting from defects in insulin secretion, insulin action, or in both conditions. The chronic hyperglycemia of DM is associated with long-term damage, dysfunction, and failure of various organs, especially the eyes, kidneys, nerves, heart, and blood vessels.1 DM is confirmed when the fasting and random blood glucose value becomes >125 mg/dL and >200 mg/dL, respectively.1,2 It can be classified into Type 1 DM (T1DM) and Type 2 DM (T2DM) based on insulin dependency. T1DM is caused by an autoimmune reaction, where the body’s defense system attacks the insulin-producing beta cells in the pancreas. As a result, the body can no longer produce the insulin it needs.3 T2DM results from insulin resistance and is commonly seen in adults.4
DM is shown to be directly associated with several hematological changes affecting the RBCs.5 Hyperglycemia promotes the persistent elevation of glycosylated Hgb and which is associated with the structural and functional changes in Hgb molecule, the osmotic disturbance, and the cytoplasmic viscosity within each cell. All these changes could have an imposing effect on any of the RBC indices, which includes the RBCs count, Hct, MCV, mean cell hemoglobin (MCH), MCHC, and red cell distribution width (RDW).6
The chronic hyperglycemia in DM has also a direct impact on the development of an inflammatory condition induced by the increased expression of proinflammatory cytokines such as Interleukin (IL)-1, IL-6, tumor necrosis factor- α, transforming growth factor-β, and interferon’s, several of which are involved in apoptosis of erythroid progenitor. The elevation of these cytokines plays an essential role in insulin resistance and induces the appearance of cardiovascular complications, kidney disease, and anemia. The increment of IL-6 in hyperglycemic patients causes antierythropoietic effect and changes the sensitivity of progenitor cells to erythropoietin (Epo) and also promotes apoptosis of immature RBCs causing a decrease in the number of circulating RBCs eventually results in anemia.7,8
The chronic hyperglycemia of DM might also result in abnormal RBCs, oxidative stress, and sympathetic denervation of the kidney related to autonomic neuropathy. These factors promote a hypoxic environment in the renal interstitium, which leads to impaired production of Epo by the peritubular fibroblasts. Inappropriately low Epo level is an important cause of anemia in patients with DM.9 Anemia is a common hematological finding in DM patients and is defined as a reduction in the Hgb concentration of blood, which consequently reduces the oxygen-carrying capacity of RBCs such that they are unable to meet the body’s physiological needs.10 The presence of anemia in DM patients harms the health of patients by worsening the cardiovascular risk and hypoxia-induced end-organ damage like diabetic retinopathy, nephropathy, and foot ulcers.11
The risk of developing anemia in DM patients with renal disease is significantly greater and is often more severe with earlier onset than in DM patients without renal impairment.12 High death rates are even more common in anemic people with DM who also have heart failure and/or kidney diseases.13 Despite these facts, anemia is unrecognized in 25% of DM patients.14 Anemia is associated with a more rapid decline in the glomerular filtration rate (GFR) and is considered to be an important cardiovascular risk factor.15
The magnitude of anemia in DM was estimated in some parts of Ethiopia, but the association between the RBC parameters and the level of renal function tests was not well defined. The magnitude of anemia in DM was not also studied so far in the study area (Gondar). Even though the value of a performed blood count is well known, as well as the multiplicity of information it gives, there are no recommendations whether and when it should be carried out in DM patients. Complete blood count (CBC) would only be performed if clinically indicated. Therefore, this study aimed at determining RBC parameters and their correlation with renal function and also to determine the magnitude of anemia among DM patients in comparison with healthy controls attending the University of Gondar Specialized Referral Hospital.
Materials and Methods
Study Design, Period and Setting
A comparative cross-sectional study was conducted on a total of 246 participants (164 DM and 82 controls) from January to April, 2020 at the chronic illness clinic of University of Gondar Hospital, Northwest Ethiopia. Gondar town is found in Amhara regional state at 738 km from the capital city of Ethiopia, Addis Ababa. It has situated at 2133 meters above sea level. The University of Gondar Specialized Referral Hospital is a teaching hospital serving approximately 5–7 million people throughout most of the Amhara regional state and nearby regions. As a teaching hospital, it plays an important role in providing teaching, research, and community service. The facility has more than 500 inpatient beds and has a range of specialties including chronic illness outpatient clinic. The Diabetes illness care follow-up clinic has been providing service to more than 8000 DM patients.
Study Populations
This study included all patients with DM aged 18 years and above attending at the University of Gondar Specialized Referral Hospital Chronic Illness Clinic follow-up in the time interval and volunteered to give informed written consent were included in the study. Apparently, healthy volunteer non-remunerated blood donors who had no previous history of chronic diseases were included as control participants. However, critically ill DM patients who were unable to communicate, post-surgery patients, patients with a known hematologic disease, and patients with blood transfusion in the last 3 months were excluded from the study. Apparently, healthy volunteer non-remunerated blood donors who had previous history of chronic diseases and those who were not willing to participate were excluded from the study. Infectious disease screening (Human immunodeficiency viruses, Hepatitis B and C, Syphilis, and Malaria) was done and the health status of the control groups was also assessed based on the national blood bank service blood donor questionnaire.
Variables
RBC parameters like; RBC, Hgb, Hct, MCV, MCH, MCHC, RDW, and anemia were considered as dependent variables of this study. On the other hand, anthropometric measurements and clinical characteristics like; Age, Sex, Body mass index (BMI), systolic blood pressure (SBP), diastolic blood pressure (DBP), duration of illness, kidney disease, and heart disease were also taken as independent variables.
Sample Size and Sampling Technique
The two-population mean formula was used to calculate the sample size using OpenEpi, version 2, open-source calculator by considering 95% confidence interval, 80% power, and the ratio of the cases to control group as 2:1. By taking the mean ±standard deviation of Hgb (12.76±1.49; 13.26 ±1.3) for DM and control group, respectively, from a study conducted in Bangladesh,16 the sample size calculated was 246. Thus, 246 study participants (164 DM (68 females and 96 males), and 82 apparently healthy controls (34 females and 48 males)) were selected by a simple random sampling technique. Every item in the population had an even chance of being selected, hence the selection of item entirely depends on luck or probability. Table of random numbers was employed to minimize the effect of biases in the study.
Definitions
Anemia is considered when Hgb <13 g/dL in men and <12 g/dL in women. Based on its severity, WHO has classified anemia into three categories: mild (11.0 −11.9 g/dl for females and 11.0–12.9 for males), moderate (8.0 −10.9 g/dl), and severe (<8 g/dl).17 Based on MCV, anemia was classified as microcytic (<80 fl), normocytic (between 80 and 100 fl), or macrocytic (>100 fl). Anemia was also classified based on MCHC as hypochromic (MCHC <32 g/dl), or normochromic (MCHC ≥ 32 g/dl).18 Staging of CKD was based on the kidney disease outcomes quality initiative (KDOQI) guidelines: ≥90 (CKD1) and additional signs of kidney damage, 60–89 (CKD 2), 30–59 (CKD 3), 15–29 (CKD 4) and <15 (CKD 5) mL/min 1.73 m2.19 Concerning BMI; Underweight was considered when BMI is <18.5 kg/m2; Normal weight: it was considered when an individual’s BMI is between 18.5 and 24.9 kg/m2; Overweight: was considered when an individual’s BMI ranges from 25 to 29.9 kg/m2 and Obesity is considered when an individual’s BMI is ≥30 kg/m2.20
Data Collection and Laboratory Methods
A pre-tested structured questionnaire was used to obtain socio-demographic characteristics (age, gender, residence, monthly income, and level of education) and behavioral measures (cigarette smoking and physical activity) from the study participants via face-to-face interview.
Clinical data including duration of illness, family history of DM, hypertension, presence of cardiac, and renal disease were extracted from patients’ logbooks. Blood pressure was taken using mercury sphygmomanometer in a sitting position after 15 minutes of rest and two measurements were averaged to be recorded. Five minutes interval recommended between the two measurements. Anthropometric data were collected by attending nurses by recording the weight and height of the study participants. A portable weight scale and locally made stadiometer with a sliding headpiece were used to measure weight (to the nearest 0.1 kg) and height (to the nearest 0.1 cm) without shoes in the upright position, respectively. The BMI was calculated as weight divided by the square of height (kg/m2).
Five mL of venous blood was collected by a using vacutainer blood collection system. Three mL of the collected whole blood with K2EDTA anticoagulant were mixed properly and analyzed for RBC parameters determination using Sysmex KX21N (Sysmex Corporation, Japan) hematology analyzer. Two mL of collected whole blood in serum separation tube was allowed to clot for 15 to 30 minutes and then centrifuged at 3000 rpm for 5 min and serum was separated. The separated serum was analyzed using a BS-200E Mindray (Guangzhou labon, China) chemistry analyzer for Cr and blood urea nitrogen (BUN) determination. The GFR was estimated using the 4-variable modification of diet in renal disease (MDRD) equation (GFR in mL/min per 1.73 m2 = 175 x Serum Cr−1.154 x age−0.203 x 1.212 (if patient is black) x 0.742 (if female)).
Data Quality Control and Quality Assurance
The structured questionnaire was prepared in English and translated to the local language (Amharic) and it was also be re-translated to English to see the consistency of the questionnaire. The questionnaire was pre-tested on 5% of the sample size other than the study area. Before the actual data collection, training and demonstration were given for the data collectors (nurse and medical laboratory professionals) about the study participants’ rights, the objectives of the study, confidentiality, the procedure of specimen collection, and how to approach and interview participants to ensure data quality. All aspects of the data collection process were supervised by the principal investigator to ensure data quality. The blood samples were tested according to the manufacture’s instruction and standard operating procedure (SOP) was strictly followed in the determination of RBC parameters tests. The control sample (low, normal, and high) was run daily to monitor the performance of the system. Commercial control materials were properly warmed at room temperature (18°C–25°C), for approximately 15 minutes and mixed according to the manufacturer’s recommendations. Normal and pathogenic control sera for Cr and BUN determination were used to monitor the performance of assay procedures in Mindray BS 200E analyzer. The venous blood samples were tested according to the manufacture’s instruction and SOP was strictly followed in the determination of RBC parameters and renal function tests to address all the quality issues in the pre-analytical, analytical, and post-analytical stages.
Data Analysis and Interpretation
Epidata version 4.6.02 was used for data entry and Statistical Package for Social Sciences (SPSS) version 20 (IBM Corporation, Armonk, NY, USA) software was used for statistical analysis. The data were tested for normality with the help of Shapiro–Wilk and Kolmogorov–Smirnov tests. Results were presented as frequency, mean ±standard deviation (SD), and median as appropriate. Independent sample t-test was used to compare the mean differences of RBC parameters and renal function tests between the DM groups and controls. The strength of association between the pairs of variables was assessed by Pearson’s and spearman’s (ranked data) correlation coefficient. A p-value <0.05 was considered as statistically significant.
Ethical Consideration
The study was conducted after it had been reviewed and approved by the Ethical Review Committee of the School of Biomedical and Laboratory Sciences, College of Medicine and Health Sciences, University of Gondar. Permission letter to conduct the study were also be obtained from the University of Gondar Specialized Referral Hospital chief executive officer. The objective of the research was explained and written informed consent was obtained from the study participants. Then, those who were willing to participate were included in the study. Participation in the study was voluntary and refusal was possible. To ensure the confidentiality of data, study participants were identified using codes and unauthorized persons had no access to the collected data. The information that might expose the identity of the study participants was not collected. Only the principal investigator had access to the computerized data. Abnormal findings were linked to physicians for proper treatment and prognosis of patients.
Results
Socio-Demographic Characteristics of the Study Participants
A total of 246 (164 DM patients and 82 apparently healthy controls) participants were included in this study. One hundred thirteen (68.9%) DM patients and 75 (91.5%) controls were urban dwellers. The median age of DM patients was 50 and the mean age was 35.5±7.4 years in the control groups. About 45 (27.4%) of the patients were unable to read and write, and 45 (54.9%) controls had a diploma level of education (Table 1).
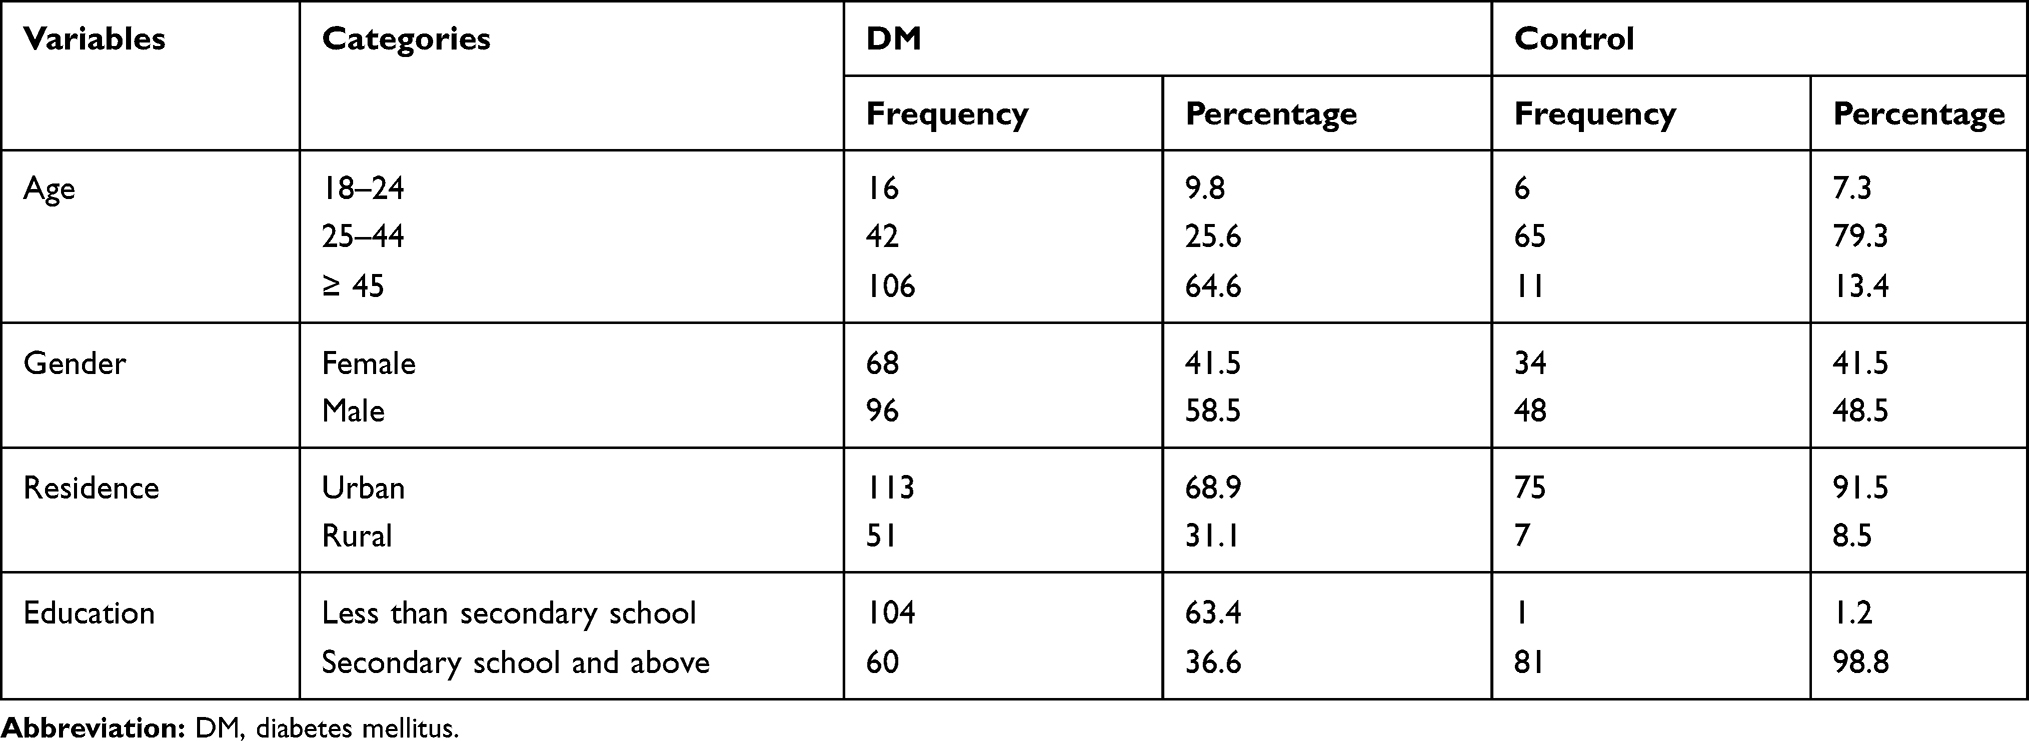 |
Table 1 Socio-Demographic Characteristics of DM Patients and Healthy Controls at University of Gondar Specialized Referral Hospital, Northwestern Ethiopia, January to April 2020 |
Behavioral and Clinical Characteristics of the Study Participants
The study revealed that 7 (4.3%) and 37 (22.6%) of the participants had evidence of cigarette smoking and family history of DM, respectively. Moreover, 74 (45.1%), 64 (39%), 26 (15.9%) DM patients had ˂ 5 years, 5–10 years, and ˃ 10 years duration of illness, respectively. Of the 164 DM patients, 42.1% and 40.2% had a history of alcohol use and physical inactivity, respectively. Eighty-two (50%) of the DM patients were overweight; moreover, hypertension (27.4%) and kidney disease (14.6%) were the common comorbidities in those patients. In this study, 11 (6.9%) had an eGFR value of ˂ 60 mL/min/1.73m2.
Magnitude of Anemia Among the Study Participants
The magnitude of anemia among the study participants was obtained by considering the cutoff values of Hgb (<12 g/dl for women and <13 g/dl for men) after altitude adjustments. The study area has an altitude of 2133 m and Hgb value was adjusted by subtracting 0.8 g/dl. Based on this, among the total of 164 DM patients, the magnitude of anemia was 13.4% (95% CI: 8.2%, 18.8%). Anemia was more common in diabetic males (81%) than females (19%). In the control group, 9/82 (11%) had anemia (95% CI: 4%, 17.9%). In this study, from anemic patients, 14 (63.6%) and 9 (100%) had normocytic normochromic anemia in DM and controls, respectively. Microcytic hypochromic anemia is prevalent in 30% of DM patients. Regarding the severity of anemia, 13 (59%) DM patients were moderately anemic.
Comparison of the Red Cell Parameters of the Study Participants
The mean ±SD value of Hgb concentration was 13.8±0.7 and 15±1.3 among DM and controls, respectively. Hgb, Hct, MCV (P-value˂ 0.001), and RBC (P-value=0.014) were found significantly lower in DM patients as compared to controls. However, a significant increase in MCHC (P-value ˂ 0.001) was found in DM patients as compared to controls (Table 2).
 |
Table 2 Comparison of Red Cell Parameters of DM Patients and Controls at University of Gondar Specialized Referral Hospital, Northwest Ethiopia, 2020 |
Correlation of RBC Parameters with Blood Pressure, Duration of DM, Anthropometric Measurements and Renal Function Tests of Study Participants
Regarding the correlation of RBC indices with SBP and DBP, only MCV (P-value = 0.024) and MCH (P-value = 0.017) were found to be positively correlated with DBP in DM. There was no significant correlation between SBP with RBC indices in DM patients. In the control group, only RBC count (P-value=0.049) and MCH (p-value=0.028) were found to be negatively correlated with DBP (Table 3).
 |
Table 3 Spearman Correlations (rho) of RBC Parameters with SBP and DBP Among DM Patients and Controls at University of Gondar Specialized Referral Hospital, Northwest Ethiopia, 2020 |
Among the RBC parameters, only MCHC (P-value= 0.007) was found negatively correlated with BMI in DM patients. In the control group, Hgb (P-value= 0.047) was found to be positively correlated with BMI. MCV (P-value= 0.004) and MCH (P-value= 0.024) are another parameters to be negatively correlated with BMI in the control group. There was no significant correlation among the RBC indices with duration of illness (Table 4).
 |
Table 4 Pearson’s Correlations of RBC Indices with BMI and Duration of Illness Among DM Patients and Controls at University of Gondar Specialized Referral Hospital, Northwest Ethiopia, 2020 |
RBC (p-value = 0.028), Hgb (p-value ˂ 0.001), Hct (P-value = 0.006), and MCV (p-value = 0.013) showed significant negative correlation with Cr value in DM patients. However, there was no significant correlation between RBC parameters with eGFR value and BUN in DM patients (Table 5).
 |
Table 5 Pearson’s Correlation of RBC Parameters with Renal Function Tests in DM Patients and Controls at University of Gondar Specialized Referral Hospital, Northwest Ethiopia, 2020 |
Discussion
Diabetes mellitus patients show a significant derangement in various hematological parameters including changes affecting the RBCs. All these derangements have an imposing effect on any of the RBC indices.6 A total of 246 study participants (164 DM and 82 controls) were involved in this study to compare RBC indices among DM patients and controls. In this study, the mean Hgb concentration was 13.8±0.7 and 15±1.3 among DM and controls, respectively.
The mean values of Hgb among DM patients were significantly lower than those of non-diabetic controls. The finding of this study was in agreement with the finding of several studies in Egypt, India, Bangladesh, Libya, and Nigeria.16,21–24 The relatively low Hgb level in DM patients is since the heme (protein) part of Hgb is subjected to glycation and is affected by the duration and level of hyperglycemia in those patients. During DM, the excess glucose present in blood reacts with Hgb to form glycosylated Hgb, so the total Hgb level is decreased.6 It has been suggested in another study that this low Hgb might be because of the reduction in the number of specific Epo synthesizing interstitial cells and disruption of the interstitial anatomy or vascular architecture.25 Systemic inflammation, functional hematinic deficiencies, Epo resistance, and reduced survival of RBC also lead to low Hgb value in the setting of impaired renal compensation.26 However, in contrast to this study, some works of literature in Pakistan and Ethiopia reported higher Hgb value in DM patients as compared to controls.27,28 Ethnic and lifestyle differences across the study populations may account for the variability of Hgb across those studies.
In addition to lower Hgb count, Hct and MCV values were found significantly lower in the diabetic group as compared to the controls. It was supported by a previous study conducted in Nigeria that reported Hct was lower in DM (38.20 ± 0.64) than the controls (42.30 ± 0.43).29 The reason for the declined results might be due to the effect of toxic substances on bone marrow depression causing damage to multiple classes of hematopoietic cells.30,31 In DM patients, the lifespan of RBC may be decreased as a result of disturbances in the hematopoietic milieu. These disturbances can cause an increased internal viscosity and membrane rigidity in the RBCs and cause a decrease in the number of RBCs which in turn reduces the volume of RBCs.32 Hyperglycemia increases the production of lipid peroxides causing hemolysis of RBCs or it may cause anemia as secondary disorder.33 However, in contrast to this study, some works of literature in Ethiopia, Pakistan, and the Caribbean (Trinidad and Tobago) reported a high Hct value in DM patients.5,28,34 The lower MCV value in DM patients in this study might be the presence of microcytic anemia in those patients.31
The finding of this study also showed that RBC count was lower in the DM group as compared to controls. Likewise, a study conducted in Tobago34 and India35 reported that RBC count in DM patients was lower than the controls. The possible reason for this difference might be since chronic hyperglycemia causes non-enzymatic glycosylation of RBC membrane proteins leading to accelerated ageing of RBCs.36 Hyperglycemia also raises sorbitol level in RBCs and this impairs Na+/K+-ATPase activity and consequently leads to osmotic imbalance and cell death in those patients. Hyperglycemia can also contribute to the formation of advanced glycation end products (AGE) that increases the level of oxidative stress by stimulating increased production of free oxygen radicals. Those free radicals damage the cells Deoxyribonucleic acid (DNA) and cause apoptosis of cells.37 The decreased RBCs count could also be a consequence of Epo deficiency among patients with diabetic nephropathy or as a result of increased RBC destruction secondary to microangiopathy.38 However, in contrast to this study, a study conducted in Ethiopia27 and Iraq37 reported a high RBC count in DM patients.
On the other hand, MCHC value was significantly higher in the diabetic groups as compared to controls. This finding was in agreement with previous studies conducted in Ethiopia, Pakistan, Nigeria, India, and Turkey.5,28–30,39 Increased MCHC in DM might be due to the reduction of RBC membrane flexibility (deformability) and increment of membrane rigidity because of hyperglycemia in those patients.40 Hyperglycemia also increases the generation of superoxide anion that may cause several structural and functional modifications of the RBCs including aggregation and attachment of Hgb to the inside of the RBC membrane network. This may result in the alteration of the cell shape (may be spherical) and mechanical properties of RBCs. The Hgb attachment to the spectrin network also increases the intracellular or cytosolic viscosity of the RBCs that is related to MCHC. Bone marrow suppression as a result of intoxication also increases MCHC value.41 In contrast to this study, a study done in India showed that the mean value of MCHC in the control group was higher than DM patients.23
The Hgb test result revealed that 22 (13.4%) of DM patients were anemic (95% CI: 8.2%–18.8%). This magnitude was lower than previous studies done in Ethiopia in 201342 and 201943 which reported 19.6% and 26.7%, respectively. This difference might be variation in the study design used and the small sample size in this study. However, this study was comparable with another study in European (Ireland) populations36 where they reported 13% magnitude of anemia.
In this study from anemic patients, the majority of them had normocytic normochromic anemia (63.6%), while 30% had microcytic hypochromic anemia. This finding was in corroborating with another study in Malaysia.44 Normocytic normochromic anemia is a characteristic presentation of anemia of chronic diseases (ACD) and it evolves into microcytic anemia as the severity of the disease increases.45 The previous study on DM patients has shown that longstanding poorly controlled DM is associated with normocytic normochromic anemia and precedes clinical evidence of renal impairment.46 Microcytic anemia may be primarily because of iron deficiency anemia (IDA), which is the common anemia type in T1DM. This might be explained by the fact that chronic hyperglycemia promotes the modulation of transferrin receptors by glycation, which might impair the capacity of these receptors to bind iron, and thus reduce iron availability.9 Respecting the severity of anemia, from anemic patients, 13 (59%) were moderately anemic in DM. This is because of ACD is usually mild to moderately severe anemia (Hgb rarely ˂ 8 g/dL) that develops in the setting of infection, inflammatory disease, or malignancy.45
The study also revealed that anemia was more prevalent among the diabetic patients (13.4%) than controls (11%), as the former group of participants were previously shown to have a high prevalence of the metabolic syndrome.47 The median duration of illness was 6 years and this supports the notion that DM has a long asymptomatic preclinical phase, which frequently goes undetected. At the time of diagnosis, the patient could have one or more DM complications including anemia, especially in resource-poor developing countries.34 In this study, anemia was more likely to occur in male patients as compared to females. This might be explained by the fact that low testosterone levels and hypo-gonadotropic hypogonadism are common in male DM patients. Since testosterone stimulates erythropoiesis, low testosterone levels may contribute to anemia in male patients.32 Another hypothesis is that, since the median age of the female patients in this study was 51 years, there may be a decrease in the occurrence of anemia in females due to reduced blood loss because of menopause.
In the correlation analysis, this study found that DBP was positively correlated with MCV and MCH in DM patients. The correlation between the level of Blood pressure and RBC parameters might be as a result of the development of DM-related hypertension and dyslipidemia in those patients.48 BMI was found to be negatively correlated with Hgb, MCH, and MCHC in DM. This finding was also in corroborating with a study conducted in Italy.49 This might be explained that MCHC was reduced in obese subjects (higher BMI), which could be the result of hyposideremia that lowers the RBC indices as a result of a low-calorie diet, as practiced by these obese subjects.6
A significant negative correlation was found between Cr value and RBC, Hgb, Hct, and MCV in DM patients. This finding was in agreement with another study in Cameroon18 and Nigeria who had reported a significant negative correlation between Cr and Hgb.21 This negative correlation between Hgb and Cr in DM is because, when there is a problem in the kidney or the kidney is not functioning properly, there is an increment of Cr and BUN in those patients. In DM patients, damage to the peritubular fibroblasts can occur and lead to Epo deficiency and low Hgb that led to anemia.18,50
The present study had some limitations: Since the study design was cross-sectional, it is difficult to establish the cause–effect relationship between DM and RBC parameters. The glycemic control of the patients was not assessed to observe the effect of hyperglycemia on RBC parameters. The study was not also designed to investigate the type of anemia presented in DM patients since the study does not investigate parameters like serum iron, ferritin, and vitamin B12 due to resource scarcity. Another potential limitation is the study does not investigate hepcidin and renin angiotensin aldosterone system (RAAS) blockers due to resource scarcity. Even if, 24-hour urine is needed for GFR estimation, eGFR was calculated based on the 4-variable MDRD equation and this leads to overinflated CKD prevalence estimates.
Conclusion and Recommendation
The mean values of RBC parameters (RBC, Hgb, Hct, and MCV) for DM patients were significantly lower than the controls, indicating the presence of anemia in the former group. Besides a significant negative correlation was found between Cr and RBC indices (RBC, Hgb, Hct, and MCV) in DM patients. It is, therefore, suggested that RBC parameters abnormalities should be evaluated and treated periodically in DM patients for better prognosis and quality of life.
Abbreviations
ACD, Anemia of Chronic disease; AGE, Advanced Glycation End products; BMI, Body Mass Index; BUN, Blood Urea Nitrogen; CBC, Complete Blood Count; CKD, Chronic Kidney Disease; Cr, Creatinine; DBP, Diastolic Blood Pressure; DM, Diabetes Mellitus; EDTA, Ethylene Diamine Tetraacetic Acid; eGFR, Estimated Glomerular Filtration Rate; Epo, Erythropoietin; Hct, Hematocrit; Hgb, Hemoglobin; IDA, Iron Deficiency Anemia; IL, Interleukin; MCH, Mean Cell Hemoglobin; MCHC, Mean Cell Hemoglobin Concentration; MCV, Mean Cell Volume; MDRD, Modification of Diet in Renal Disease; RBC, Red Blood Cells; RDW, Red Cell Distribution Width; SBP, Systolic Blood Pressure; SOP, Standard Operating Procedures; T1DM, Type 1 Diabetes Mellitus; T2DM, Type 2 Diabetes Mellitus; WHO, World Health Organization.
Ethical Approval
The study was approved by the Ethical Review Committee of the School of Biomedical and Laboratory Sciences, College of Medicine and Health Sciences, University of Gondar. The study was also done per the declaration of Helsinki.
Acknowledgments
The authors appreciate the commitment of the study participants, data collectors, and the University of Gondar Specialized Referral Hospital laboratory staffs in the course of this study. We are very grateful to the University of Gondar, College of Medicine and Health Sciences for their financial support of this study.
Funding
University of Gondar.
Disclosure
The authors report no conflicts of interest in this work.
References
1. Association AD. Diagnosis and classification of diabetes mellitus. Diabetes Care. 2013;36(Supplement_1):67–74. doi:10.2337/dc13-S067
2. Al-Salman M. Anemia in patients with diabetes mellitus: prevalence and progression. General Med. 2015;1–4.
3. Atlas D; International diabetes federation. IDF Diabetes Atlas, 7th edn. Brussels, Belgium: IDF; 2015. Available from: https://www.idf.org/e-library/epidemiology-research/diabetes-atlas/13-diabetes-atlas-seventh-edition.htm.l.
4. Kohei K. Pathophysiology of type 2 diabetes and its treatment policy. JMAJ. 2010;53(1):41–46.
5. Biadgo B, Melku M, Abebe SM, Abebe M. Hematological indices and their correlation with fasting blood glucose level and anthropometric measurements in type 2 diabetes mellitus patients in Gondar, Northwest Ethiopia. Diabetes Metab Syndr Obes. 2016;9:91–99. doi:10.2147/DMSO.S97563
6. Alamri B, Bahabri A, Aldereihim A, et al. Hyperglycemia effect on red blood cells indices. Eur Rev Med Pharmacol Sci. 2019;23:2139–2150.
7. Fava S, Azzopardi J, Ellard S, Hattersley AT. ACE gene polymorphism as a prognostic indicator in patients with type 2 diabetes and established renal disease. Diabetes Care. 2001;24(12):2115–2120. doi:10.2337/diacare.24.12.2115
8. Angelousi A, Larger E. Anaemia, a common but often unrecognized risk in diabetic patients: a review. Diabetes Metab. 2015;41(1):18–27. doi:10.1016/j.diabet.2014.06.001
9. Singh D, Winocour P, Farrington K. Erythropoietic stress and anemia in diabetes mellitus. Nat Rev Endocrinol. 2009;5(4):204. doi:10.1038/nrendo.2009.17
10. Thomas M. Anemia in diabetes: marker or mediator of microvascular disease? Nat Rev Nephrol. 2007;3(1):20. doi:10.1038/ncpneph0378
11. Zoppini G, Targher G, Chonchol M, et al. Anaemia, independent of chronic kidney disease, predicts all-cause and cardiovascular mortality in type 2 diabetic patients. Atherosclerosis. 2010;210(2):575–580. doi:10.1016/j.atherosclerosis.2009.12.008
12. Gauci R, Hunter M, Bruce D, Davis W, Davis T. Anemia complicating type 2 diabetes: prevalence, risk factors and prognosis. J Diabetes Complications. 2017;31(7):1169–1174. doi:10.1016/j.jdiacomp.2017.04.002
13. Kaushik D, Parashar R, Malik P. Study of anaemia in type 2 diabetes mellitus. IJRMS. 2018;6(5):1529.
14. AlDallal S, Jena N. Prevalence of anemia in type 2 diabetic patients. J Hematol. 2018;7(2):57–61. doi:10.14740/jh411w
15. Paul D, Paul S, Asaduzzaman M, Juliana F, Hossain M. Prevalence of type 2 diabetes mellitus patients with anemia in a Bangladeshi population-a case control study. Int J Health Sci Res. 2017;7(3):121–125.
16. Alam J, Chandra S, Mokarrama M, Hoque M, Hasan M, Islam S, editors. A comparative analysis of biochemical and hematological parameters in diabetic and non-diabetic adults. AMS. 2015;2(1):9.
17. WHO. Hemoglobin concentrations for the diagnosis of anaemia and assessment of severity. WHO; 2011. Available from: https://apps.who.int/iris/bitstream/handle/10665/85839/WHO_NMH_NHD_MNM_11.1_eng.pdf?ua=1.
18. Feteh VF, Choukem S-P, Kengne A-P, Nebongo DN, Ngowe-Ngowe M. Anemia in type 2 diabetic patients and correlation with kidney function in a tertiary care sub-Saharan African hospital: a cross-sectional study. BMC Nephrol. 2016;17(1):29.
19. Levey A, Coresh J, Bolton K, et al. K/DOQI clinical practice guidelines for chronic kidney disease: evaluation, classification, and stratification. Am J Kidney Dis. 2002;39(2):1–266.
20. Detection NCEPEPo, Adults ToHBCi. Third report of the National Cholesterol Education Program Expert Panel on detection, evaluation, and treatment of high blood cholesterol in adults (Adult Treatment Panel III). Int Med Pub. 2002;106(25):3143–3421.
21. Awofisoye OI, Adeleye JO, Olaniyi JA, Esan A. Prevalence and correlates of anemia in type 2 diabetes mellitus: a study of a Nigerian outpatient diabetic population. Sahel Med J. 2019;22(2):55.
22. Aljohani AH, Alrubyyi MA, Alharbi AB, et al. The relation between diabetes type II and anemia. Egypt J Hosp Med. 2018;70(4):526–531. doi:10.12816/0043795
23. Kothari R, Bokariya P. A comparative study of haematological parameters in type 1 diabetes mellitus patients and healthy young adolescents. Int J Biol Med Res. 2012;3(4):2429–2432.
24. Al Salhen K, Mahmoud AY. Hematological profile of patients with type 2 diabetic mellitus in El-Beida, Libya. Ibnosina J Med Biomed Sci. 2017;9(3):76–80. doi:10.4103/1947-489X.210115
25. Dikow R, Schwenger V, Schömig M, Ritz E. How should we manage anaemia in patients with diabetes? NDT. 2002;17(1):67–72.
26. Thomas M, Tsalamandris C, MacIsaac R, Jerums G. Anaemia in diabetes: an emerging complication of microvascular disease. Curr Diabetes Rev. 2005;1(1):107–126. doi:10.2174/1573399052952587
27. Olana C. Abnormal hematological indices and anthropometric parameters associated with type 2 Diabetes. Int J Adv Res. 2019;10(11):e5296.
28. Jabeen F, Rizvi H, Aziz F, Wasti A. Hyperglycemic induced variations in hematological indices in type 2 diabetics. IJAR. 2013;1(8):322–334.
29. Umeji L, Paul A, Felix S, et al. Haematological profile of diabetes and non-diabetes patients in Abuja, Nigeria. IJRSI. 2019;6(5):2321–2705.
30. Srinivasa S, S. V. S, K. P. Haematological profile of diabetes and non-diabetes patients in rural tertiary centre. Int J Adv Med. 2017;4:1271. doi:10.18203/2349-3933.ijam20174111
31. Waggiallah H, Alzohairy M. The effect of oxidative stress on human red cells glutathione peroxidase, glutathione reductase level, and prevalence of anemia among diabetics. N Am J Med Sci. 2011;3(7):344. doi:10.4297/najms.2011.3344
32. Bharathi K. Study of haematological profile and its significance in type 2 Diabetes mellitus patients. JDPO. 2016;1(1):14–17.
33. Uko E, Erhabor O, Isaac I, et al. Some haematological parameters in patients with type-1 diabetes in Sokoto, North Western Nigeria. J Blood Lymph. 2013;3(110):2165–7831.
34. Ezenwaka C, Jones-LeCointe A, Nwagbara E, Seales D, Okali F. Anaemia and kidney dysfunction in Caribbean type 2 diabetic patients. Cardiovasc Diabetol. 2008;7(1):25. doi:10.1186/1475-2840-7-25
35. Harish Kumar S, Prabhakar K. Haematological profile of diabetes and non-diabetes patients in rural tertiary centre. IJAM. 2017;4:1271–1275.
36. Cawood T, Buckley U, Murray A, et al. Prevalence of anaemia in patients with diabetes mellitus. Ir J Med Sci. 2006;175(2):25. doi:10.1007/BF03167944
37. Ali MH, Hassan AJ. Assessment of the alteration of blood indices in patients with type 2 diabetic mellitus: a cross‑sectional study. Mustansiriya Med J. 2019;18(1):24–29. doi:10.4103/MJ.MJ_1_19
38. Huang YX, Wu ZJ, Mehrishi J, et al. Human red blood cell aging: correlative changes in surface charge and cell properties. J Cell Mol Med. 2011;15(12):2634–2642. doi:10.1111/j.1582-4934.2011.01310.x
39. Demirtas L, Degirmenci H, Akbas EM, et al. Association of hematological indices with diabetes, impaired glucose regulation and microvascular complications of diabetes. Int J Clin Exp Med. 2015;8(7):11420.
40. Moussa S. Biophysical changes in red blood cells and hemoglobin components of diabetic patients. J Genet Eng Biotechnol. 2007;5(1–2):27–32.
41. Cho YI, Mooney MP, Cho DJ. Hemorheological disorders in diabetes mellitus. J Diabetes Sci Technol. 2008;2(6):1130–1138. doi:10.1177/193229680800200622
42. Abate A, Birhan W, Alemu A. Association of anemia and renal function test among diabetes mellitus patients attending Fenote Selam Hospital, West Gojam, Northwest Ethiopia: a cross sectional study. BMC Blood Disord. 2013;13(1):6. doi:10.1186/2052-1839-13-6
43. Fiseha T, Adamu A, Tesfaye M, Gebreweld A, Hirst JA. Prevalence of anemia in diabetic adult outpatients in Northeast Ethiopia. PLoS One. 2019;14(9):e0222111. doi:10.1371/journal.pone.0222111
44. Thambiah SC, Samsudin IN, George E, et al. Anaemia in type 2 diabetes mellitus (T2DM) patients in Hospital Putrajaya. MJMHS. 2015;11(1):49–61.
45. Nemeth E, Ganz T. Anemia of inflammation. Hematol Oncol Clin. 2014;28(4):671–681. doi:10.1016/j.hoc.2014.04.005
46. Adejumo BI, Dimkpa U, Ewenighi CO, et al. Incidence and risk of anemia in type-2 diabetic patients in the absence of renal impairment. Health. 2012;4(6):304–308. doi:10.4236/health.2012.46050
47. Ezenwaka C, Nwagbara E, Seales D, et al. A comparative study of the prevalence of the metabolic syndrome and its components in type 2 diabetic patients in two Caribbean islands using the new International Diabetes Federation definition. Arch Physiol Biochem. 2007;113(4–5):202–210. doi:10.1080/13813450701475201
48. Sowers JR, Epstein M. Diabetes mellitus and associated hypertension, vascular disease, and nephropathy: an update. Hypertension. 1995;26(6):869–879. doi:10.1161/01.HYP.26.6.869
49. Barazzoni R, Cappellari GG, Semolic A, et al. The association between hematological parameters and insulin resistance is modified by body mass index-results from the North-East Italy MoMa population study. PLoS One. 2014;9(7):e101590. doi:10.1371/journal.pone.0101590
50. Shrestha S, Gyawali P, Shrestha R, Poudel B, Sigdel M. Serum urea and creatinine in diabetic and non-diabetic subjects. JNAMELS. 2008;9(1):11–12.
 © 2020 The Author(s). This work is published and licensed by Dove Medical Press Limited. The
full terms of this license are available at https://www.dovepress.com/terms
and incorporate the Creative Commons Attribution
- Non Commercial (unported, 3.0) License.
By accessing the work you hereby accept the Terms. Non-commercial uses of the work are permitted
without any further permission from Dove Medical Press Limited, provided the work is properly
attributed. For permission for commercial use of this work, please see paragraphs 4.2 and 5 of our Terms.
© 2020 The Author(s). This work is published and licensed by Dove Medical Press Limited. The
full terms of this license are available at https://www.dovepress.com/terms
and incorporate the Creative Commons Attribution
- Non Commercial (unported, 3.0) License.
By accessing the work you hereby accept the Terms. Non-commercial uses of the work are permitted
without any further permission from Dove Medical Press Limited, provided the work is properly
attributed. For permission for commercial use of this work, please see paragraphs 4.2 and 5 of our Terms.