Back to Journals » Cancer Management and Research » Volume 10
Recurrence and prognostic model for identifying patients at risk for esophageal cancer after surgery
Authors Chen D, Wang W, Chen Y, Hu J, Yang M ![]() , Mo J, Wen Z
, Mo J, Wen Z ![]()
Received 2 September 2018
Accepted for publication 10 October 2018
Published 21 November 2018 Volume 2018:10 Pages 6109—6120
DOI https://doi.org/10.2147/CMAR.S186194
Checked for plagiarism Yes
Review by Single anonymous peer review
Peer reviewer comments 2
Editor who approved publication: Dr Xueqiong Zhu
Dongni Chen,1,* Weidong Wang,1,* Youfang Chen,1 Jia Hu,1 Men Yang,2 Junxian Mo,3 Zhesheng Wen1
1Department of Thoracic Oncology, State Key Laboratory of Oncology in South China, Collaborative Innovation Center for Cancer Medicine, Sun Yat-sen University Cancer Center, Guangzhou 510060, China; 2Department of Cardio-Thoracic Surgery, The Eighth Affiliated Hospital of Sun Yat-sen University, Shenzhen, Guangdong 518000, China; 3Department of Cardio-Thoracic Surgery, The Seventh Affiliated Hospital of Guangxi Medical University, Wuzhou, Guangxi 543000, China
*These authors contributed equally to this work
Objective: The aim of this study was to construct a risk model to assess overall survival (OS) and disease-free survival (DFS) in patients with esophageal cancer (EC) after surgery.
Patients and methods: A total of 872 consecutive EC patients who had undergone surgery between February 2009 and October 2012 were retrospectively analyzed. The cutoff for risk value (RV) was inferred by receiver operating characteristic curves and the Youden index. A log-rank test was used to compare the survival curves, and a Cox regression analysis was performed to clarify the significant prognostic factors.
Results: The area under the curve was 0.688 for OS and 0.645 for DFS. The survival rates were 69.4% (259/373) and 39.1% (195/499), and the rates of recurrence were 19.2% (70/364) and 27.6% (132/479), respectively, for RV<0.218 and RV≥0.218 (Χ2=78.83, P<0.001; Χ2=9.07, P=0.003; respectively). A multivariate Cox regression analysis identified cases suffering from higher overall mortalities with RV≥0.218 compared to RV<0.218 (HR=1.45; 95% CI, 1.21–2.02; P=0.015); similar results were also found for DFS (HR=1.38; 95% CI, 1.03–1.86; P=0.033). Kaplan–Meier survival curves showed that cases with RV<0.218 had better OS and DFS than cases with RV≥0.218 (log rank = 75.80, P<0.001; log rank = 24.78, P<0.001).
Conclusion: This model could be applied to an integrated assessment of recurrence and prognostic risk after the surgical treatment of EC.
Keywords: esophageal cancer, surgery, recurrence, prognosis, model
Introduction
Esophageal cancer (EC) is the eighth most common malignancy in the world; the incidence of EC is rapidly increasing,1 and it is associated with an overall 5-year survival rate of 15%–25%.1,2 Treatment options for EC include surgery, chemotherapy, and radiation, which are dependent on tumor site, histopathologic type, tumor staging, and medical comorbidities. Surgery seems to be the most appropriate therapy for early-stage patients with a 5-year survival rate of 34%–36% after radical resection.3 However, despite comprehensive preoperative assessments to select patients for potentially curative surgery, many patients with advanced EC present with tumor recurrence within 2 years after surgical treatment, and 5-year survival rates remain low.4,5 Therefore, it is essential to build a reliable model that can predict the risk of recurrence and outcomes in patients to accurately tailor their therapy. Determination of a prognosis in patients suffering from EC is still primarily performed by using postoperative pathological features and is based on the TNM staging system. The accuracy of the current TNM staging system has been questioned because of issues such as stage migration.6,7 Many studies have reported the impact on the survival of patients with EC of assessing the number of metastatic lymph nodes (LNs) or the ratio between metastatic LNs and the total removed LNs.8–10 A previous study proposed a new prognostic tool, the LN ratio (LNR), which is the ratio of the number of metastatic LNs to the total number of examined LNs. This ratio reflects the degree of LN metastasis and may help resolve stage migration. Tan et al claimed that LNR is an independent prognostic factor after tri-incisional esophagectomy and has more potential for predicting patient outcomes.6 However, few studies have considered the effect of reasonable recurrence and prognostic models for evaluating the risk value (RV) for esophageal carcinoma due to the different sample sizes, different inclusion criteria, and different statistical methods for determining a model.11 Therefore, this study aimed to construct a prognostic model using a single institutional surgical database in China to identify patients who may have a high risk of relapse or favorable prognosis; this model could be beneficial for choosing a more appropriate treatment.
Patients and methods
Construction of the model
There are four essential variables that have a major influence on postoperative overall survival (OS) and disease-free survival (DFS) for EC: the number of pathologically positive LNs (pN),12,13 the pT stage (T) value,13 the degree of tumor differentiation (G),13 and the number of resected LNs (N).14 Previous studies have demonstrated that a higher number of positive LNs, deeper tumor invasion, and poor differentiation are related to poor prognosis, whereas a large number of removed LNs usually leads to a higher OS rate.7 Consequently, we take (pN + T + G) as the numerator and N as the denominator, in accordance with which we calculate the RV as follows: RV = (pN + T + G)/N.
Study population and data collection
From February 2009 to October 2012, a total of 1,281 consecutive patients with esophageal squamous cell carcinoma (ESCC) underwent curative esophagectomy at Sun Yat-sen University Cancer Center. Patients included in this cohort study had preoperative biopsy or postoperative pathologically confirmed ESCC and were treated by primary esophagectomy. The exclusion criteria were as follows: 1) patients were excluded if tumors were located at the cervical esophagus or esophagogastric junction or had other histological subtypes of EC besides ESCC. 2) Patients with T4 disease or undergoing surgical exploration without esophagectomy were excluded. 3) Patients died because of surgery, and postoperative complications were excluded. 4) Patients with a history of concurrent malignant disease or other primary cancers were excluded. 5) Patients with deficient data or those who were lost to follow-up were also excluded. The final study population consisted of 872 patients. The data collected included patient demographics, tumor location, the number of examined LNs, length and depth of tumor invasion, the degree of tumor differentiation, surgical types, and preoperative and postoperative treatments. All the patients provided written informed consent, and the study was approved by the Ethics Committee of Sun Yat-sen University Cancer Center.
Surgical procedure and pathology of specimens
The initial evaluation included upper gastrointestinal (GI) barium swallow, computed tomography of the chest and upper abdomen, ultrasound of the cervical region, GI endoscopy, and tumor biopsy. Patients were considered for surgical resection if preoperative evaluation revealed no evidence of distant metastases, and there was no evidence of direct invasion of the trachea or major vascular structures. Pulmonary and cardiac functions were evaluated to assess medical operability. All patients had an ECOG performance status of 0–1. The surgical techniques for each procedure have been described elsewhere.6,15 In brief, the most common surgical procedures were the Sweet approach (467 patients), the Ivor–Lewis approach (53 patients), and the three-incision technique (352 patients). All resected specimens were submitted for pathological examination. The pathological tumor stage and LN involvement were identified according to the eighth edition of the International Union Against Cancer (UICC) and the American Joint Committee on Cancer (AJCC) TNM classification.13,16
Participant follow-up
Patients were recommended for follow-up examinations at our outpatient department every 3 months for the first 2 years, every 6 months during the next 3 years, and annually thereafter. Patients were subjected to the following follow-up examinations: history taking, physical examination, chest radiography, barium esophagography, GI endoscopy, cervical ultrasonography and thorax-abdomen computed tomographic scans. Follow-up of patients in the present study was performed until December 2016. The mean follow-up time was 44.65 months (range 1–93 months). Twenty percent of patients were lost to follow-up.
Statistical analysis
The endpoint of the study was OS. OS was calculated from the date of diagnosis to the date of any-cause death or the date of last follow-up. DFS was defined as the time from radical surgery (R0 resection) to the first local recurrence or distant metastasis of EC to avoid unrelated causes of death affecting survival. The RV cutoff was confirmed by the receiver operating characteristic (ROC) curve and Youden index. A chi-squared test was used to compare the categorical variables. ANOVA was used to compare the continuous variables. The survival curves were plotted by the Kaplan–Meier method, and the log-rank test was used to assess differences in survival between groups. Multivariate analysis with a Cox proportional hazards model was carried out to identify significant prognostic factors. All calculations were performed using SPSS 17.0 software (SPSS, Chicago, IL), and a P-value <0.05 was considered statistically significant. The Methods section has been reported in line with STROCSS guidelines.17
Results
Patient characteristics, OS, and DFS
A total of 872 cases fit the inclusion criteria and were included in the analysis. Male patients accounted for most of the cases (78.8%) in our series, with 687 male patients and 185 female patients. The median RV was 0.200 and 0.311 for survivals and deceased patients, respectively (Figure 1), and the median RV was 0.203 and 0.263 for patients with no relapse and with disease recurrence, respectively (Figure 2). The RV cutoff for both was 0.218, as inferred by the ROC curve and Youden index (Youden index = sensitivity + specificity – 1). In addition, the area under the curve was 0.688 for OS (95% CI 0.653–0.723; P<0.001; Figure 3) and 0.645 for DFS (95% CI 0.582–0.708; P<0.001; Figure 4). To determine the prognostic and recurring impact of RV, patients were divided into two groups based on the RV cutoff. This resulted in the following distribution: 373 patients in group 1 (RV <0.218) and 499 patients in group 2 (RV ≥0.218).
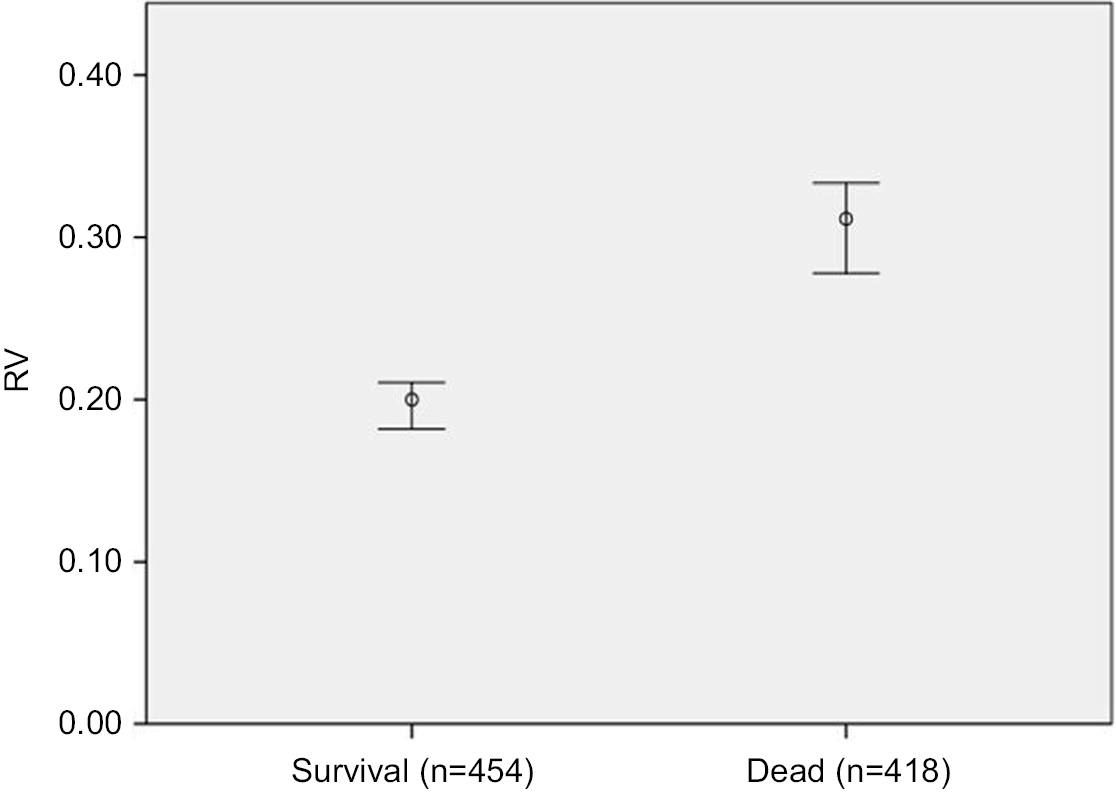 | Figure 1 RV bar plot for survival and dead. Notes: The median RV was 0.200 and 0.311 for survivals and deceased patients, respectively. Abbreviation: RV, risk value. |
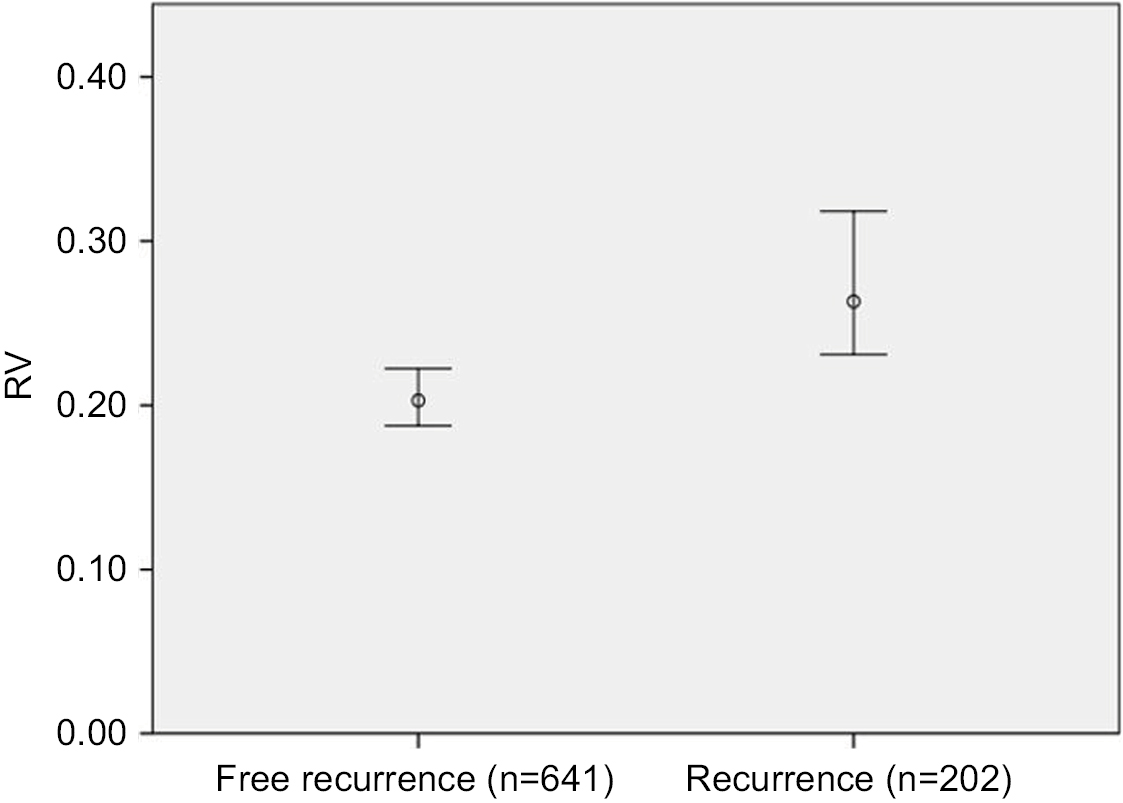 | Figure 2 RV bar plot for free recurrence and recurrence. Notes: The median RV was 0.203 and 0.263 for patients with no relapse and with disease recurrence, respectively. Abbreviation: RV, risk value. |
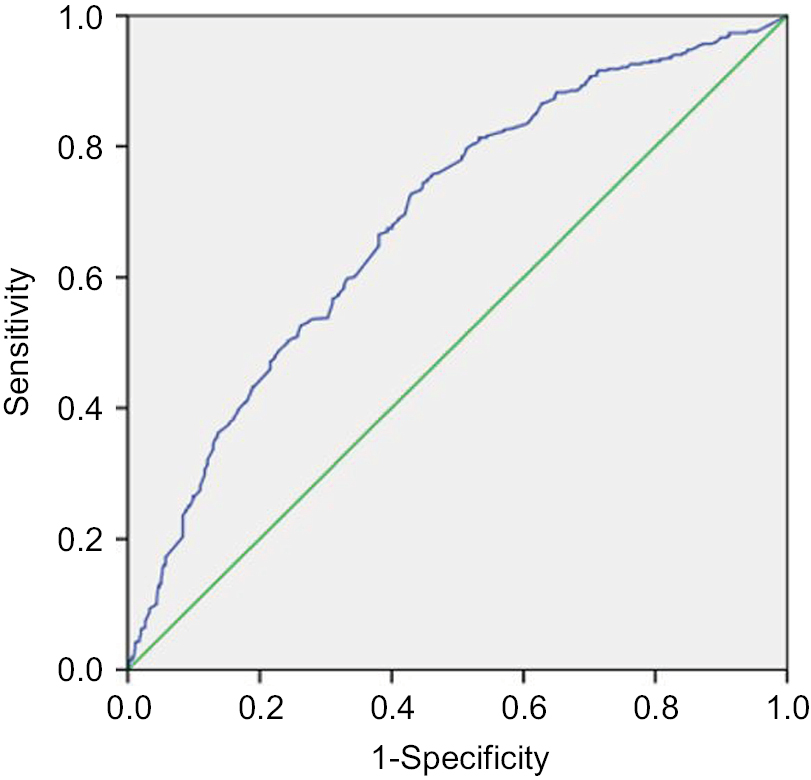 | Figure 3 ROCs were employed to assess the RV discriminative performance of the prognosis. Notes: The AUC was 0.688 for OS (95% CI 0.653–0.723; P<0.001). Abbreviations: AUC, area under the curve; OS, overall survival; ROC, receiver operating characteristic; RV, risk value. |
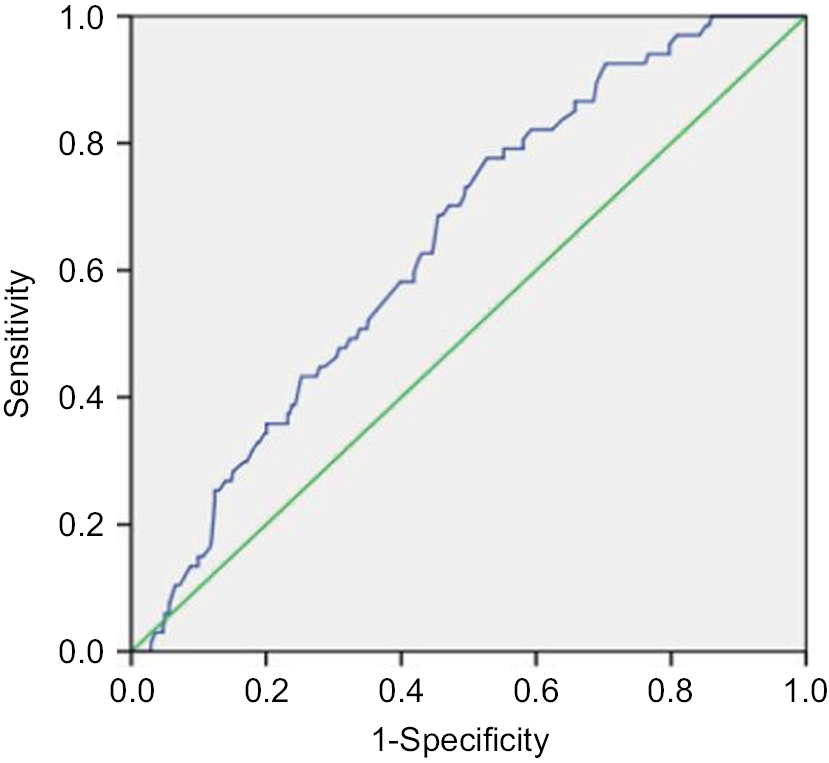 | Figure 4 ROCs were employed to assess the RV discriminative performance of the prognosis. Notes: AUC was 0.645 for DFS (95% CI 0.582–0.708; P<0.001). Abbreviations: AUC, area under the curve; DFS, disease-free survival; ROC, receiver operating characteristic; RV, risk value. |
The relationship between patient demographics and the RV cutoff is summarized in Table 1. The clinical and pathological factors were compared between the two groups. Overall, the RV cutoff was significantly associated with the number of resected LNs, pathological type, TNM stage, number of positive nodes, grade of differentiation, T (tumor) stage, surgical approach, preoperative or postoperative chemoradiation therapy (CRT), and complications (all P<0.05). However, there were no significant differences regarding the distribution of age, sex, tumor location, margin status, clinical staging18 on endoscopic ultrasonography, and tumor length between patients in the two groups according to the RV cutoff (all P>0.05). At the time of this analysis, the median OS was 58.1 months (95% CI 55.6–60.6 months) and the median DFS was 43.4 months (95% CI 41.6–45.2 months). The overall 1-, 3-, and 5-year OS rates were 86.0%, 60.0%, and 33.7%, respectively. The 1-, 3-, and 5-year DFS rates after radical surgery were 83.3%, 57.7%, and 32.2%, respectively, for all patients. The mortality rates were 30.6% (114/373) and 60.9% (304/499), and the rates of recurrence were 19.2% (70/364) and 27.6% (132/479), respectively, for RV<0.218 and RV≥0.218 (χ2=78.83, P<0.001; χ2=7.87, P=0.005; respectively) (Table 2). The 1-, 3-, and 5-year OS rates for EC after radical surgery were 92.2%, 73.5%, and 43.4%, respectively, for RV<0.218, whereas the OS rates were 81.4%, 50.0%, and 25.7%, respectively, for RV≥0.218. The 1-, 3-, and 5-year DFS rates for EC after radical surgery were 85.3%, 71.6%, and 42.4%, respectively, for RV <0.218, but 77.9%, 47.3%, and 24.7%, respectively, for RV ≥0.218.
 | Table 1 Baseline characteristics of patients stratified for the cut off of RV Notes: Data are mean ± SD or n (%).The clinical and pathological factors were compared between the two groups (373 patients in group 1 [RV<0.218], and 499 patients in group 2 [RV≥0.218]). The RV cutoff was significantly associated with the number of resected LNs, pathological type, TNM stage, number of positive nodes, grade of differentiation, T (tumor) stage, surgical approach, preoperative or postoperative CRT, and complications (all P<0.05). Abbreviations: CRT, chemoradiation therapy; EUS, endoscopic ultrasonography; G0, after neoadjuvant CRT and no residual carcinoma; G1, well differentiated; G2, moderately differentiated; G3, poorly differentiated; LN, lymph node; RV, risk value; SCC, squamous cell carcinoma. |
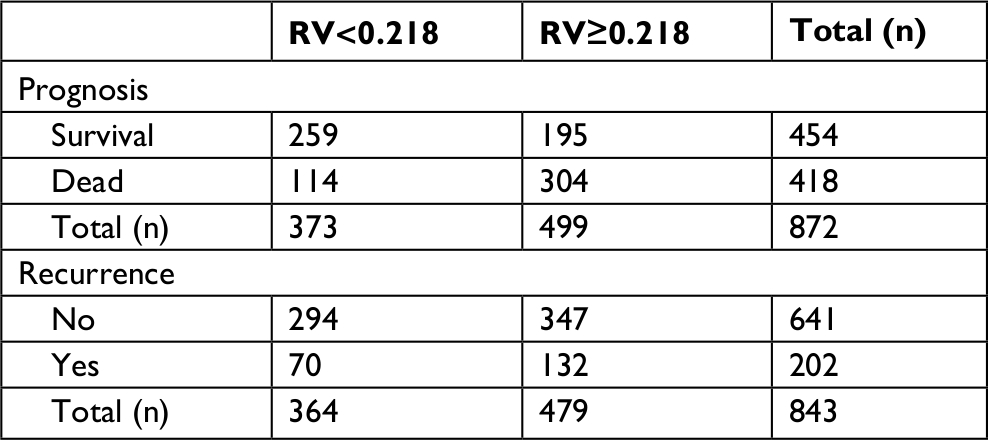 | Table 2 Comparison of the prognosis and recurrence for patients of RV<0.218 with RV≥0.218 Notes: The overall 1-, 3-, and 5-year OS and DFS rates for RV<0.218 and RV≥0.218 were summarized in Table 2. Abbreviations: DFS, disease-free survival; OS, overall survival; RV, risk value. |
RV and patient survival and recurrence
During the follow-up period, there were a total of 202 patients with recurrence and 418 overall death among the 782 patients. We performed Cox regression analysis to evaluate whether the RV was associated with survival and relapse after adjusting for potential confounders. The variables tested in the univariate analysis showed that the factors significantly associated with OS were RV, sex, age, the number of removed LNs, N stage, T3 tumor stage, moderate or poor differentiation, recurrence, and postoperative CRT (Table S1). After incorporating significant covariates, multivariate Cox regression analysis identified cases suffering from higher overall mortalities with RV≥0.218 compared to RV <0.218 (HR =1.45; 95% CI 1.21–2.02; P=0.015). In addition, the following variables were independent factors in poor survival: older age, N metastasis, and tumor recurrence. In contrast, postoperative CRT was a protective prognostic factor for better OS (HR =0.80; 95% CI 0.71–0.93; P=0.037) (Table 3). Similarly, the variables included in the univariate analysis showed that sex, RV, positive LN count (LNC), and postoperative CRT were significantly related to DFS. Then, multivariate analysis showed that RV≥0.218 compared to RV<0.218 (HR=1.38; 95% CI 1.03–1.86; P=0.033) and positive LN status of N2 and N3 were independent negative factors for DFS, while postoperative CRT presented as an independent protective factor for DFS (HR=0.20; 95% CI 0.14–0.28; P<0.001) (Table 3). According to the Kaplan–Meier survival curves, cases with RV<0.218 had better OS and DFS than cases with RV≥0.218 (log rank =75.80, P<0.001; log rank =24.78, P<0.001; Figures 5 and 6).
 | Table 3 Multivariate cox regression analysis of prognostic factors influencing OS and DFS Notes: Multivariable cox regression indicated that RV was an independent risk predictor of OS and DFS. Abbreviations: CRT, chemoradiation therapy; DFS, disease-free survival; LN, lymph node; OS, overall survival; RV, risk value. |
 | Figure 5 OS in the cohort grouped by the cutoff of RV. Notes: Patients with RV<0.218 had better OS compared with RV≥0.218 (log rank =75.80, P<0.001). Abbreviations: OS, overall survival; RV, risk value. |
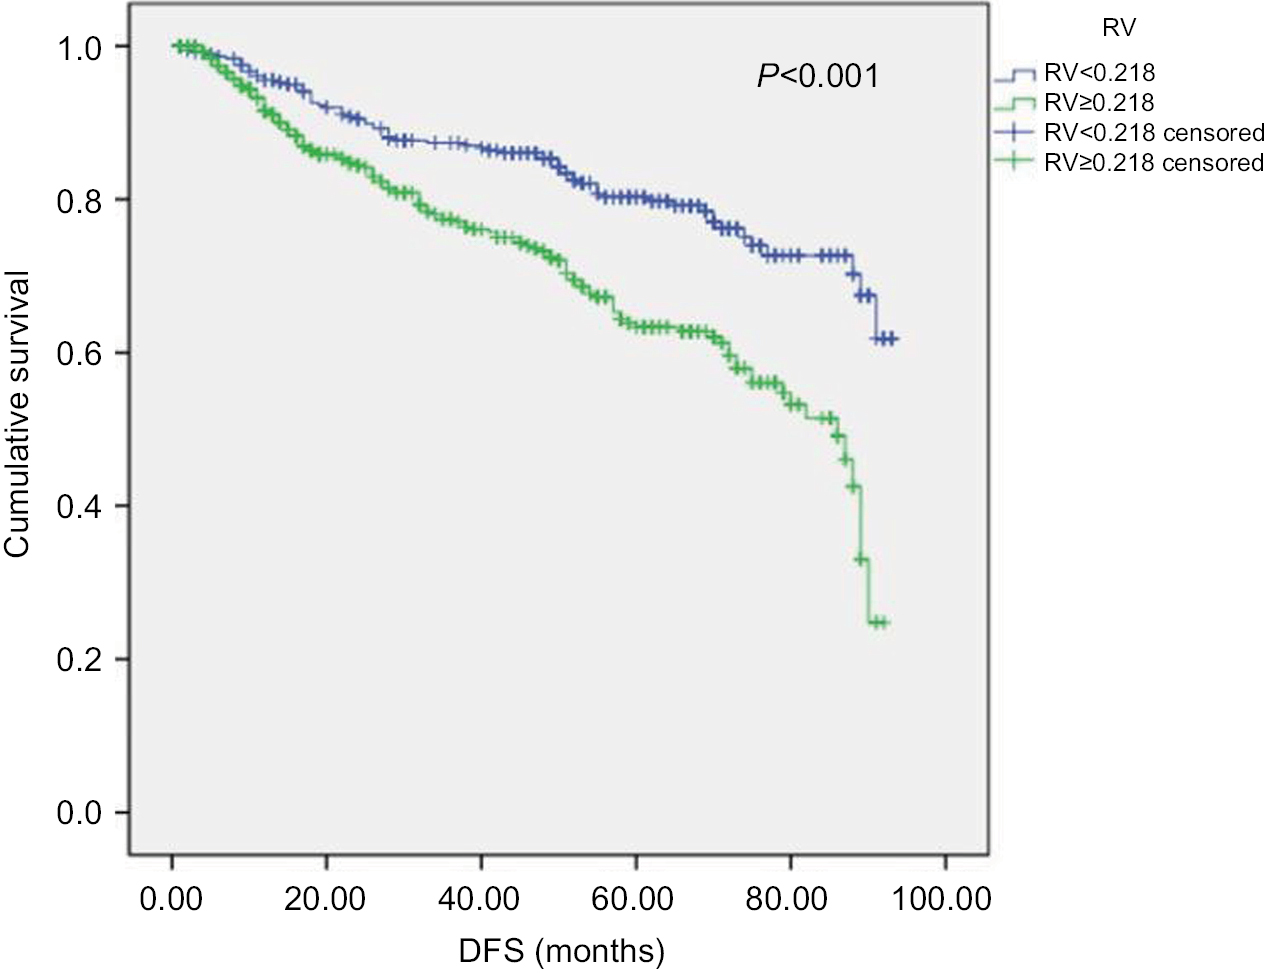 | Figure 6 DFS in the cohort grouped by the cutoff of RV. Notes: Patients with RV<0.218 had better DFS compared with RV≥0.218 (log rank =24.78, P<0.001). Abbreviations: DFS, disease-free survival; RV, risk value. |
Relationship and comparison between TNM and RV in predicting prognosis
The relationship between TNM and RV in predicting a prognosis for EC after surgery is presented in Table 4. In TNM stages 2, 3, and 4, patients with RV≥0.218 had a worse prognosis than those with RV<0.218. A total of 139, 220, and 41 cases died in stages 2, 3, and 4, of which 106 (76.3%), 154 (70.0%), and 40 (97.6%) cases, respectively, had RV≥0.218. Twenty-eight (71.8%) patients (RV<0.218) showed a favorable prognosis among 39 patients in stage 0. Analysis of stage 1 (n=22) subgroups was omitted because the number was too small. The comparison in the prediction of prognosis between RV and TNM stage was further analyzed. As the ROC analysis showed, RV performed better in predicting patient’s outcome than TNM stage. The AUC was 0.544 for OS (95% CI 0.506–0.582; P=0.025) and 0.532 for DFS (95% CI 0.458–0.605; P=0.405) in TNM classification (Figure 7).
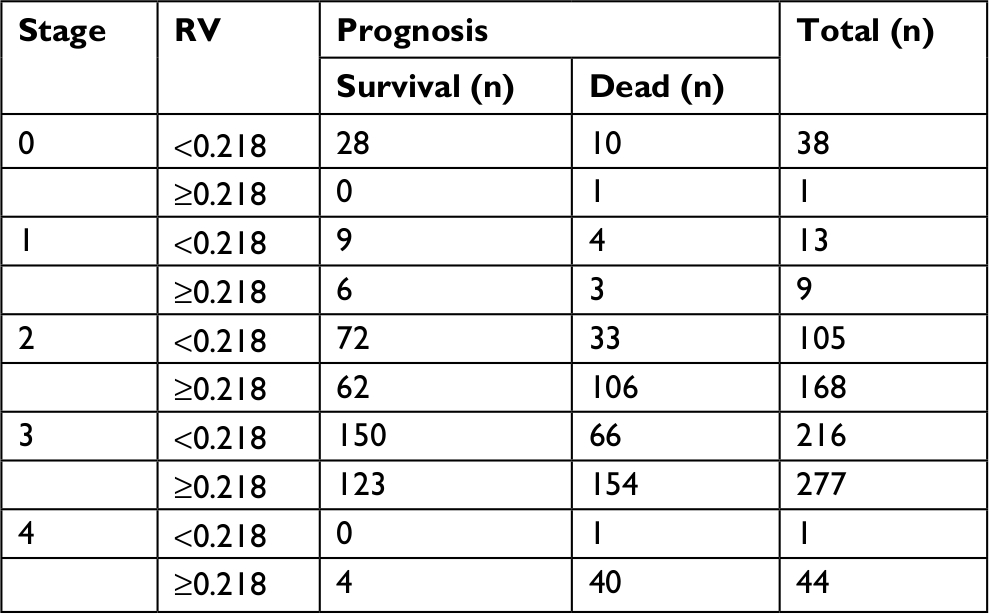 | Table 4 Relationship between TNM and RV in predicting prognosis Abbreviation: RV, risk value. |
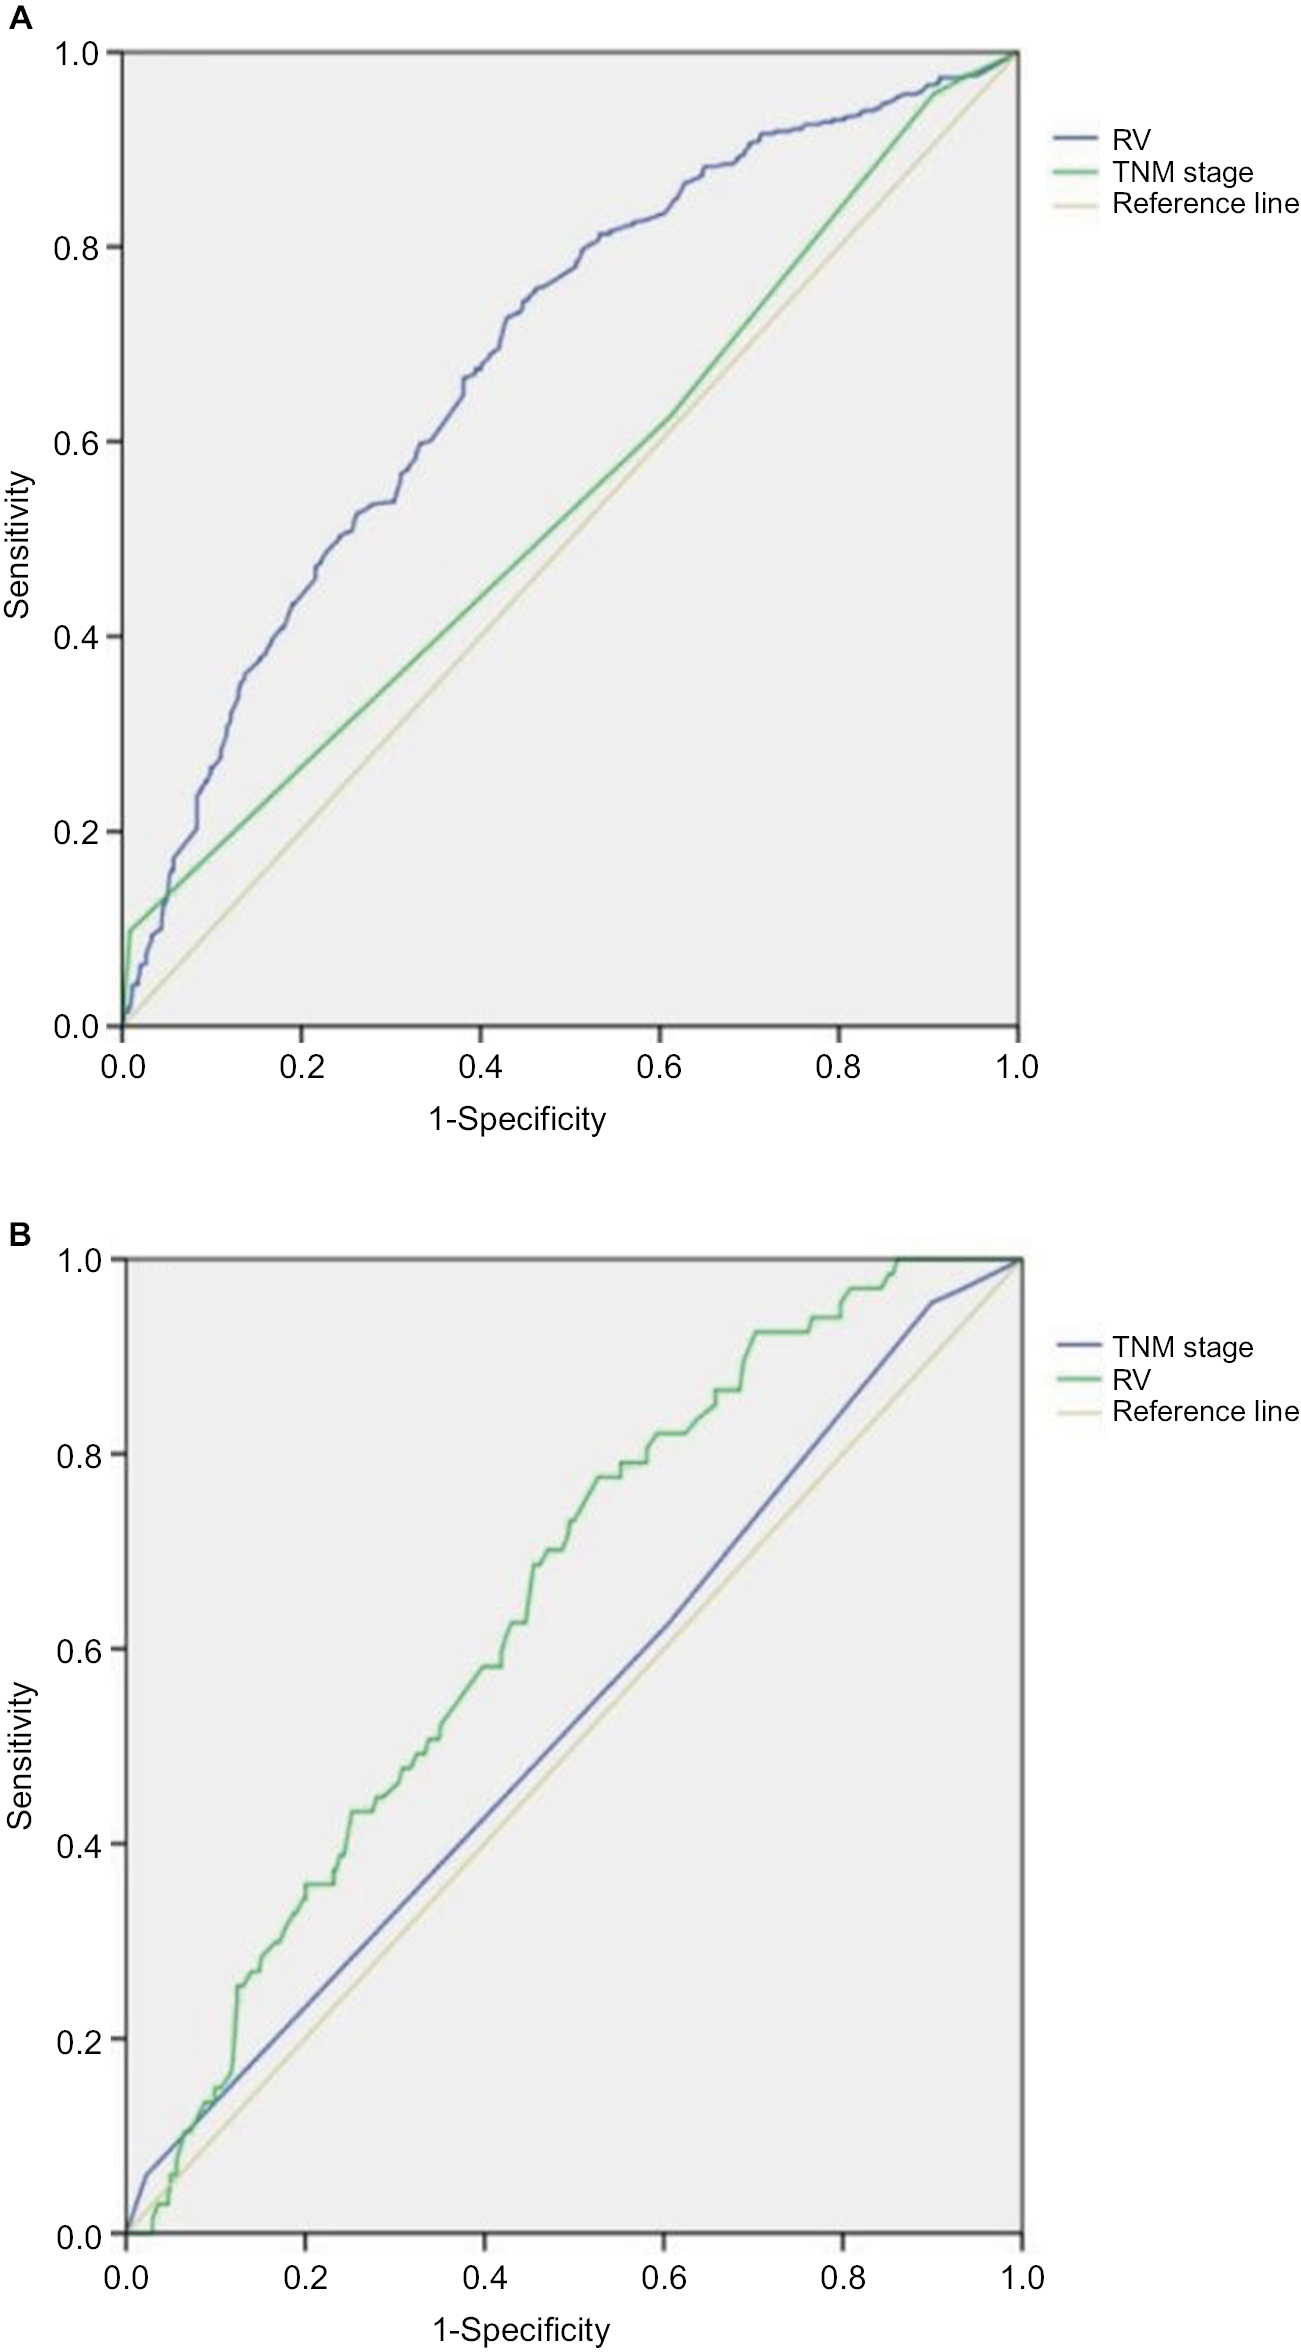 | Figure 7 ROCs were employed to compare the performance in predicting OS and DFS between RV and TNM stage. Notes: (A) AUC was 0.544 (95% CI 0.506–0.582; P=0.025) for OS in TNM stage compared with RV (AUC =0.688). (B) AUC was 0.532 (95% CI 0.458–0.605; P=0.405) for DFS in TNM stage compared with RV (AUC =0.645). Abbreviations: AUC, area under the curve; DFS, disease-free survival; OS, overall survival; ROC, receiver operating characteristic curve; RV, risk value. |
Discussion
Many previous studies have used multicenter databases, such as the Surveillance, Epidemiology and End Results (SEER) cancer registry.7,19–21 We believe that a retrospective study using a database from a single institute may produce more homogenous results than a multicenter database, considering that the surgical practices in a single institute are more likely to be uniform. This cohort study using postoperative pathological characteristics from our cancer center constructed a simple risk model that could aid risk prediction for EC.
The prognosis for patients with EC undergoing surgery remains unsatisfactory. Previous evidence has found that there is a high frequency of recurrence within 1 year after surgery,22–24 and the probability of surviving 3 years is less than 5% after salvage therapy.25 Thus, stratifying patients with a high risk of poor prognosis is important. However, there was no method to accurately stage patients before definitive therapy, and this lack limited the precise management of EC. Preoperative imaging cannot be used to accurately stage EC, and even preoperative ultrasound gastroscopy is rarely sufficient for the determination of tumor invasion and LN metastases. Therefore, our model used postoperative markers to guarantee predictive power and accuracy in identifying the risk of recurrence and poor prognosis after radical surgery for EC.
It is well recognized that a finding of metastatic nodes after esophageal resection has an adverse effect on survival, whereas our study also stressed that estimating positive LNCs is not sufficient for stratifying patient outcomes. As reported, the number of negative lymph nodes is an important indicator of the accuracy of staging.26 Twine et al claimed that the total LNC has emerged as a significant factor influencing the assessment of prognosis in patients diagnosed with EC. Therefore, they proposed that the TNM staging system should not only be based on the LNR or the number of LN metastases but should also require a minimum LNC (which they suggested should be at least 10).10 A study conducted by Bogoevski et al examined whether the number of nodes resected should be higher. They suggested that a minimum of 18 nodes should be examined to allow accurate staging.27 In addition, histologic grade has been reported to be a significant prognostic factor for patients with EC.28 As previously reported, a poor differentiation grade was associated with a decreased chance of achieving a pathologically complete response in patients with EC who are receiving neoadjuvant chemoradiotherapy.29 Accordingly, the risk model in our study included histologic grade, number of positive LNs, and number of LNs resected, which could reflect the interaction effect among differentiation, the total removed LN number and pT stage in operative patients with EC, especially for cases in which all LNs were negative (N0).
We inferred that the RV cutoff was 0.218 by ROC curve and Youden index (Figures 3 and 4). The current study indicated that patients suffered a higher risk of recurrence and poor outcomes with RV≥0.218 (Figures 5 and 6). In addition, Cox regression indicated that RV was an independent risk predictor of OS and DFS, and potential cases could be recommended for further adjuvant treatment (Table 3). We also described the relationship between TNM stage and RV in predicting outcomes (Table 4). In TNM stages 2, 3, and 4, patients with RV≥0.218 had a worse prognosis than those with RV<0.218. Mortality rates of cases (RV≥0.218) in stages 2, 3, and 4 were 76.3%, 70.0%, and 97.6%, respectively. The finding was consistent with previous studies that patients with pathologically positive LN, especially patients with locally advanced disease, should receive postoperative adjuvant therapy.2,30,31 Therefore, this model would be valuable in clinical practice to estimate the prognosis for individual patients, and this estimation is essential for customized treatment.
As we can see, RV primarily depends on the number of retrieved LNs and the number of pathologically positive LNs, which would indicate that a higher number of resected LNs means there is a greater possibility of finding positive LNs. A favorable prognosis is obtained from optimal lymphadenectomy compared with partial resection for patients with the same number of metastatic LNs because RV decreases with optimal lymphadenectomy. This suggests that RV not only reflects tumor staging but also considers the extent of LN dissection. However, the extent of LN resection remains controversial, and some studies have reported similar outcomes after minimal resection compared with extensive dissections.32 In our study, univariate Cox regression analysis showed that the number of removed LNs was significantly associated with OS (P=0.013) (Table S1). However, the statistically significant association was not observed between the number of resected LNs and OS in the further multivariable analysis (P=0.096) (Table 3), suggesting the harvested LN was not an independent risk factor for OS. In our opinion, if the number of LNs examined is inappropriate, downstaging of patients will manifest in pN staging because the prognostic efficacy is greatly affected by the number of examined LNs. When the number of LNs resected and examined is insufficient, potentially metastatic LNs may be neglected, resulting in a stage migration phenomenon because of inappropriate UICC/AJCC staging and overestimating patient outcomes.33 A higher LNC may contribute to reduced stage migration and favorably influence survival. Altorki et al previously demonstrated that the total number of resected nodes is a significant determinant of survival in node-positive patients treated with surgery alone.7 As reported, compared to patients with resected LNs ≤6, the HR for death was significantly reduced to 0.51 when 17–25 LNs were resected and 0.39 when 26–40 nodes were retrieved. Extended lymphadenectomy may be essential even after neoadjuvant therapy because in most patients, preoperative treatment does not reliably eliminate nodal disease.34 However, for patients with early or localized disease, LN dissection should be as optimal as possible to manifest low RV, without increasing the incidence of postoperative complications. However, for patients with advanced tumors, multidisciplinary therapy should be stressed because surgery alone with excessive lymphadenectomy may result in improperly low RV, which might increase the risk of postoperative complications and be no help to survival. Moreover, in terms of a fixed count of positive LNs, excessive LN dissection will subjectively reduce RV, and patient prognosis will be overestimated. Therefore, T stage and degree of differentiation were included in our risk model to reconcile the interplay between pN and N.
The current study showed the RV performed better in the prediction of patient’s outcome than TNM stage (Figure 7). We hypothesize that the model was consisted of not only the number of positive LNs but also the number of resected LNs, which takes into consideration the false-negative due to the de-normalized lymphadenectomy. Therefore, the designed risk model can easily be used in clinical practice to predict survival more accurately than can the conventional TNM staging system. It is clinically helpful to provide more credible prognostic factors for individual patients. Moreover, it might help to establish follow-up schedules with precise adjuvant treatment strategies. Nevertheless, the current risk model estimates relapse and prognosis postoperatively in patients who undergo potentially radical surgery. The model is based on pathological findings in the resected specimen and therefore cannot be used preoperatively. It is essential to develop new preoperative prognostic models for improved preoperative prognostication to assess patients who will not sufficiently benefit from surgery.
The current study also analyzed clinical factors that may be associated with prolonged DFS and OS. The number of involved LNs, postoperative therapy, and tumor recurrence emerged from the Cox regression models as independent predictors of OS, and only classification of N2 and adjuvant therapy followed by surgery presented as independent predictors of DFS. A recent report by Yang et al found that neoadjuvant chemoradiotherapy plus surgery improves survival over surgery alone among patients with locally advanced ESCC.35 However, the protective effect of neoadjuvant therapy on OS and DFS was not suggested in our study, probably because of the small number of patients who received preoperative treatment (94/872). Future studies need to be performed to explore the efficacy of the model in a greater amount of patient with preoperative treatment.
Given the retrospective nature of this single-institution study, selection bias is inherent in our study population, and we were unable to determine the exact number of resected LNs. In addition, cervical lymphadenectomy was not systematically undertaken in our series. All of these issues may lead to improper staging. Therefore, to collect an appropriate number of LNs for accurate staging, we suggest that surgeons should prioritize the dissection and labeling of LNs embedded in the en bloc specimen before sending them for pathological diagnosis. Moreover, adjuvant chemotherapies and radiotherapies were variably administered, which may affect patient outcomes differently. In addition, other potential prognostic inflammatory markers, such as C-reactive protein and cytokines, were not available due to limited data, which may add additional prognostic value to the model.
In conclusion, we constructed a risk model for RV≥0.218 that may be a simple and useful tool for the evaluation of DFS and OS after surgery for EC. Moreover, our model might help to offer patients with a high risk of recurrence and poor prognosis precise adjuvant treatment strategies. Prospective validation is warranted to confirm these results.
Acknowledgments
We would like to extend our deepest gratitude to our mentor Dr Zhesheng Wen, a respected and responsible scholar, who has provided us with valuable guidance at every stage of the writing of this paper.
Disclosure
The authors report no conflicts of interest in this work.
References
Domper Arnal MJ, Ferrández Arenas Á, Lanas Arbeloa Á. Esophageal cancer: risk factors, screening and endoscopic treatment in Western and Eastern countries. World J Gastroenterol. 2015;21(26):7933–7943. | ||
Schreiber D, Rineer J, Vongtama D, et al. Impact of postoperative radiation after esophagectomy for esophageal cancer. J Thorac Oncol. 2010;5(2):244–250. | ||
Omloo JM, Lagarde SM, Hulscher JB, et al. Extended transthoracic resection compared with limited transhiatal resection for adenocarcinoma of the mid/distal esophagus: five-year survival of a randomized clinical trial. Ann Surg. 2007;246(6):992–1000. | ||
Mariette C, Balon JM, Piessen G, Fabre S, van Seuningen I, Triboulet JP. Pattern of recurrence following complete resection of esophageal carcinoma and factors predictive of recurrent disease. Cancer. 2003;97(7):1616–1623. | ||
Rüdiger Siewert J, Feith M, Werner M, Stein HJ. Adenocarcinoma of the esophagogastric junction: results of surgical therapy based on anatomical/topographic classification in 1,002 consecutive patients. Ann Surg. 2000;232(3):9. | ||
Tan Z, Ma G, Yang H, Zhang L, Rong T, Lin P. Can lymph node ratio replace pN categories in the tumor-node-metastasis classification system for esophageal cancer? J Thorac Oncol. 2014;9(8):1214–1221. | ||
Altorki NK, Zhou XK, Stiles B, et al. Total number of resected lymph nodes predicts survival in esophageal cancer. Ann Surg. 2008;248(2):221–226. | ||
Hsu PK, Huang CS, Wang BY, Wu YC, Chou TY, Hsu WH. The prognostic value of the number of negative lymph nodes in esophageal cancer patients after transthoracic resection. Ann Thorac Surg. 2013;96(3):995–1001. | ||
Wu SG, Li FY, Zhou J, et al. Prognostic value of different lymph node staging methods in esophageal squamous cell carcinoma after esophagectomy. Ann Thorac Surg. 2015;99(1):284–290. | ||
Twine CP, Lewis WG, Morgan MA, et al. The assessment of prognosis of surgically resected oesophageal cancer is dependent on the number of lymph nodes examined pathologically. Histopathology. 2009;55(1):46–52. | ||
Lu J, Tao H, Song D, Chen C. Recurrence risk model for esophageal cancer after radical surgery. Chin J Cancer Res. 2013;25(5):549–555. | ||
Peyre CG, Hagen JA, Demeester SR, et al. Predicting systemic disease in patients with esophageal cancer after esophagectomy: a multinational study on the significance of the number of involved lymph nodes. Ann Surg. 2008;248(6):979–985. | ||
Rice TW, Ishwaran H, Hofstetter WL, et al. Recommendations for pathologic staging (pTNM) of cancer of the esophagus and esophagogastric junction for the 8th edition AJCC/UICC staging manuals. Dis Esophagus. 2016;29(8):897–905. | ||
Smith DD, Schwarz RR, Schwarz RE. Impact of total lymph node count on staging and survival after gastrectomy for gastric cancer: data from a large US-population database. J Clin Oncol. 2005;23(28):7114–7124. | ||
Li B, Xiang J, Zhang Y, et al. Comparison of Ivor-Lewis vs sweet esophagectomy for esophageal squamous cell carcinoma: a randomized clinical trial. JAMA Surg. 2015;150(4):292–298. | ||
Rice TW, Ishwaran H, Kelsen DP, et al. Recommendations for neoadjuvant pathologic staging (ypTNM) of cancer of the esophagus and esophagogastric junction for the 8th edition AJCC/UICC staging manuals. Dis Esophagus. 2016;29(8):906–912. | ||
Agha RA, Borrelli MR, Vella-Baldacchino M, Thavayogan R, Orgill DP, STROCSS Group. The STROCSS statement: strengthening the reporting of cohort studies in surgery. Int J Surg. 2017;46:198–202. | ||
Rice TW, Ishwaran H, Ferguson MK, Blackstone EH, Goldstraw P. Cancer of the esophagus and esophagogastric junction: an eighth edition staging primer. J Thorac Oncol. 2017;12(1):36–42. | ||
Bollschweiler E, Baldus SE, Schröder W, Schneider PM, Hölscher AH. Staging of esophageal carcinoma: length of tumor and number of involved regional lymph nodes. Are these independent prognostic factors? J Surg Oncol. 2006;94(5):355–363. | ||
Greenstein AJ, Litle VR, Swanson SJ, Divino CM, Packer S, Wisnivesky JP. Effect of the number of lymph nodes sampled on postoperative survival of lymph node-negative esophageal cancer. Cancer. 2008;112(6):1239–1246. | ||
Peyre CG, Hagen JA, Demeester SR, et al. The number of lymph nodes removed predicts survival in esophageal cancer: an international study on the impact of extent of surgical resection. Ann Surg. 2008;248(4):190–197. | ||
Li H, Zhang Y, Cai H, Xiang J. Pattern of lymph node metastases in patients with squamous cell carcinoma of the thoracic esophagus who underwent three-field lymphadenectomy. Eur Surg Res. 2007;39(1):1–6. | ||
Chen J, Liu S, Pan J, et al. The pattern and prevalence of lymphatic spread in thoracic oesophageal squamous cell carcinoma. Eur J Cardiothorac Surg. 2009;36(3):480–486. | ||
Chen G, Wang Z, Liu XY, Liu FY. Recurrence pattern of squamous cell carcinoma in the middle thoracic esophagus after modified Ivor-Lewis esophagectomy. World J Surg. 2007;31(5):1108–1115. | ||
Lu JC, Kong C, Tao H. Radiotherapy with or without concurrent chemotherapy for lymph node recurrence after radical surgery of thoracic esophageal squamous cell carcinoma. Int J Radiat Oncol Biol Phys. 2010;78(3):710–714. | ||
Zhu Z, Chen H, Yu W, et al. Number of negative lymph nodes is associated with survival in thoracic esophageal squamous cell carcinoma patients undergoing three-field lymphadenectomy. Ann Surg Oncol. 2014;21(9):2857–2863. | ||
Bogoevski D, Onken F, Koenig A, et al. Is it time for a new TNM classification in esophageal carcinoma? Ann Surg. 2008;247(4):633–641. | ||
Rice TW, Rusch VW, Ishwaran H, Blackstone EH, Worldwide Esophageal Cancer Collaboration. Cancer of the esophagus and esophagogastric junction: data-driven staging for the seventh edition of the American Joint Committee on Cancer/International Union Against Cancer Cancer Staging Manuals. Cancer. 2010;116(16):3763–3773. | ||
Ajani JA, Correa AM, Hofstetter WL, et al. Clinical parameters model for predicting pathologic complete response following preoperative chemoradiation in patients with esophageal cancer. Ann Oncol. 2012;23(10):2638–2642. | ||
Burmeister BH, Smithers BM, Gebski V, et al. Surgery alone versus chemoradiotherapy followed by surgery for resectable cancer of the oesophagus: a randomised controlled phase III trial. Lancet Oncol. 2005;6(9):659–668. | ||
Tepper J, Krasna MJ, Niedzwiecki D, et al. Phase III trial of trimodality therapy with cisplatin, fluorouracil, radiotherapy, and surgery compared with surgery alone for esophageal cancer: CALGB 9781. J Clin Oncol. 2008;26(7):1086–1092. | ||
Stein HJ, von Rahden BH, Siewert JR. Survival after oesophagectomy for cancer of the oesophagus. Langenbecks Arch Surg. 2005;390(4):280–285. | ||
Sun Z, Zhu GL, Lu C, et al. The impact of N-ratio in minimizing stage migration phenomenon in gastric cancer patients with insufficient number or level of lymph node retrieved: results from a Chinese mono-institutional study in 2159 patients. Ann Oncol. 2009;20(5):897–905. | ||
Prenzel KL, König A, Schneider PM, et al. Reduced incidence of nodal micrometastasis after major response to neoadjuvant chemoradiation in locally advanced esophageal cancer. Ann Surg Oncol. 2007;14(2):954–959. | ||
Yang H, Liu H, Chen Y, et al. Neoadjuvant Chemoradiotherapy Followed by Surgery Versus Surgery Alone for Locally Advanced Squamous Cell Carcinoma of the Esophagus (NEOCRTEC5010): a Phase III multicenter, randomized, open-label clinical trial. J Clin Oncol. 2018;36(27):2796–2803. |
Supplementary material
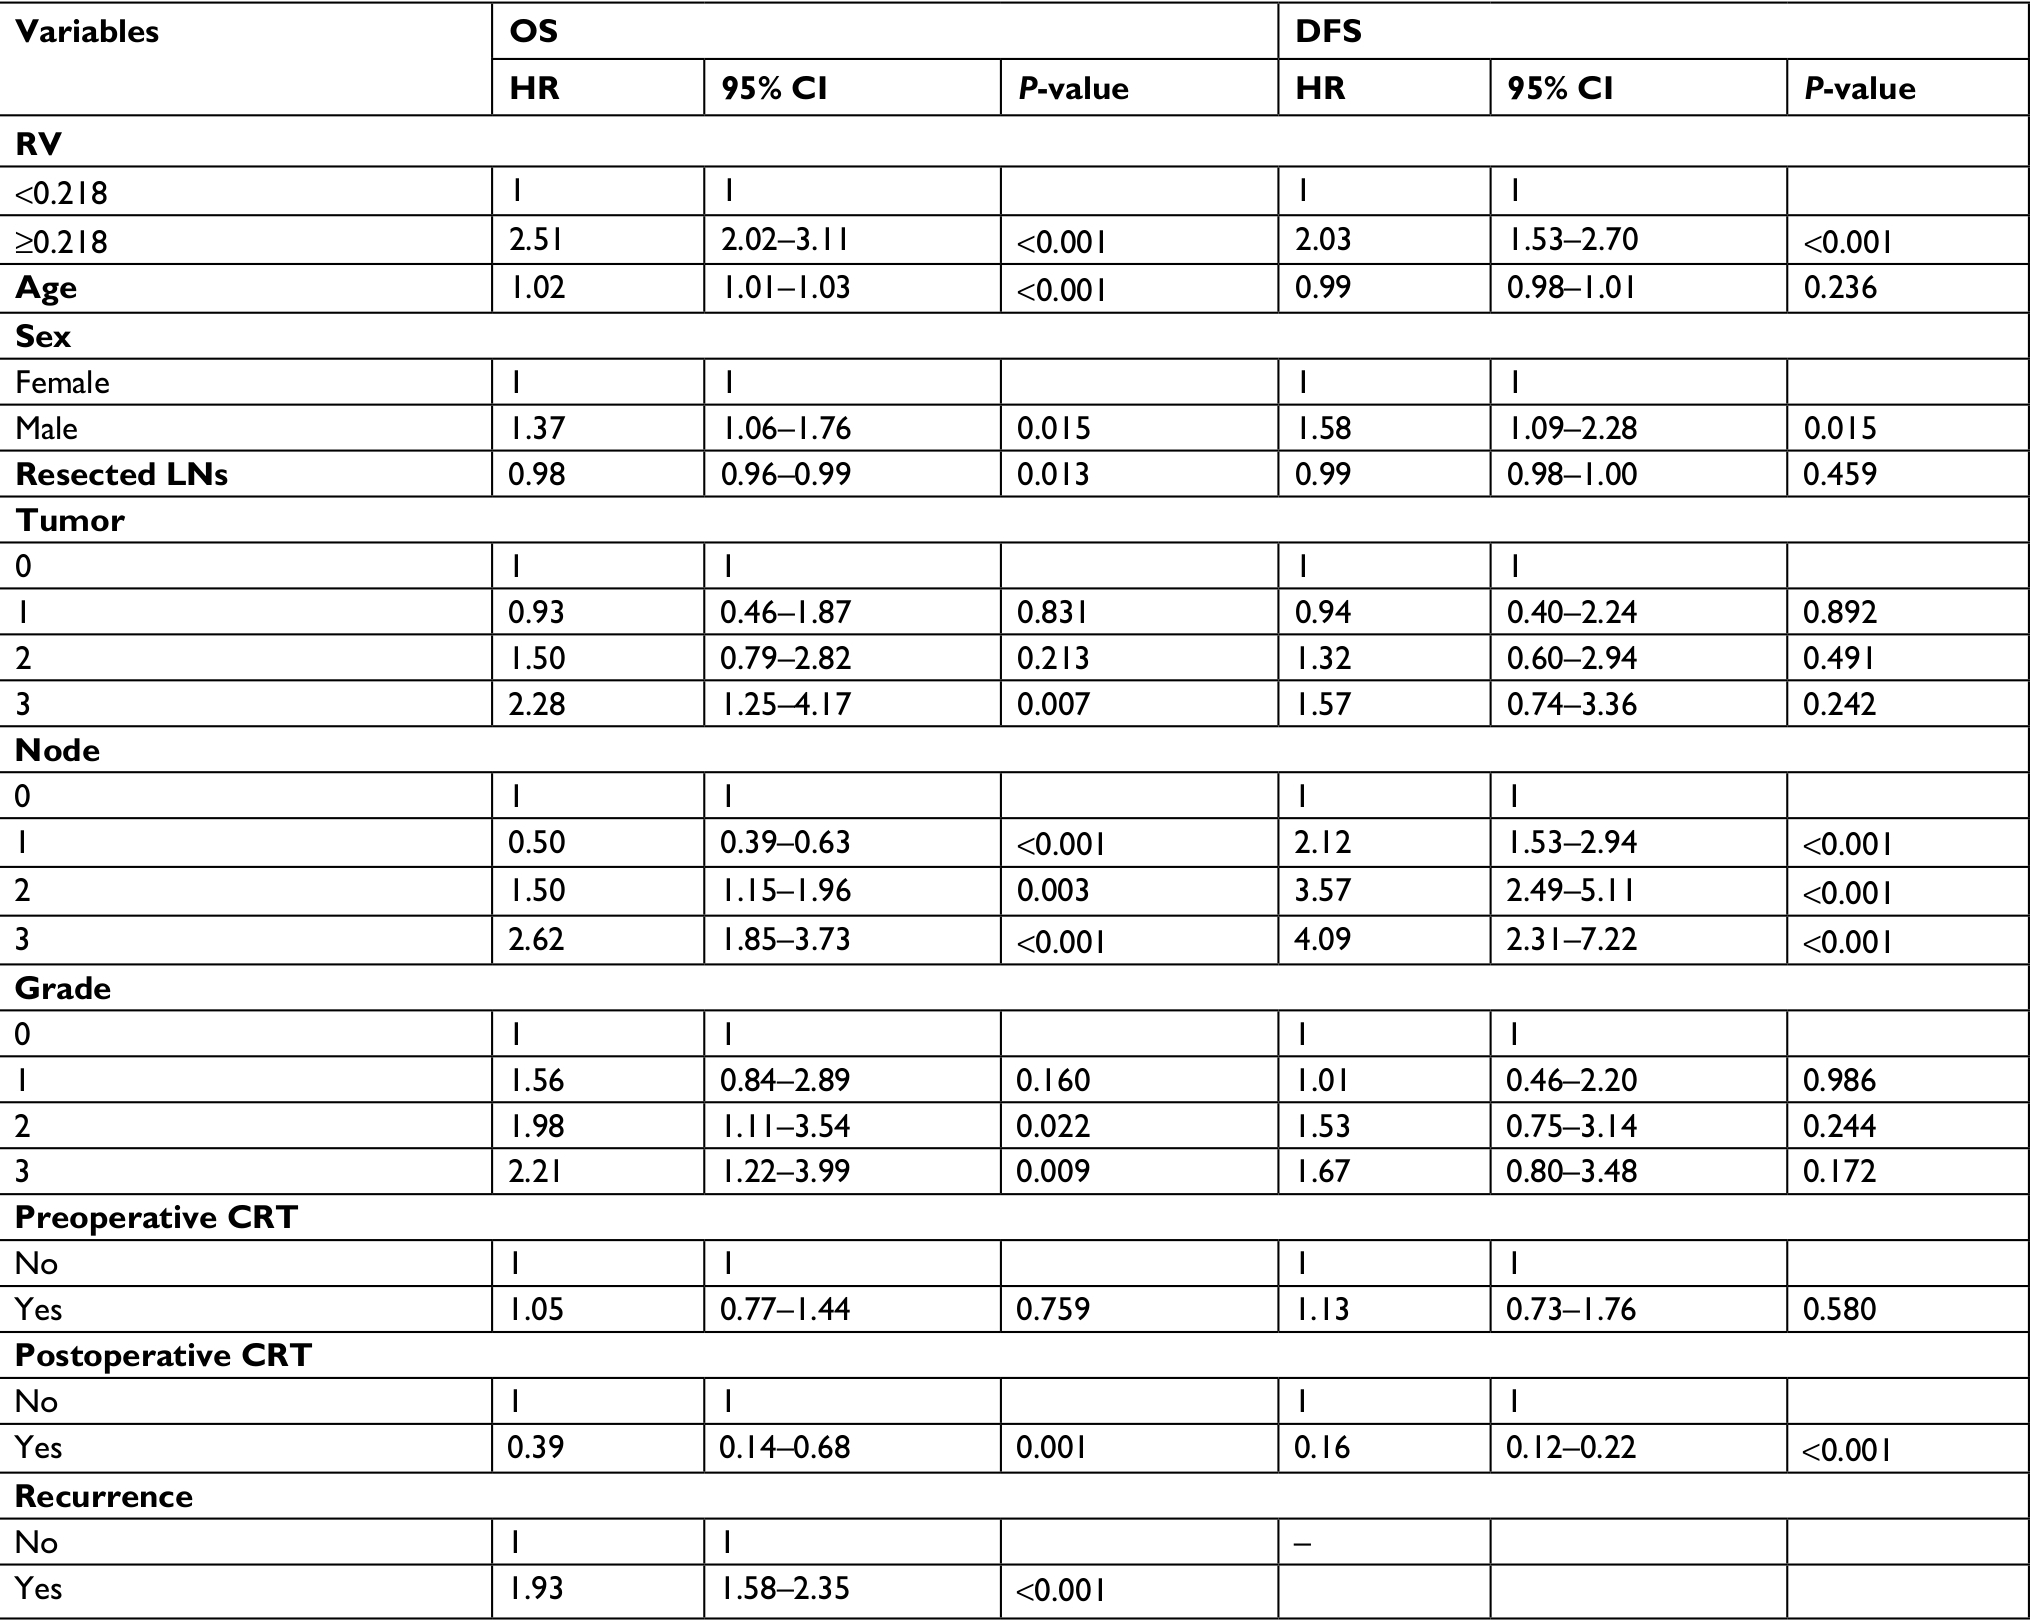 | Table S1 Univariate Cox regression analysis of prognostic factors influencing OS and DFS Notes: The variables tested in the univariate analysis showed that the factors significantly associated with OS were RV, sex, age, the number of removed LNs, N stage, T3 tumor stage, moderate or poor differentiation, recurrence, and postoperative CRT. Abbreviations: CRT, chemoradiation therapy; DFS, disease-free survival; LN, lymph node; OS, overall survival; RV, risk value. |
 © 2018 The Author(s). This work is published and licensed by Dove Medical Press Limited. The
full terms of this license are available at https://www.dovepress.com/terms
and incorporate the Creative Commons Attribution
- Non Commercial (unported, 3.0) License.
By accessing the work you hereby accept the Terms. Non-commercial uses of the work are permitted
without any further permission from Dove Medical Press Limited, provided the work is properly
attributed. For permission for commercial use of this work, please see paragraphs 4.2 and 5 of our Terms.
© 2018 The Author(s). This work is published and licensed by Dove Medical Press Limited. The
full terms of this license are available at https://www.dovepress.com/terms
and incorporate the Creative Commons Attribution
- Non Commercial (unported, 3.0) License.
By accessing the work you hereby accept the Terms. Non-commercial uses of the work are permitted
without any further permission from Dove Medical Press Limited, provided the work is properly
attributed. For permission for commercial use of this work, please see paragraphs 4.2 and 5 of our Terms.