Back to Journals » Journal of Pain Research » Volume 12
Recruitment and inclusion procedures as “pain killers” in clinical trials?
Authors Nothnagel H, Brown Menard M, Kvarstein G ![]() , Norheim AJ, Weiss T
, Norheim AJ, Weiss T ![]() , Puta C
, Puta C ![]() , Mist SD, Musial F
, Mist SD, Musial F
Received 5 February 2019
Accepted for publication 24 May 2019
Published 3 July 2019 Volume 2019:12 Pages 2027—2037
DOI https://doi.org/10.2147/JPR.S204259
Checked for plagiarism Yes
Review by Single anonymous peer review
Peer reviewer comments 2
Editor who approved publication: Dr Katherine Hanlon
H Nothnagel,1–3 M Brown Menard4,5, G Kvarstein,6 AJ Norheim,3 T Weiss,7 C Puta1,8, SD Mist,9 F Musial3
1Department of Sports Medicine and Health Promotion, Friedrich Schiller University Jena, Jena, Germany; 2Department of Psychiatry and Psychotherapy, Jena University Hospital, Jena, Germany; 3Department of Community Medicine, The National Research Center for Complementary and Alternative Medicine (NAFKAM), UiT The Arctic University of Norway, Tromsø, Norway; 4Crocker Institute, Kiawah Island, SC, USA; 5School of Integrative Medicine and Health Sciences, Saybrook University, Oakland, CA, USA; 6Pain clinic, University Hospital of Northern Norway, UiT The Arctic University of Norway, Tromsø, Norway; 7Department of Biological and Clinical Psychology, Friedrich Schiller University, Jena, Germany; 8Center for Interdisciplinary Prevention of Diseases related to Professional Activities, Friedrich Schiller University, Jena, Germany; 9Oregon Health & Science University, Portland, OR, USA
Background: Recruitment and inclusion procedures in clinical trials are time critical. This holds particularly true for studies investigating patients with fluctuating symptom patterns, like those with chronic neck pain. In a feasibility study on neck pain, we found a clinically relevant decrease in pain ratings within the recruitment period. This paper analyses the phenomenon and gives recommendations for recruitment procedures in clinical trials on pain.
Methods: Changes in pain intensity scores of 44 chronic neck pain patients (6 males and 36 females; mean age: 45.3±13.2 years) between the first telephone contact and baseline assessment were analyzed. Inclusion criterion was a mean pain intensity of ≥40 on a 0–100 numerical rating scale during the last three months. Statistical analyses were performed using ANOVA and parametric/non-parametric correlation coefficients.
Results: Average pain intensity score decreased significantly from 60.3±13.3 at telephone interview to 38.1±21.7 at baseline assessment. This represents a relative change of 36.8%. A weak but significant negative correlation was found between number of days between assessments and pain rating differences. There was a positive correlation between change of pain intensity and the pain level at the first contact, indicating that the decreased pain ratings over time were also dependent on the initial pain rating.
Conclusions: The clinically significant changes in pain intensity were weakly related to waiting time and moderately dependent on initial pain intensity, suggesting regression to the mean. The natural course of the disease and the Hawthorne effect are also discussed as contributing factors.
Keywords: chronic neck pain, Hawthorne effect, natural course of the disease, regression to the mean, clinical trial, recruitment
Introduction
Recruitment describes the selection process of participants/patients into a clinical trial, from the first communication to their enrolment, and is one of the most essential components in clinical research. A recruitment process can be complicated and time consuming, depending on the nature of the disease, the character of the inclusion/exclusion criteria, the type of intervention (single subject or group therapy), and the necessary procedures to check for those.
Complicated and time-consuming recruitment procedures are possibly acceptable for patients suffering from chronic diseases with a relatively stable time course of symptoms, but challenging for a clinical study recruiting patients suffering from pain syndromes with fluctuating symptom patterns such as musculoskeletal pain disorders. In diseases and syndromes with fluctuating pain, one might observe changes in pain ratings from inclusion to baseline which may obscure a potential treatment effect and contribute to high or early drop-out rates.
Generally, patients with fluctuating symptom patterns are usually contacted for participating in a potential study at times when the symptoms are particularly severe. If inclusion requires a time-consuming recruitment process, patients may experience reduced symptom severity at the time of enrolment, which will obscure the potential effect of the intervention investigated (“little or no pain – little or no gain”). In worst case, they may not fit the inclusion criteria anymore by the time the intervention begins.
Thus, the natural course of a disorder or a disease may play a significant role in clinical trials, even though it may be difficult to estimate its impact.1–3 Only a few clinical trials provide a consistent report of the time period from the first communication with the study participant, baseline assessment, and details of the time course of the symptoms.
Performing a feasibility pilot study as a first step can help to identify and avoid threats to the implementation of a larger trial.4,5 In a feasibility study on neck pain, our study group encountered a substantial decrease of pain intensity, between the telephone interview, as a first contact and the enrolment into the study. This change in pain ratings due to study routines and time schedule is relevant and can impose a threat to the main study itself.6–12
Therefore, the aim of this paper is to analyze the phenomenon of a clinically significant pain reduction after inclusion but before the beginning of the intervention and to investigate the contributing factors in order to avoid this phenomenon in larger trials on chronic non-specific neck pain.
Methods
General remarks
The data presented here are a part of a feasibility study, “Chronic, non-specific neck pain. Quantitative Sensory Testing (QST) as a tool for the investigation of massage and relaxation as interventions - a feasibility study” which aimed to explore study routines to prepare a clinical trial comparing clinical effects of massage and meditation as treatment interventions for chronic, non-specific neck pain including quantitative sensory testing as a biomarker. Although some details of the feasibility study are presented, our analyses will focus on the change in pain ratings during recruitment or the time period from the first contact to baseline assessment, just prior to the intervention.
Study participants
Study participants were recruited through local newspaper advertisements. During a telephone interview performed by one single person, they were screened for inclusion and exclusion criteria before referral to physical examination by a physician (A.J.N.).
Inclusion criteria were age between 21 and 75 years and non-specific neck pain persisting at least 3 months with a mean pain intensity of greater than or equal to 40 on a 100-point numerical rating scale (NRS, 0= “no pain at all”, 100= “worst pain imaginable”). The patients were excluded if they suffered from a congenital deformation of the spine or had neurological symptoms, neuropathic pain, spine surgery less than 12 months prior to screening, or received transcutaneous electrical nerve stimulation (TENS), acupuncture, osteopathy, chiropractic maneuver, or infiltration in the area within 4 weeks prior to inclusion. With regard to medications, patients were excluded if they needed to take blood-thinning medicine, steroids, or strong pain medications, such as opioids. Patients were allowed to continue to use non-steroidal anti-inflammatory drugs (NSAID), if that was part of their current pain management. The use of medications was documented in a pain diary throughout the study.
The study was approved by the regional ethics committee (Regional committees for medical and health research ethics, REC North 2014/1105). Participants were informed about the purpose of the study, risk/benefit profile of the interventions and the study itself. All participants were free to withdraw from participation at any point if they wished to. All participants provided written informed consent prior to participation. The study was performed in accordance with the declaration of Helsinki.
Design
Figure 1 shows the study design of the feasibility study. After verification of eligibility of the study participants in telephone interview (T0) and screening by study doctor, participants were included in the study. The study had a parallel design with two intervention arms; massage and relaxation. After baseline assessment (T1), patients received five treatment sessions of either massage or relaxation, followed by post-intervention assessment (T2), and follow-up assessment (T3) 4 weeks later.
 |
Figure 1 Study design of feasibility study across all assessments (T0, T1, T2, and T3). The analysis in the current study focuses on the time interval between the telephone interview (T0) and the baseline assessment (T1) presenting the gray structured square. The randomization into the groups (massage and relaxation) was performed after the baseline assessment (T1). Abbreviations: T0, telephone interview; T1, baseline assessment; T2, post-intervention assessment; T3, follow-up assessment. |
The analysis presented here focuses on the change of pain intensity indicated by study participants from the telephone interview (T0) to the baseline assessment (T1), before randomization into two study groups.
Primary outcome was the change of pain intensity. Pain intensity was recorded at all 4 assessments (T0, T1, T2, and T3) using the numerical rating scale (NRS, 0–100) at T0 and the visual analog scale (VAS, 0–100) at T1, T2, and T3. As secondary outcome, we performed a Quantitative Sensory Testing (QST) according to the standardized protocol establishing by the German Research Network on Neuropathic Pain (DFNS) at T1, T2, and T3.13
Outcome measures
Pain
The analyses of the data presented in this paper focus on the differences of pain ratings given by the study participants between the telephone interview (T0) and the baseline assessment (T1). Pain intensity assessed during the telephone interview (T0) was recorded on a numerical rating scale (NRS) graded from 0 to 100 (0= “no pain at all”, 100= “worst pain imaginable”). Pain intensity assessed at baseline assessment prior to randomization (T1) was recorded on a visual analog scale (VAS) graded from 0 mm to 100 mm (0 mm = “no pain at all”, 100 mm = “worst pain imaginable”). Both, NRS and VAS scores were transferred in a common 0–100 pain rating scale to compare the pain ratings at both time points.
Expectation
Within the feasibility study, expectations regarding the anticipated treatment effects were measured at baseline assessment (T1). The patients self-rated their expectations about the intervention on a VAS ranging from 0 mm to 100 mm (0 mm = “not effective at all”, 100 mm = “highly effective”) at the baseline assessment (T1). Since expectations are seen as a part of a potential placebo effect within an interventional study, they are likewise relevant for the analyses presented in this paper.14–16
Statistical methods
Data for age, weight, height, BMI, pain intensity, and number of days between telephone interview (T0) and baseline assessment (T1) are presented as means with standard deviation (SD) and 95% confidence interval (95% CI of mean). We used Student T-test for paired samples to calculate the difference in pain intensity at T0 and T1. Normal distribution was tested using the Kolmogorov–Smirnov test.
For the statistical analyses of the change in pain intensity over time, the whole sample was further divided into two subgroups with regard to waiting time, ie, days between T0 and T1; group A: 1–14 days and group B: >14 days, based on a common waiting time after inclusion of about two weeks in clinical trials. The differences of pain ratings were analyzed with analysis of variance (ANOVA) using the differences of pain ratings between T0 and T1 as the within-subject factor and the grouping in two groups according to the days between the T0 and T1 as the between-subject factors. The pain rating (NRS 0–100) at T0 was set as covariate in this model. No post hoc test was performed, since only two groups were compared.
Finally, three correlation analyses were performed to investigate a) the relationship between number of days between T0 and T1 and change in pain ratings, with the aim to identify a possible dependence on waiting time potentially related to the natural course of the disease, and b) the relationship between change in pain ratings between T0 and T1 and pain rating level at T0, to identify regression to the mean, and c) the relationship between the difference of pain ratings between T0 and T1 and the expectation (0–100) about treatment effects at T1, in order to investigate the impact of patient’s expectations which may play a role as part of a placebo effect. Correlation analyses were conducted using Pearson’s product–moment correlation coefficient for normally distributed parameters, and Kendall’s Tau correlation coefficient for non-normally distributed parameters. Correlation coefficients were interpreted as follows: |r| ≤0.29=negligible, 0.30–0.49=low, 0.50–0.69=moderate, 0.70–0.89 high, and >0.90=very high.
A p-value of <0.05 was considered statistically significant. Statistical analyses were performed using SPSS Statistics 22 (IBM Germany GmbH, Ehningen, Germany).
Results
Flow chart
A total of 85 potential patients were screened for eligibility by telephone interview (T0), of these 51 were invited to the screening by the study physician (A.J.N.). A total of 44 patients fulfilled the inclusion criteria and agreed to participate in the study. The reasons for exclusion were pain intensity below 40 on a 0–100 pain rating scale at the time point of the clinical investigation (N=11), the localization of pain apart from the neck (N=6), and other ongoing, non-pharmacological treatments (N=2).
All patients underwent baseline assessment at (T1). Two patients were considered as outlier according to waiting time between T0 and T1 and excluded from the statistical analyses. The outliers were defined as the values that were more than 1.5 x interquartile range beyond the 25th and 75th percentiles.17
Figure 2 shows a flow chart of patient flow throughout the feasibility study. The time points analyzed to determine possible changes in pain ratings during recruitment and inclusion are marked in black.
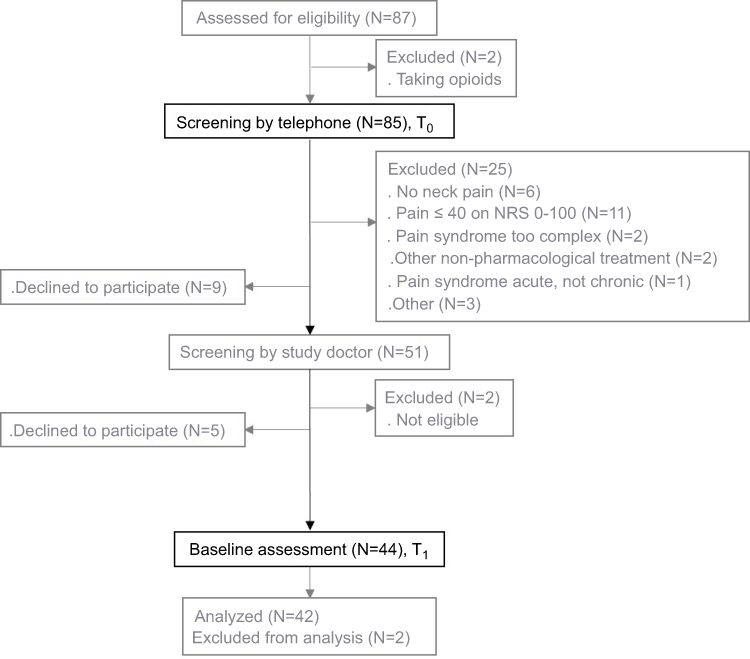 |
Figure 2 Flow chart of recruitment and progress of patients through study (the whole flow chart, gray). The analysis of the pain ratings during recruitment is based on pain intensity from the screening interview by telephone (T0) and baseline assessment (T1) (marked black in the flow chart). Abbreviations: T0, telephone interview; T1, baseline assessment. |
Sample characteristics
A total of 42 neck pain patients (45.3±13.2 years, mean±SD), 6 males and 36 females, were included in the statistical analyses. Average pain intensity and SD at T0 was 60.3±13.3 and at T1 38.1±21.7. The average time between T0 and T1 was 18.7±11.1 days. The expectation of the patients regarding the anticipated effectiveness of the treatment was 69.2±19.5 on a 0–100 VAS. Table 1 shows the demographic and clinical characteristics for the total sample.
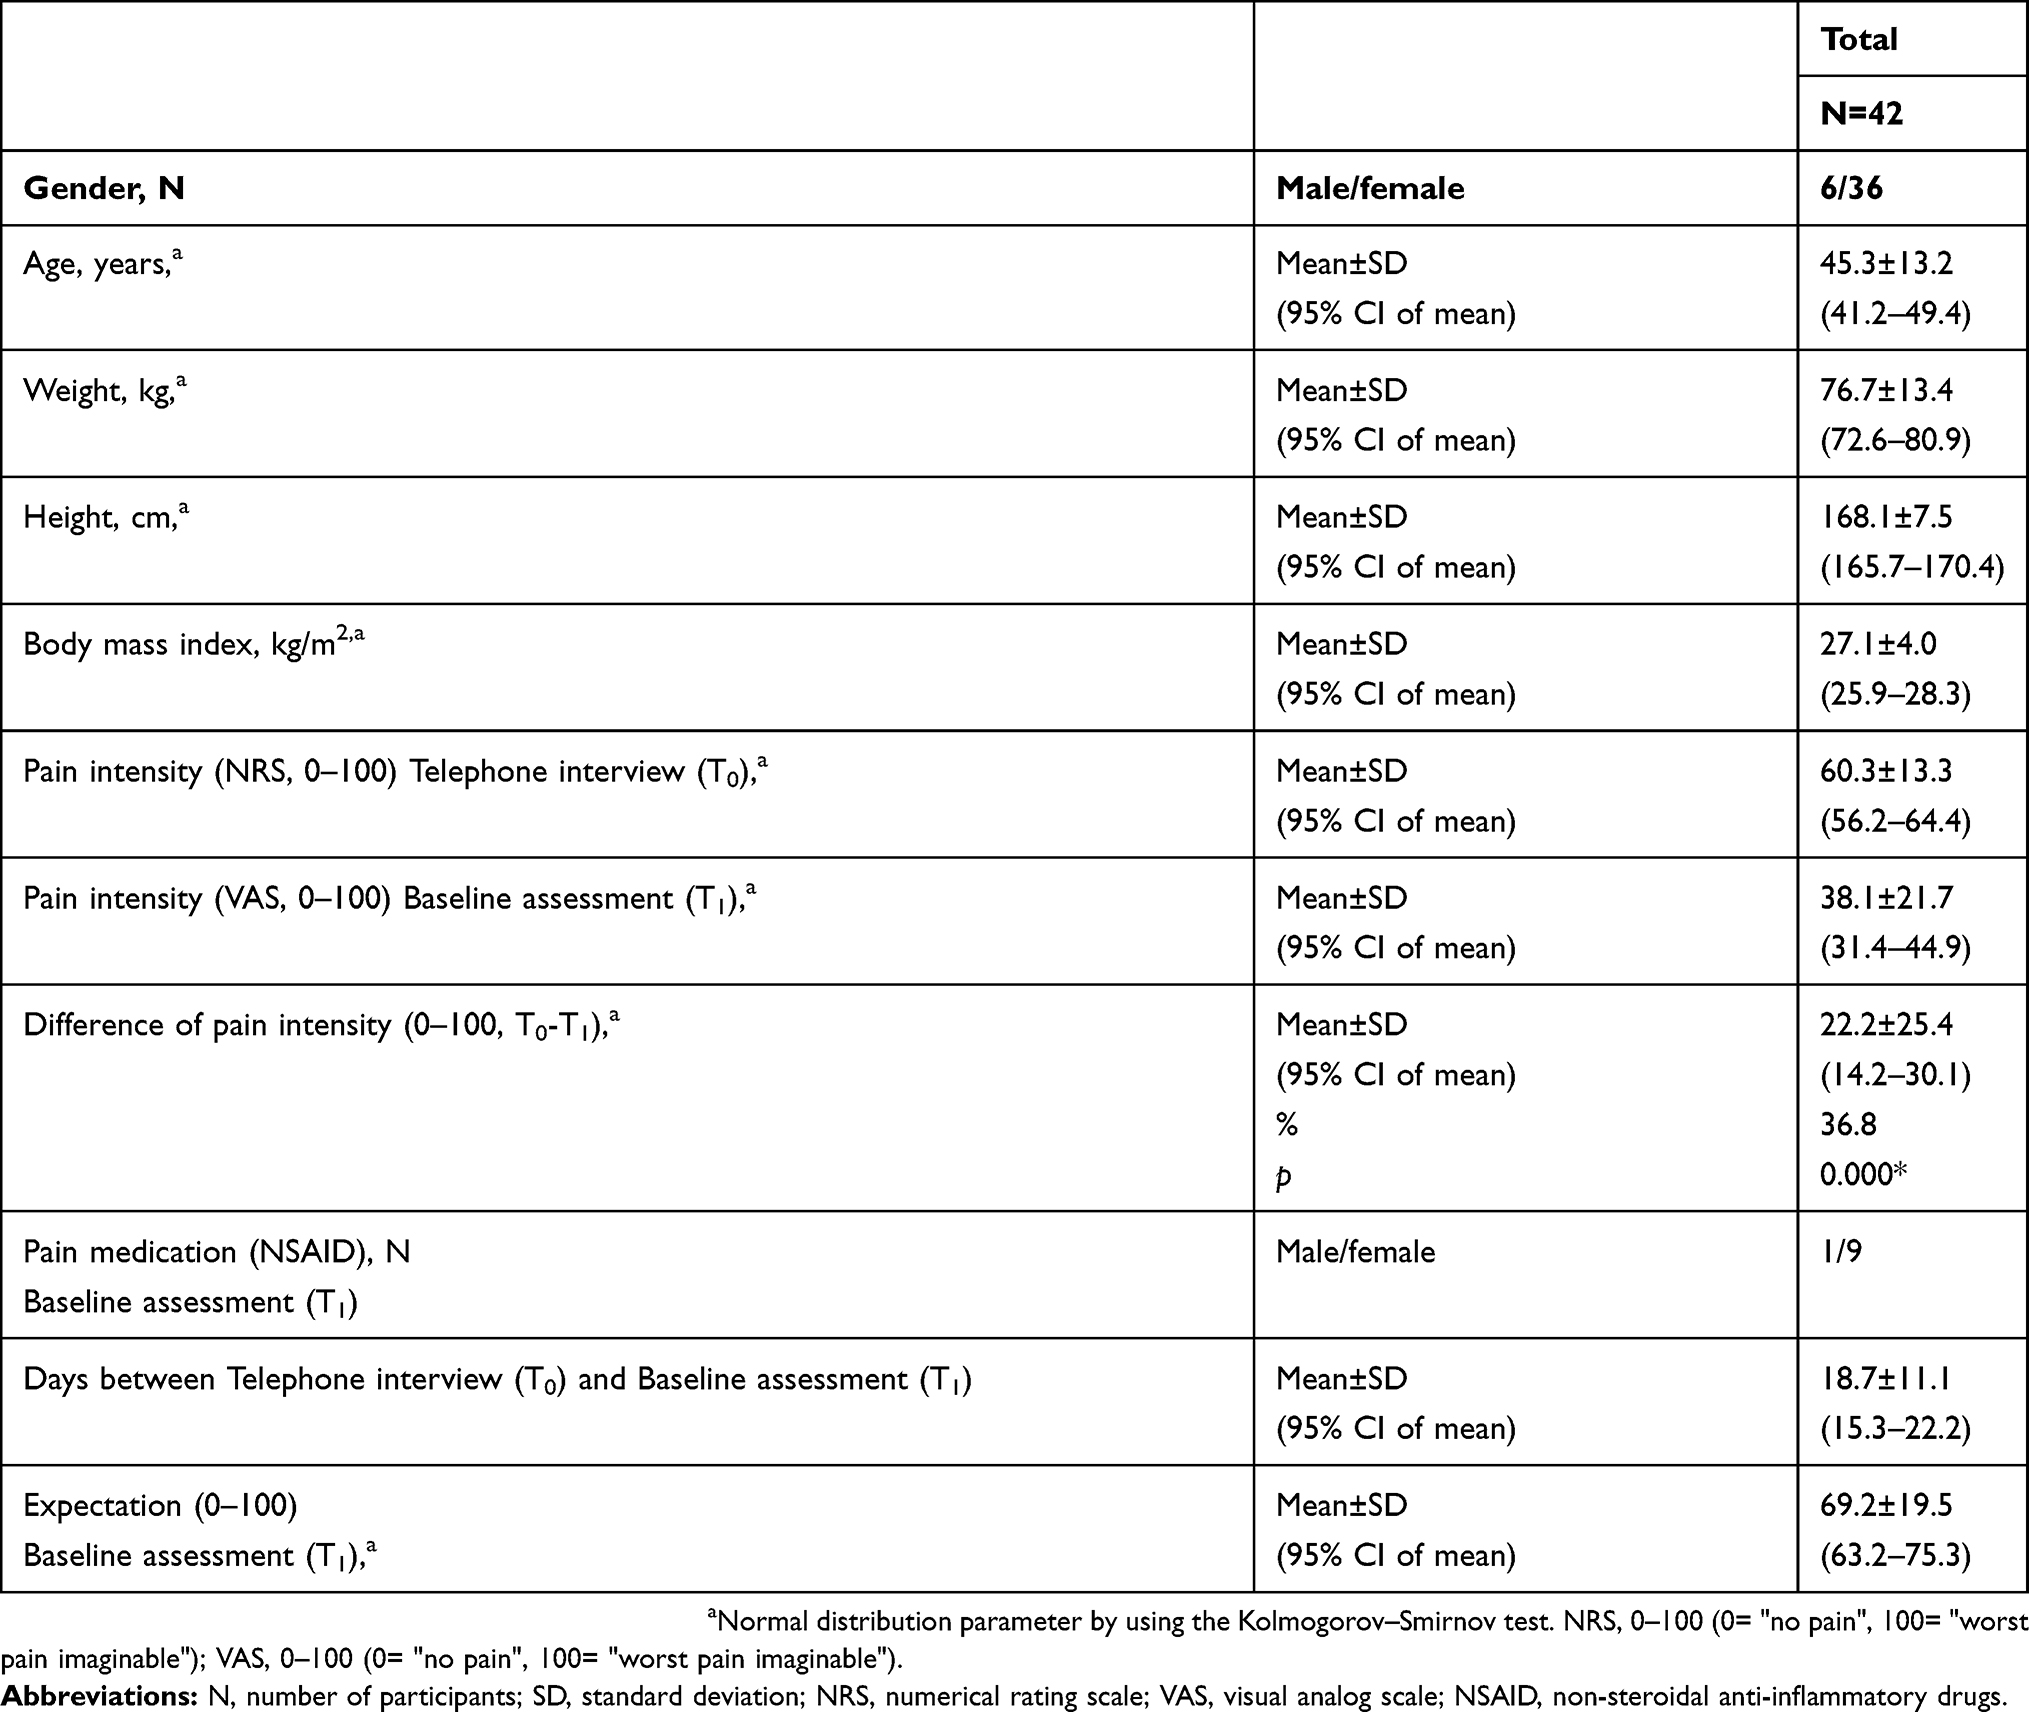 |
Table 1 Demographic and clinical characteristics of the total sample being analyzed |
Analyses of the pain ratings during recruitment and inclusion
Time course
Of the whole sample (N=42), 34 participants showed a decrease in pain rating from T0 to T1. This was the case for all participants (N=20) who waited 1–14 days and for 14 out of 22 with a waiting time >14 days (N=22). Only 6 patients reported an increased pain intensity, while 2 patients reported similar values at T0 and T1 (see Figure 3). Figure 3 reveals that 24 participants exhibited a pain score of <40 at T1 and were thus not fulfilling the main inclusion criterion to the feasibility study.
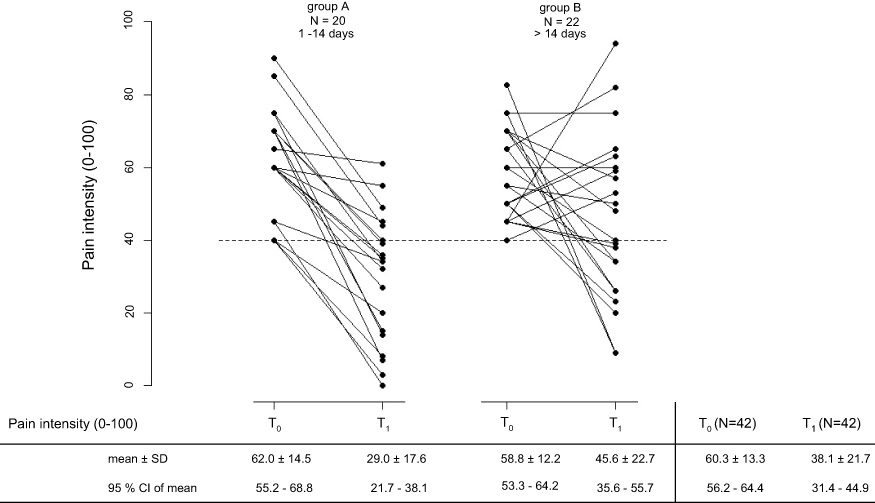 |
Figure 3 Course of pain ratings (0–100) between the telephone interview (T0) and baseline assessment (T1). For all patients (N=42), both pain ratings were plotted before randomization. For the statistical analyses, the patients were classified into two groups depending on the waiting time between T0 and T1: group A patients with 1–14 days between T0 and T1 (N=20), group B patients with more than 14 days between T0 and T1 (N=22). The horizontal dashed line indicates the pain intensity criterion for inclusion into the feasibility study (greater than or equal to 40 on a 0–100 rating scale). Abbreviations: T0, telephone interview; T1, baseline assessment. |
The average pain intensity at T0 was 60.3±13.3 (0–100, mean±SD) and at T1 38.1±21.7 (0–100, mean±SD). The difference in pain intensity between T0 and T1 corresponded 36.8% of the value at T0.
The analysis of variance (ANOVA) for the pain ratings on T0 and T1 showed a significant main effect of the factor; days between T0 and T1 (F(1,39)=6.17; p=0.017; ε=0.14). Furthermore, we found a significant effect for the covariate pain rating (NRS, 0–100) at T0 (F(1,39)=14.14; p=0.001; ε=0.27), indicating that the decrease in pain ratings over time was partly dependent on the initial pain rating at T0.
Correlation of the change in pain scores and the initial pain scores at T0
In order to further investigate the covariate pain rating at T0, we conducted an additional correlation analysis including the change in pain ratings from T0 to T1 and the pain level at T0. The analysis revealed a significant, although moderate positive correlation (r=0.52; p<0.001) supporting the findings from the regression analysis above that the pain reduction from T0 to T1 was in part dependent on the initial pain rating at T0 (see Figure 4).
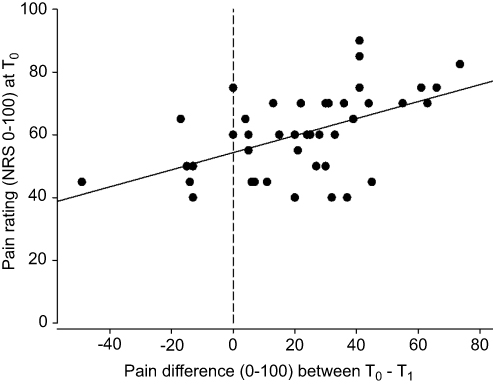 |
Figure 4 The scatter plot shows the relationship between pain changes from telephone interview (T0) to baseline assessment (T1) and the pain rating at T0. For each patient (N=42), the change in pain rating (x-axis) is plotted against the pain level at T0 (y-axis). The vertical dashed line represents a difference in pain rating of 0. Data points on the right illustrate patients with a decreasing pain rating to T1, while data points on the left illustrate patients with an increasing pain rating to T1.Abbreviations: T0, telephone interview; T1, baseline assessment; NRS, numerical rating scale. |
Correlation of the change in pain scores with absolute waiting time
If the decrease in pain ratings is dependent on waiting time, then the difference in pain ratings between T0 and T1 should correlate with the absolute waiting time. The correlation analysis revealed a statistically significant negative but negligible correlation (r = −0.25; p=0.020) between number of days from T0 to T1 and the corresponding difference in pain ratings. This indicates that the decrease in pain ratings was not strongly dependent on waiting time (see Figure 5).
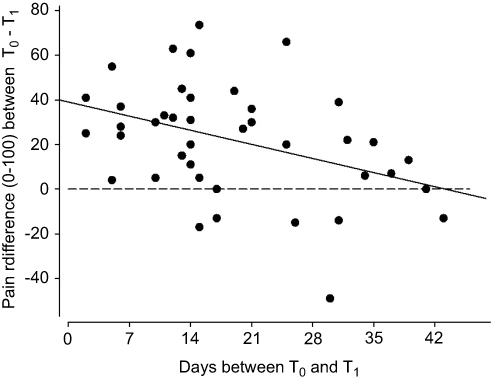 |
Figure 5 The scatter plot shows the relationship between waiting time until baseline assessment and differences in the pain intensity between the two measurement points. For each patient (N=42), the number of days between the telephone interview (T0) and baseline assessment (T1) (x-axis) are plotted against the differences in pain ratings from the telephone interview (T0) and baseline assessment (T1) (y-axis). The horizontal dashed line represents a change in pain rating (T0 - T1) of 0. Data points above the dashed line illustrate patients with a decreasing pain rating to T1, while data points below the dashed line illustrate patients with an increasing pain rating to T1. Abbreviations: T0, telephone interview; T1, baseline assessment. |
Correlation of the change in pain scores with expected treatment effects (expectation) at T1
There was no significant correlation (r=−0.01; p=0.948) between the difference of pain ratings between T0 and T1, and the participant’ expectation (0–100) about anticipated treatment effect (see Figure 6). Therefore, the decrease in pain ratings was not related to expectations about effectiveness of the interventions.
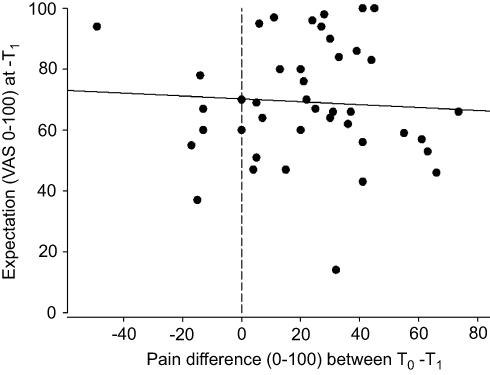 |
Figure 6 The scatter plot depicts the correlation between the differences in pain from the telephone interview (T0) to baseline assessment (T1), and the expectations of the study participants about the study outcome. For each patient (N=42), the differences (T0-T1) for the pain ratings (x-axis) are plotted against and the expectations at T1 (y-axis). The vertical dashed line represents the differences of the pain ratings (T0-T1). The data points on the right illustrate patients with a decreasing pain rating up to T1, data points on the left illustrate patients with an increasing pain rating up to T1. Abbreviations: T0, telephone interview; T1, baseline assessment; VAS, visual analog scale. |
Discussion
The mean decrease in pain intensity from the first contact (T0) until randomization (T1) in our study was 36.8%. This is by definition above the cut off of 30% the minimal clinically important difference (MCID) and equivalent to a moderate pain reduction.6,10,12, Moreover, the effect was rather consistent, as 34 of the total sample (N=42) revealed a pain reduction during the waiting period.
Natural course of the disease
Neck pain fluctuates over time, and patients are probably most willing to participate in a study when their pain is temporarily more intense. Later, when the patient is to be randomized the pain levels may be lower due its natural course.2,3
The natural history of a disease describes its time course during the absence of an intervention.1 This effect should have a similar influence on all study groups, if they are equally handled with regard to study procedures, and blinding and randomization are successful. However, the natural course of the disease may affect study outcomes substantially across groups, depending on the time course of the symptoms and the time interval between inclusion and intervention, and thus imposes a threat to the internal validity of a study.1
The significant correlation between waiting time and change in pain rating supports at first glance the assumption that a natural course of neck pain contributed to the effect. Nonetheless, the effect is not entirely consistent over time, as we also see less pain reduction with increased waiting time. A closer look at Figure 4 reveals negative values for six patients (left of the dotted vertical line). These were the patients who waited exceptionally long for T1 (ranged from 15 to 43 days from T0 to T1). Thus, it is likely that these patients waited so long that they experienced an increase in pain ratings over time. Thus, the curve may in fact be more u-shaped as it appears in the correlational analysis, with an initial decrease in pain, followed by an increase over time.
Nonetheless, symptom fluctuation did not seem to be the only reason for the moderate pain reduction during the enrolment phase. The correlation between the change in pain rating and the initial pain rating at T0 suggests that the change in pain rating over time is also dependent on initial pain intensity at T0. A fact that could support the hypothesis that participants are more likely to enter a study when their pain is particularly intense.
Regression to the mean
Another highly relevant phenomenon with regard to fluctuating symptom patterns is the so-called “regression to the mean”.18–20 Regression to the mean is a purely statistical phenomenon, describing the general tendency for extreme values to converge towards a middle level.21 The more extreme the initial value is, the higher the potential for such regression will be.22
For fluctuating pain syndromes, this implies that a high pain intensity prior to examination will to some extent, in itself, predict the following decrease. Taken together, the fact that it is necessary to define a reasonably high initial value as inclusion criterion in pain trials implies that regression to the mean is likely to occur. Regression to the mean can affect any investigation where the response to treatment is classified relative to initial values.23
In conclusion, both the natural course of the pain syndrome and regression to the mean may have influenced the decrease in pain intensity in our study.1,24 A predefined inclusion criterion with high pain intensity will lead to a data structure, where regression to the mean is likely to occur.
Possible placebo effects and expectation
Expectation-dependent placebo effects are an inherent part of all clinical interventions and must be taken into account. It is therefore a standard baseline procedure in clinical trials to include questions about expectations about the treatment effects. This was therefore done at T1 in the planned feasibility study. Although we did not assess expectation at T0, we assumed that by the fact that the study participants showed up at T1 to enter the interventional part of the study that their expectations about the effectiveness of the treatment were at least as high at T1. Therefore, even though the correlation between the participant’s expectation at T1 and the difference in pain ratings between T0 and T1 represents a “backward analysis”, it still provides information on how expectation influenced the difference in pain ratings.14–16
The correlation analysis revealed that there was no influence of treatment effect related expectations on the difference in pain ratings. Figure 6 shows the reason for that: treatment effect expectations were uniformly high (69.2±19.5, Table 1) at T1 so that there was not enough variation in expectations to correlate with the change in pain ratings. In conclusion, even though we should consider expectation-dependent placebo effects as part of the treatment effect in the feasibility study (not presented here), we find it unlikely, that the expectation-dependent placebo effects played a role for the reduction in pain ratings within the waiting period.
The Hawthorne effect
Another, critical issue with regard to fluctuations in outcome measures may be the so-called Hawthorne effect. This effect describes the phenomenon that a person may change her or his behavior, experiences, emotions, etc., when becoming a study participant.25–28 The phenomenon is interpreted as a type of reactivity to the situation, where a person is being systematically investigated and “observed”. A possible reason for this effect may be increased attention to factors that are related to the study outcomes.
Thus, independent of the natural course of the disease, the inclusion procedure and the enrolment into a study may, in itself, have a major impact on the main study outcomes. Even though this influence can be expected to be equally distributed among the study groups,29–32 the Hawthorne effect is difficult to control in experimental as well as, placebo and non-treatment control groups.
Limitations
The data presented are part of the feasibility study on how to integrate the standardized protocol of DFNS QST protocol into a clinical trial on the effects of massage and meditation for chronic, non-specific neck pain. However, the study was not planned to directly assess recruitment and enrolment-related problems. Thus, a more differentiated design, directly aiming at possible threats to the internal validity of outcomes in pain trials during the recruitment and enrolment phase, would have been more appropriate. Nonetheless, we assume that the challenges to a clinical study on pain presented here are of relevance to other pain researchers and have to be regarded in further clinical trials.
The use of two different pain rating scales in this study is another limitation. During the screening (telephone interview, T0), patients assessed pain intensity with a numeric rating scale (NRS, 0–100) while a visual analog scale (VAS, 0–100) was used at baseline assessment (T1). The reason for this incongruence is that the NRS is easier to handle in a telephone interview situation.
Although it has been shown that NRS and VAS ratings correlate significantly, VAS scores have a tendency to reveal lower ratings compared to NRS scores. Thus, it is not unproblematic to use these two scales interchangeably when assessing self-reported pain.33,34 In our study, the fact that NRS scores seem to reveal higher pain ratings than VAS scores means that the pain scores measured at T0 possibly overestimate pain compared to the VAS pain measures at T1. Ultimately, this overestimation would contribute to higher pain values at the first measurement point (T0) and could thus lead to an overestimation of the decrease in pain ratings from T0 to T1. In conclusion, it would be important to estimate whether the decrease in pain ratings from T0 to T1 is within or outside the range of the difference in pain ratings between the NRS and VAS ratings.
According to the literature, the differences between NRS and VAS means were |0.52| cm for the initial assessment and |0.86| cm across all assessments in a study conducted among teenagers (mean age 14.7±3.1 years). Moreover, in this study, the differences between NRS and VAS ratings decreased with increasing pain severity across all assessments.34 In another study conducted with adults, the differences between NRS and VAS ranged between |2.30| cm and |1.30| cm.34
In our study, the difference between the telephone interview (T0) and the baseline assessment (T1) was 60.3±13.3 and 38.1±21.7 representing a change of 36.8% and a distance of |22.2| mm or |2.22| cm between the NRS at T0 and the VAS at T1. According to the data on children provided by Myrvik (2015) this difference of 2.22 cm would be outside the range of differences between the two scales, but within the range according to the data provided Holdgate (2003), even though at the outer limit of the interval.
In conclusion, the fact that the pain ratings measured with the NRS tend to be higher than those measured with the VAS and the fact that the NRS was used at T0 might have contributed to systematically higher pain ratings at T0 in this study. It may have thus contributed to larger decreases in pain ratings from T0 to T1.34 However, since we expected regression to the mean to play a role in this analysis, our statistical approach already controls for the dependency of the differences between T0 and T1 on the initial values at T0. In our ANOVA model, the initial values were used as covariate, and thus, the influence of the initial values on the total effect is extracted. Indeed, there is a significant effect of the covariate (pain rating NRS at T0), nonetheless, the factor days between T0 and T1 remained significant and thus non-neglectible. It is impossible to estimate how much of the difference between NRS and VAS contributed to the effect of the increased initial values (pain ratings at T0); however, the ANCOVA reveals a significant effect of waiting time beyond a significant effect of the covariate. Thus, even though the initial values at T0 played an important role for the total effect, there still remains substantial support for a decrease in pain ratings during the waiting time between recruitment and inclusion.
Further directions and recommendations
The Hawthorne effect predicts that a certain reduction in pain has to be expected simply due to the fact that patients participate in a study. Consequently, inclusion criteria should possibly be strict, eg, pain intensity >60. There are several challenges related to this: i) The total available study population will be significantly smaller and consequently, recruitment may be more difficult; ii) Such a high pain intensity may not reflect the majority of the patients and will thus restrict the generalization of the study results (external validity); iii) A high pain rating as inclusion criterion will also make the main outcome more vulnerable to distribution-related phenomena, such as regression to the mean.
While the Hawthorne effect is uncontrollable, the impact of the natural course of the disease could be controlled by keeping the time frame as tight as possible. In our study on neck pain, the main reduction in pain intensity occurred within 2 weeks and thus a time frame of a few days would be more advisable.
However, another methodological approach to the natural course of the disease and regression to the mean could be to wait more than 14 days in order to avoid the initial fluctuations in pain ratings (see Figures 3 and 4 where six study participants already show an increase in pain ratings over time). The benefits of such a design would be that it is easier to pick up a defined treatment effect while the disadvantages are that the study population may not represent typical pain patients.
Moreover, the main outcome measure of a study, in this case the pain intensity, should be recorded systematically after the first contact (eg, telephone interview) throughout the recruitment and enrolment. This allows for better documentation of symptom changes over time. Another possibility would be to conduct an observational pilot study before an interventional trial to observe the natural course of the disease in the target group. Such data would allow for a more systematic recruitment approach since a population-derived inclusion criterion, information about the time course of the symptom, and the recruitable patient population would be available.
Conclusion
Three main potential influences on a clinically relevant decrease in pain scores during the enrolment phase of a study were identified; the natural course of the disease, regression to the mean, and the Hawthorne effect. They can all impose a threat to a clinical trial of diseases with a fluctuating symptom pattern because they are difficult to control. Clinical trial methodology, by defining a primary inclusion criterion related to the primary outcome measure, comprises a risk of a regression to the mean in spontaneously fluctuating diseases. Awareness of this phenomenon can contribute to better routines for clinical studies accounting for a change in the main outcome measure during enrolment and recruitment.
Acknowledgments
We thank Brit Johanne Dragest for her indispensable assistance in the organization and coordination of the study. Tone Westergård and Elke Klemowicz are acknowledged for their practical work and engagement in all massage and relaxation interventions. We are indebted to all voluntary patients who participated in the study for their consent and cooperation.
Author Contributions
All authors contributed to data analysis, drafting and revising the article, gave final approval of the vision to be published, and agree to be accountable for all aspects of the work.
Disclosure
The authors report no conflicts of interest in this work.
References
1. Jekel JF, Katz DL, Elmore JG, Wild DMG. Epidemiology, Biostatistics, and Preventive Medicine. Philadelphia: Saunders; 2007.
2. Stub T, Salamonsen A, Alræk T. Safety of treatment provided by homeopaths. Eur J Integr Med. 2016;8:30–31. doi:10.1016/j.eujim.2016.08.074
3. Stub T, Salamonsen A, Kristoffersen A, Musial F. How to handle worsening of condition during treatment – risk assessment in homeopathic practice. Forsch Komplementmed. 2015;22(1):30–35. doi:10.1159/000377644
4. Arain M, Campell MJ, Cooper CL, Lancaster GA. What is a pilot or feasibility study? A review of current practice and editorial policy. BMC Med Res Methodol. 2010;10(1):67. doi:10.1186/1471-2288-10-67
5. Thabane L, Ma J, Chu R, et al. A tutorial on pilot studies: the what, why and how. BMC Med Res Methodol. 2010;10(1):1. doi:10.1186/1471-2288-10-1
6. Dworkin RH, Turk DC, Wyrwich KW, et al. Interpreting the clinical importance of treatment outcomes in chronic pain clinical trials: IMMPACT recommendations. J Pain. 2008;9(2):105–121. doi:10.1016/j.jpain.2007.09.005
7. Farrar JT, Young JP
8. Farrar JT, Pritchett YL, Robinson M, Prakash A, Chappell A. The clinical importance of changes in the 0 to 10 numeric rating scale trials of duloxetine in pain disorders. J Pain. 2010;11(2):109–118. doi:10.1016/j.jpain.2009.06.007
9. Jensen MP, Chen C, Brugger AM. Interpretation of visual analog scale ratings and change scores: a reanalysis of two clinical trials of postoperative pain. J Pain. 2003;4(7):407–414.
10. Mannion AF, Balagué F, Pellise F, Cedraschi C. Pain measurement in patients with low back pain. Nat Clin Pract Rheumatol. 2007;3(11):610–618. doi:10.1038/ncprheum0646
11. Morley S, Williams A, Hussain S. Estimating the clinical effectiveness of cognitive behavioural therapy in the clinic: evaluation of a CBT informed pain management programme. Pain. 2008;137(3):670–680. doi:10.1016/j.pain.2008.02.025
12. Turner JA, Turk DC. The significance of clinical significance. Pain. 2008;137(3):467–468. doi:10.1016/j.pain.2008.03.029
13. Rolke R, Magerl W, Campbell KA, et al. Quantitative sensory testing: a comprehensive protocol for clinical trials. Eur J Pain. 2006;10(1):77–88. doi:10.1016/j.ejpain.2005.02.003
14. Enck P, Benedetti F, Schedlowski M. New insights into the placebo and nocebo responses. Neuron. 2008;59(2):195–206. doi:10.1016/j.neuron.2008.06.030
15. Horing B, Weimer K, Muth ER, Enck P. Prediction of placebo responses: a systematic review of the literature. Front Psychol. 2014;5:1079. doi:10.3389/fpsyg.2014.01079
16. Musial F, Klosterhalfen S, Enck P. Placebo responses in patients with gastrointestinal disorders. World J Gastroenterol. 2007;13(25):3425. doi:10.3748/wjg.v13.i25.3425
17. Bortz J. Statistik Für Human- Und Sozialwissenschaftler. Heidelberg: Springer; 2010.
18. Bland JM, Altman DG. Statistics notes: some examples of regression towards the mean. Bmj. 1994;309:780. doi:10.1136/bmj.309.6957.780
19. Davis CE. The effect of regression to the mean in epidemiologic and clinical studies. Am J Epidemiol. 1976;104(5):493–498. doi:10.1093/oxfordjournals.aje.a112321
20. Yudkin PL. How to deal with regression to the mean in intervention studies. Lancet. 1996;347:241–243.
21. Maher M, Mountain L. The sensitivity of estimates of regression to the mean. Accid Anal Prev. 2009;41(4):861–868. doi:10.1016/j.aap.2009.04.020
22. Morton V, Torgerson DJ. Effect of regression to the mean on decision making in health care. Bmj. 2003;326(7398):1083–1084. doi:10.1136/bmj.326.7398.1083
23. Shephard RJ. Regression to the mean. A threat to exercise science? Sports Med. 2003;33(8):575–584. doi:10.2165/00007256-200333080-00003
24. Barnett AG, Van der Pols JC, Dobson AJ. Regression to the mean: what it is and how to deal with it. Int J Epidemiol. 2005;34(1):215–220. doi:10.1093/ije/dyh299
25. McCambridge J, Witton J, Elbourne DR. Systematic review of the hawthorne effect: new concepts are needed to study research participation effects. J Clin Epidemiol. 2014;67(3):267–277. doi:10.1016/j.jclinepi.2013.08.015
26. McCarney R, Warner J, Iliffe S, Van Haselen R, Griffin M, Fisher P. The hawthorne effect: a randomized, controlled trial. BMC Med Res Methodol. 2007;7(1):30.
27. Parsons HM. What happened at hawthorne?: new evidence suggests the hawthorne effect resulted from operant reinforcement contingencies. Science. 1974;183(4128):922–932. doi:10.1126/science.183.4128.922
28. Wickström G, Bendix T. The “hawthorne effect” – what did the original hawthorne studies actually show? Scand J Work Environ Health. 2000;26(4):363–367.
29. Adair JG. The hawthorne effect: a reconsideration of the methodological artifact. J Appl Psychol. 1984;69(2):334–345. doi:10.1037/0021-9010.69.2.334
30. De Amici D, Klersy C, Ramajoli F, Brustia L, Politi P. Impact of the hawthorne effect in a longitudinal clinical study: the case of anesthesia. Control Clin Trials. 2000;21(2):103–114.
31. Braunholtz DA, Edwards SJ, Lilford RJ. Are randomized clinical trials good for us (in the short term)? Evidence for a “trial effect”. J Clin Epidemiol. 2001;54(3):217–224. doi:10.1016/S0895-4356(00)00305-X
32. Leonard KL. Is patient satisfaction sensitive to changes in the quality of care? An exploitation of the hawthorne effect. J Health Econ. 2008;27(2):444–459. doi:10.1016/j.jhealeco.2007.07.004
33. Holdgate A, Asha S, Craig J, Thompson J. Comparison of a verbal numeric rating scale with the visual analogue scale for the measurement of acute pain. Emerg Med. 2003;15(5‐6):441–446. doi:10.1046/j.1442-2026.2003.00499.x
34. Myrvik MP, Drendel AL, Brandow AM, Yan K, Hoffmann RG, Panepinto JA. A comparison of pain assessment measures in pediatric sickle cell disease: visual analog scale versus numeric rating scale. J Pediatr Hematol Oncol. 2015;37(3):190–194. doi:10.1097/MPH.0000000000000306
 © 2019 The Author(s). This work is published and licensed by Dove Medical Press Limited. The
full terms of this license are available at https://www.dovepress.com/terms
and incorporate the Creative Commons Attribution
- Non Commercial (unported, 3.0) License.
By accessing the work you hereby accept the Terms. Non-commercial uses of the work are permitted
without any further permission from Dove Medical Press Limited, provided the work is properly
attributed. For permission for commercial use of this work, please see paragraphs 4.2 and 5 of our Terms.
© 2019 The Author(s). This work is published and licensed by Dove Medical Press Limited. The
full terms of this license are available at https://www.dovepress.com/terms
and incorporate the Creative Commons Attribution
- Non Commercial (unported, 3.0) License.
By accessing the work you hereby accept the Terms. Non-commercial uses of the work are permitted
without any further permission from Dove Medical Press Limited, provided the work is properly
attributed. For permission for commercial use of this work, please see paragraphs 4.2 and 5 of our Terms.