Back to Journals » Clinical Ophthalmology » Volume 13
RE-PERG, a new paradigm for glaucoma diagnosis, in myopic eyes
Authors Mavilio A ![]() , Sisto D, Ferreri P, Dammacco R
, Sisto D, Ferreri P, Dammacco R ![]() , Alessio G
, Alessio G ![]()
Received 6 April 2019
Accepted for publication 21 June 2019
Published 24 July 2019 Volume 2019:13 Pages 1315—1322
DOI https://doi.org/10.2147/OPTH.S211337
Checked for plagiarism Yes
Review by Single anonymous peer review
Peer reviewer comments 2
Editor who approved publication: Dr Scott Fraser
Alberto Mavilio,1 Dario Sisto,2 Paolo Ferreri,2 Rosanna Dammacco,2 Giovanni Alessio2
1Social Health District, Glaucoma Center, Azienda Sanitaria Locale, Brindisi, Italy; 2Department of Neurosciences, Institute of Ophthalmology, University of Bari, Bari, Italy
Purpose: To evaluate reliability of steady-state pattern electroretinogram (ssPERG) phase variability in re-test (procedure called RE-PERG) in the presence of myopia, which is known to affect ssPERG amplitude, in glaucomatous patients (GP), normal controls (NC), and myopic patients (MY).
Methods: The procedure was performed on 50 GP, 35 NC, and 19 MY. All subjects were examined with RE-PERG, spectral-domain coherence tomography (SD-OCT), and standard automated perimetry (SAP). Standard deviation of phase (ssPERG SDph) and mean amplitude value (ssPERG Amp) of second harmonic (2ndH) were correlated, by means of one-way ANOVA and Pearson correlation, with mean deviation (MD) and pattern standard deviation (PSD) assessed by SAP and retinal nerve fiber layer (RNFL) and ganglion cell complex (GCC) thickness assessed by SD-OCT. Receiving operating characteristics were calculated in cohort populations with and without myopia.
Results: GP showed significant differences from the control group for MD, PSD, RNFL, GCC, ssPERG Amp, and ssPERG SDph; GP also showed significant differences from the MY group for all the parameters except for ssPERG Amp, which is reduced in both groups. In GP group, ssPERG Amp showed a specificity of 82.1% (95% confidence interval [CI]I: 66.5–92.5). In MY group, ssPERG Amp was reduced in 58% of the patients. As a consequence of this, in GP and MY groups, considered as a whole, total specificity dropped to 70.69% (95% CI: 57.3–81.9). In the GP group, ssPERG SDph showed a specificity of 84.6% (95% CI: 69.5–91.1). In both GP and MY groups, considered as a whole, ssPERG SDph total specificity increased from 84.6% to 93.1% (95% CI: 83.3–98.1).
Conclusion: Intrinsic phase variability of ssPERG is not influenced by myopia, even in the presence of fundus alterations.
Keywords: glaucoma, pattern electroretinogram, steady-state, perg, re-perg, myopia
Introduction
The diagnosis of glaucomatous damage in myopic patients (MY) is particularly challenging, since myopic eyes, especially in medium- to high myopia, often show fundus alterations. All these alterations are able to bias the findings of perimetry,1,2 OCT3–10 and PERG.11
We developed a test, called RE-PERG, based on the study of the individual intrinsic within-trial variability of the steady-state PERG signal in test–retest of the same eye (ie, five consecutive stimulations without pause). In a first study12 we showed that the variability of early glaucoma patients was greater than the physiological one present in healthy individuals; in addition, it was also correlated with markers of disease severity such as retinal thickness and visual field indices. Subsequently, we showed that RE-PERG findings are not influenced by optic media opacities such as cataract.13 Aim of this study was to evaluate the reliability of RE-PERG in non-glaucomatous patients (GP) with myopic fundus alterations.
Materials and methods
The groups GP and normal controls (NC) were the same used in previously published studies.12,13 As for MY group, from January 1 to 31 2017, 19 consecutive non-glaucomatous MY were enrolled in the study. All patients were recruited at the Glaucoma Center of the Brindisi Social Health District, Mesagne, Italy, and at the Department of Neurosciences, Institute of Ophthalmology of the University of Bari, Italy.
Inclusion criteria were the presence of at least one myopic alteration of the fundus among the following: tilted disc, large optic disc with large excavation, peripapillary atrophy, posterior staphyloma, tessellated, or tigroid fundus. Each participant underwent a comprehensive ophthalmic evaluation, including review of medical history, best-corrected visual acuity testing, IOP measurement by Goldmann applanation tonometry, slit lamp biomicroscopy, gonioscopy, and dilated fundus examination with a 78 D lens. All participants had best-corrected visual acuity ≥20/40 (Snellen acuity), spherical refraction within −3.50 and −8.00 D and cylinder correction within −2.0 DGP and transparent ocular media (nuclear color/opalescence, cortical, or posterior subcapsular lens opacity <1) according to the system of Lens Opacity Classification System III, and open iridocorneal angles on gonioscopy. Patients with myopic maculopathy (laquer cracks, retinal pigment epithelial atrophy, choroidal neovascularization, and macular hemorrhage), coexisting retinal diseases, diabetes, Parkinson’s disease, or optic neuropathies able to determine PERG abnormality were excluded.14,15
Only one eye of each patient who met the criteria mentioned above was randomly included in the study.
Spectral-Domain OCT, standard automated perimetry, and pattern electroretinogram examination procedures were the same used in previously published studies.12,13
As for ss-PERG, the mean values of amplitude (μV) and phase (πrad) of the 2ndH, obtained from the five blocks of events, were analyzed with the Fourier transform. The repeatability of the phase of the 2ndH was calculated as phase standard deviation (ssPERG SDph) across the five blocks of events, whereas the repeatability of the amplitude (ssPERG Amp) was not considered, because of the well-known habituation effect (Figures 1 and 2).16
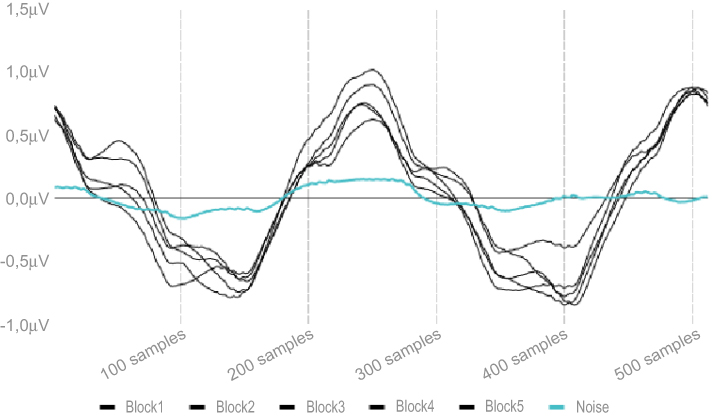 |
Figure 1 Five consecutive blocks of steady-state pattern electroretinogram (time domain – 512 samples). |
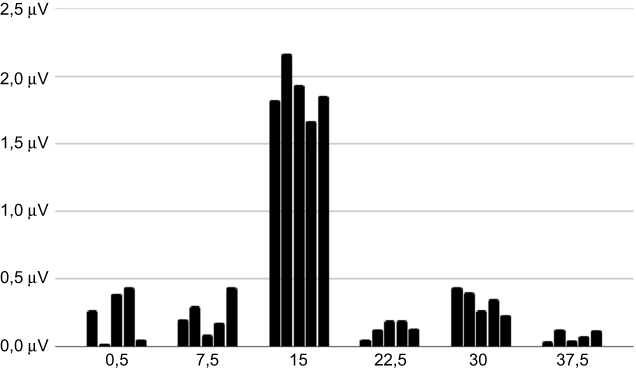 |
Figure 2 Five consecutive blocks of steady-state pattern electroretinogram (frequency domain – rps). |
Statistical analysis was performed using commercial software (MedCalc® 18.11). A P-value of ≤0.05 considered was statistically significant. This trial follows the tenets of the Declaration of Helsinki for human studies. The study was approved by both the Ethical Committees of the Brindisi Social Health District and University of Bari. Informed written consent was obtained by all subjects after the nature of the test, and possible risks were explained in detail.
Results
General demographics of the whole sample are reported in Table 1. Those of GP and NC patients have been reported previously.12,13 Those of MY group patients are reported in Table 2.
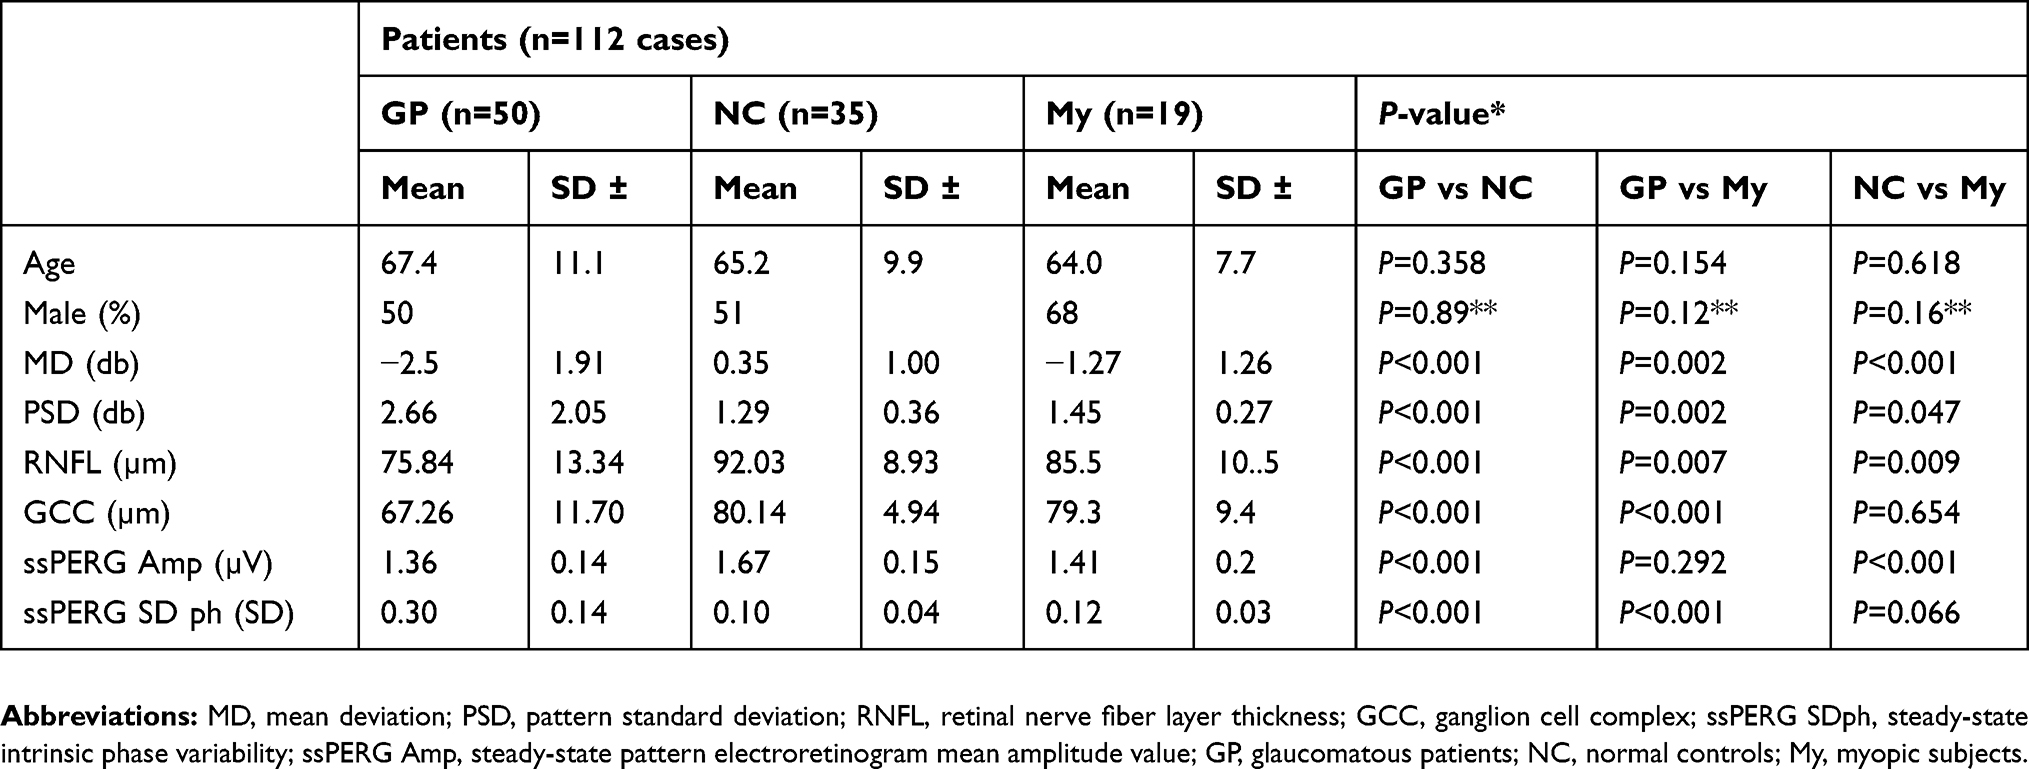 |
Table 1 Demographic and relevant ocular characteristic of study participants |
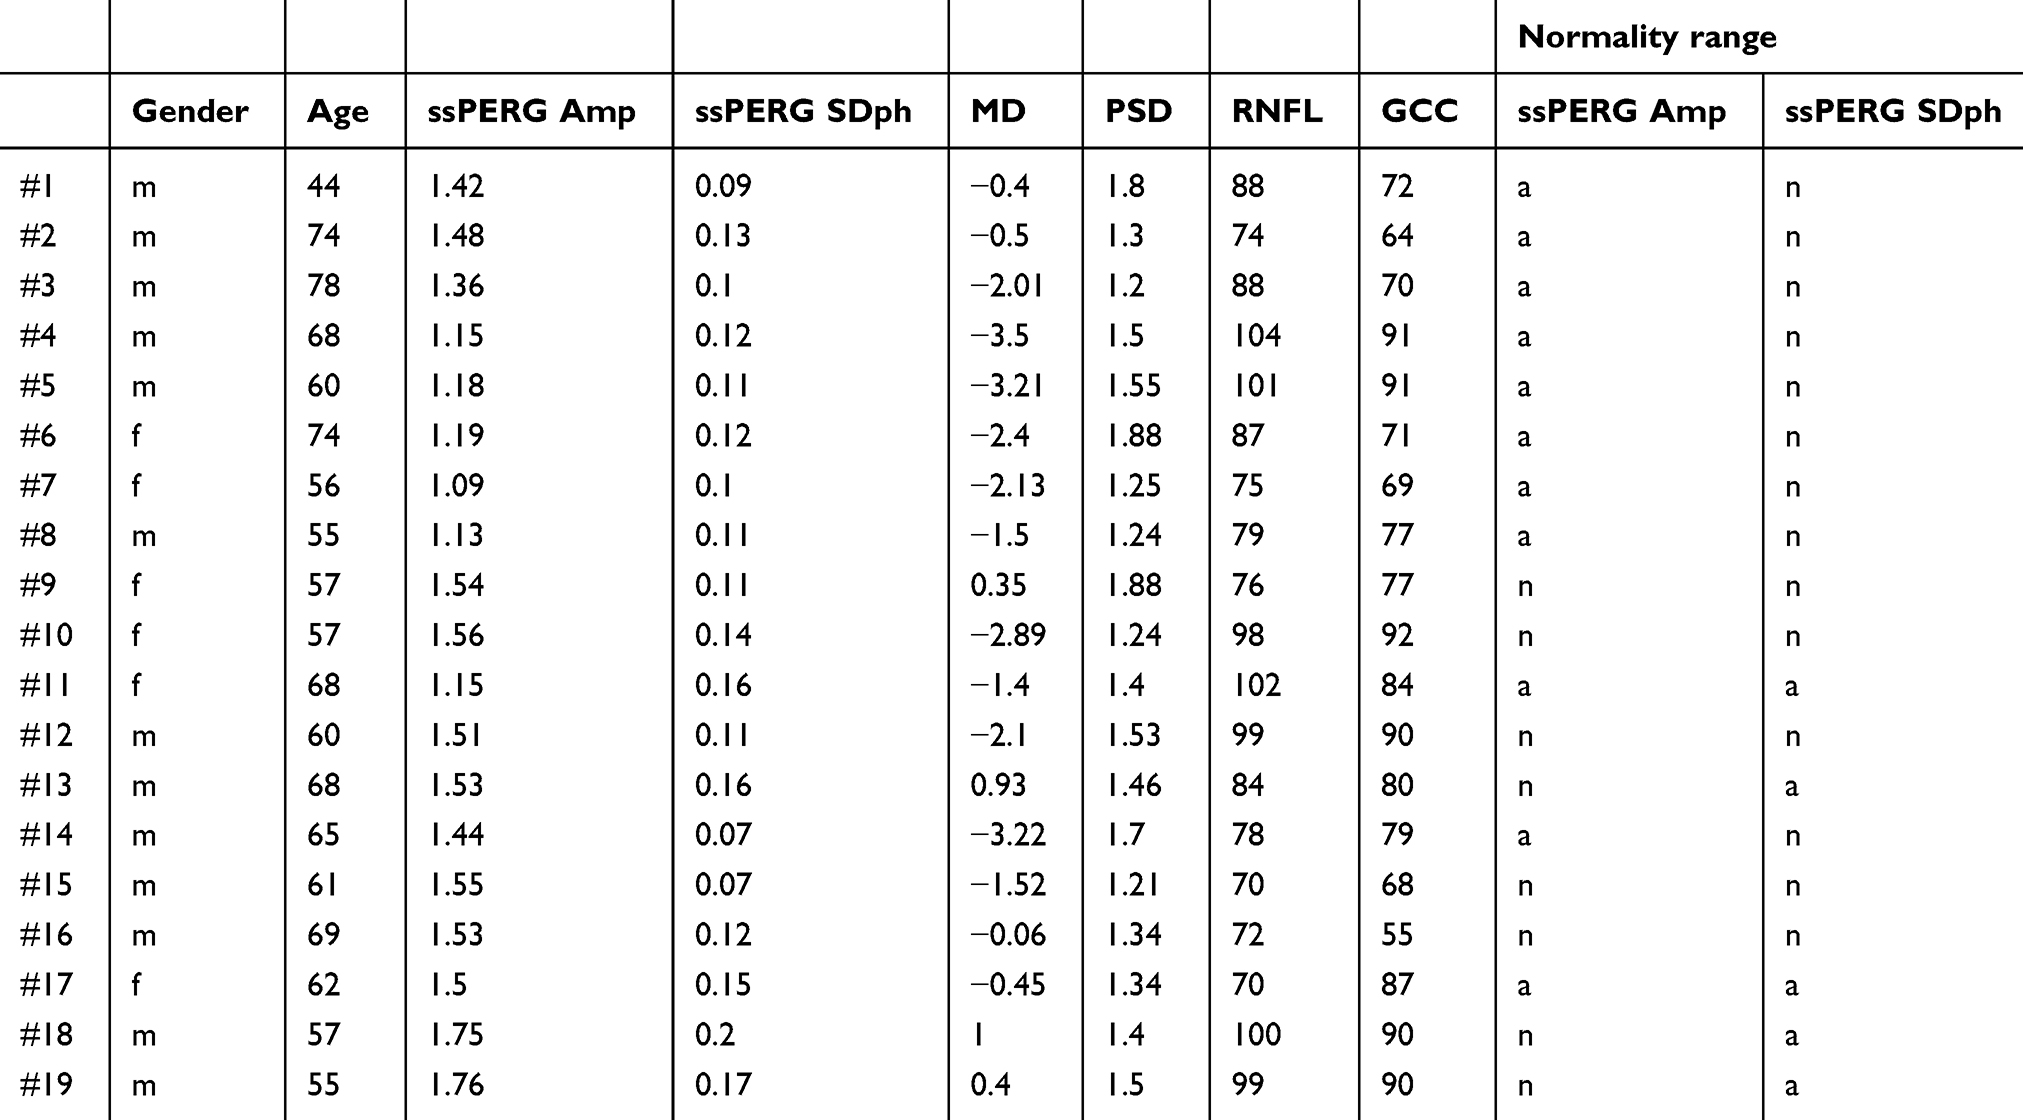 |
Table 2 Clinical characteristics of myopic subjects |
GP showed significant differences from the control group for mean deviation (MD), pattern standard deviation (PSD), retinal nerve fiber layer (RNFL), ganglion cell complex (GCC), ssPERG Amp, and ssPERG SDph; GP also showed significant differences from the MY group for all the parameters except for ssPERG Amp, which is reduced in both groups. In the comparison between NC and MY, there was a significant difference for all the parameters with the exception of GCC and ssPERG SDph, which are normal in both groups (Table 1).
In all groups considered as a whole, ssPERG Amp and ssPERG SDph showed good correlation with all parameters (Table 3).
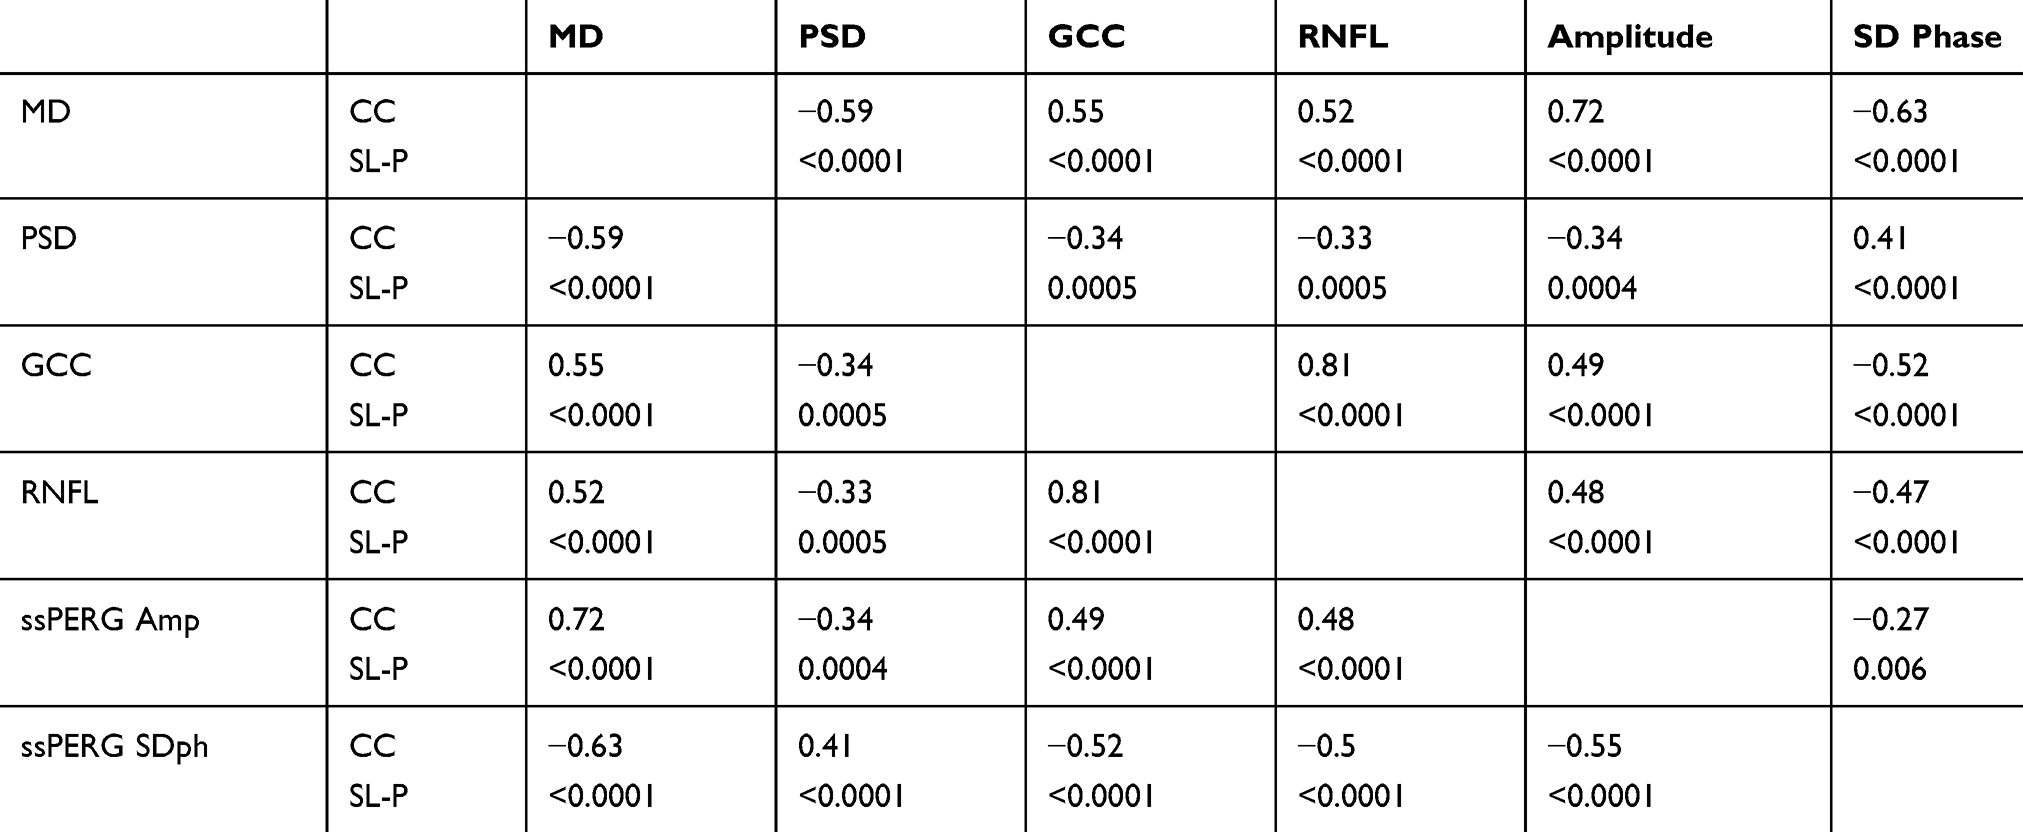 |
Table 3 Pearson correlation coefficient (CC) and significance level P (SL-P) between mean deviation (MD) pattern standard deviation (PSD), retinal Nerve fiber layer thickness (RNFL)*, ganglion cell complex (GCC)*, steady-state pattern electroretinogram mean amplitude value (ssPERG Amp)*, standard deviation of steady-state PERG phase (ssPERG SDph) in all participants |
In MY and GP groups, correlations study showed a weak, but positive correlation between MD and PERG amplitude, and also between GCL and RNFL thickness; all these parameters are reduced both in myopia and glaucoma (Table 4).
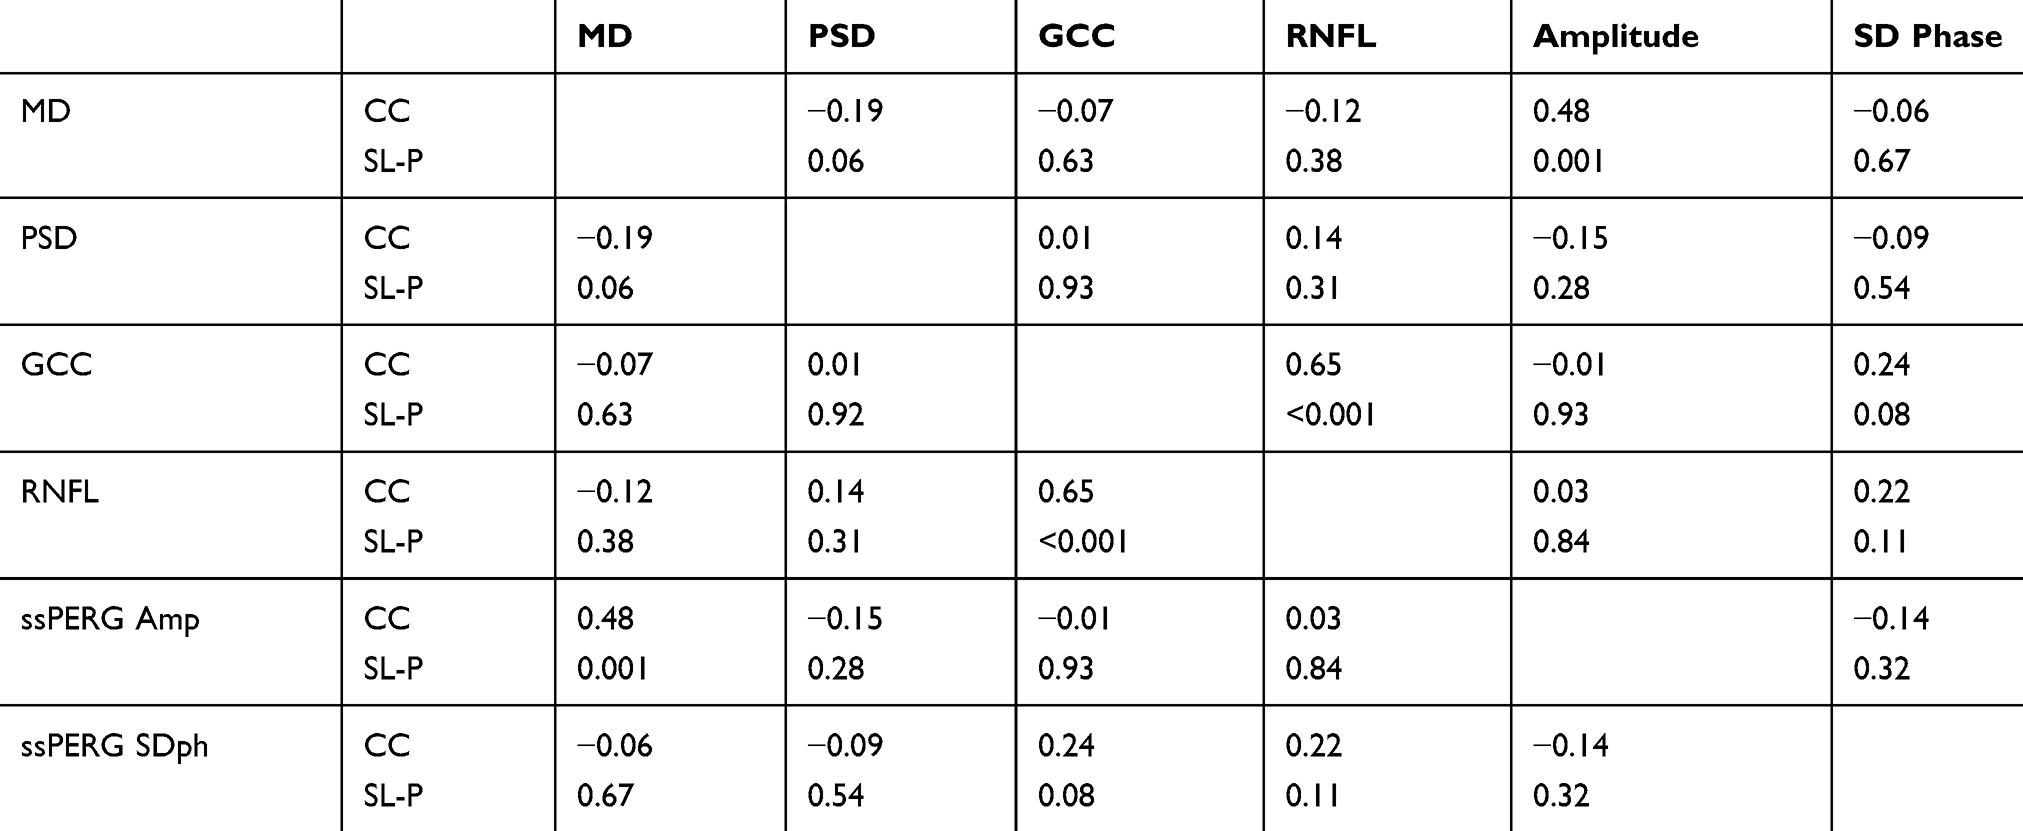 |
Table 4 Pearson correlation coefficient (CC) and significance level P (SL-P) between mean deviation (MD) pattern standard deviation (PSD), retinal nerve fiber layer thickness (RNFL)*, ganglion cell complex (GCC)*, steady-state pattern electroretinogram mean amplitude value (ssPERG Amp)*, standard deviation of steady-state PERG phase (ssPERG SDph) in myopic and glaucomatous patients |
As performed in a previously published studies12,13 we considered as pathologic a mean ssPERG Amp <1.5 µm, and a phase variability ssPERG SDph >0.15 SD. In GP group, ssPERG Amp showed a specificity of 82.1% (95% confidence interval [CI]I: 66.5–92.5). In MY group, ssPERG Amp was reduced in 58% of the patients. As a consequence of this, in GP and MY groups, considered as a whole, total specificity dropped to 70.69% (95% CI: 57.3–81.9). In the GP group, ssPERG SDph showed a specificity of 84.6% (95% CI: 69.5–91.1). In the MY group, ssPERG SDph showed abnormal results in three cases (15.7%). In both GP and MY groups, considered as a whole, ssPERG SDph total specificity increased from 84.6% to 93.1% (95% CI: 83.3–98.1, Table 5 Figures 3 and 4).
 |
Figure 3 Box-plot of amplitude values of steady-state perg in glaucoma patients, myopic subjects and normal control.Abbreviation: ssPERG Amp, steady-state pattern electroretinogram mean amplitude value. |
 |
Figure 4 Box-plot of intrinsic variability of the phase of steady-state perg in glaucoma patients, myopic subjects and normal control. Abbreviation: ssPERG SDph, standard deviation of steady-state pattern electroretinogram phase. |
 |
Table 5 (A) Receiver operating characteristics (ROCs) without myopic subjects. (B) ROCs myopic subjects included |
Discussion
The diagnosis of glaucoma in myopic eyes can be very difficult, since medium-to-high degree myopia can determine fundus alterations such as tilted discs, large optic discs with large excavations, peripapillary atrophy, and posterior staphyloma, which are able to bias the outcome of several diagnostic examinations.
As for the visual field, myopic eyes can show blind spot modifications, peripheral absolute defects, modifications of the global indices (MD, PSD).1 Arcuate scotomas and generalized depression have also been reported.2
There is no agreement among the published studies about the effect of myopia on OCT measurements (RNFL and GCC thickness). Some authors did not find any influence.17,18 On the contrary, several authors reported abnormal findings by OCT in myopic eyes, in particular, RNFL thinning6–10 and also GCC thinning.10 In other studies, GCC thickness was not found to be influenced by myopia.6–10 The reason for this apparent thinning of RNFL and GCC thickness has been suggested to be a magnification effect due to the greater axial length of the myopic eyes. Specific correction formula has been used to overcome this bias factor.6–8
Although many studies have shown that PERG, studying electrical activity of RGCs is able to discriminate between normal and early glaucoma patients, and also to predict the future developments of visual field defects and OCT alterations of RNFL and GCC thickness,19–27 it has also been reported that myopia can determine reduction of PERG amplitude, and that such effect is more pronounced as ocular axial length increases.11
Starting from the evidence that PERG amplitude can be reduced by non-specific (ie, non-glaucomatous) causes,11,28,29 whereas phase variations are not, we developed a test, that we called RE-PERG, based not on the absolute value of the phase, but on its intratest variability, assuming it to be a metabolic stress-test based not on the number of the ganglion cells, but on their functional state, that is, a test able to detect a pre-apoptotic synaptic dysfunction in glaucoma. In previously published works, we showed that RE-PERG is able to discriminate early glaucoma from normal patients, and also that it is not influenced by optic media opacities like cataract, which instead determine the reduction of PERG amplitude and, therefore, loss of specificity in discrimination between cataract patients and glaucoma patients.11,12
According to the outcome of the present study, myopia itself can determine alterations of visual field parameters, RNFL and GCC thickness measured by OCT, and also PERG amplitude. These findings are in agreement with previous studies.1–11
Considering only GP patients, ssPERG Amp and ssPERG SDph showed similar specificity (82.1% and 84.6%, respectively), but, as a consequence of myopia influence on PERG amplitude, by mixing GP and MY patients, the specificity of ssPERG Amp dropped to 70.69%, whereas ssPERG SDph specificity increased from 84.6% to 93.1%.
In the electrophysiological diagnosis of glaucoma, two paradigms are currently performed: Transient PERG and Steady-State PERG, the latter using a higher temporal frequency.
The morphology of the wave obtained is an aspect of the response of the bioelectric potential, which is due to both signal-to-noise ratio (type or position of the electrodes, gain, etc.) and the signal quality. Being a result of the average of the events acquired, morphology should be better as the repeatability of the events is greater. Increasing temporal frequency of the stimulus, in healthy patients the peaks obtained gradually approach each other until a sinusoidal wave is obtained. Therefore, if the events are not perfectly repeatable, the morphology of the sinusoidal wave will be altered. In RE-PERG, in which a very high number of events is used, the alterations of the morphology of the waves we found (ie, intrinsic phase variability) is, in our opinion, due to a real variability of the electrophysiological events, that is, a marker of neuronal performance impairment.
Conclusions
Intrinsic variations in the phase are little affected by non-specific (ie, non-glaucomatous) causes like myopia that instead cause a non-specific reduction of PERG amplitude. In our opinion, evaluation of intrinsic phase variability of 2ndH of ssPERG by means RE-PERG can help to discriminate inner retinal dysfunction in all doubtful cases.
Further studies are required: first, the procedure should be validated also in other laboratories to confirm our results; second, its reliability should be verified also in other conditions known as able to bias PERG amplitude (diabetic retinopathy); third, it must verify its predictive value in ocular hypertensive patients or glaucoma suspects in longitudinal studies; finally, it would be also helpful to verify the variations of the SD phase under therapy (both topical hypotensive and neuroprotective).
Disclosure
The authors report no conflicts of interest in this work.
References
1. Corallo G, Capris P, Zingirian M. Perimetric findings in subjects with elevated myopia and glaucoma. Acta Ophthalmol Scand Suppl. 1997;75(224):30–31.
2. Shoeibi N, Moghadas Sharif N, daneshvar R, et al. Visual field assessment in high myopia with and without tilted optic disc. Clin Exp Optom. 2017;100(6):690–694. doi:10.1111/cxo.12511
3. Nordmann J-P. OCT & Optic Nerve. Laboratoire Théa and Carl Zeiss Meditec France SAS Editors. 2014.
4. Kim NR, Lim H, Kim JH, et al. Factors associated with false positives in retinal nerve fiber layer color codes from spectral domain optical coherence tomography. Ophthalmology. 2011;118(9):1774–1781. doi:10.1016/j.ophtha.2011.01.058
5. Shoji T, Nagaoka Y, Sato H, et al. Impact of high myopia on the performance of SD-OCT parameters to detect glaucoma. Graefes Arch Clin Exp Ophthalmol. 2012;136:1843–1849.
6. Savini G, Barboni P, Parisi V, et al. The influence of axial length on retinal nerve fiber layer thickness and optic disc size measurements by spectral-domain OCT. Br J Ophthamol. 2012;96:57–61. doi:10.1136/bjo.2010.196782
7. Malakar M, ASkari S, Ashraf H, et al. Optical coherence tomography assisted retinal nerve fiber layer thickness profile in high myopia. J Clin Diagn Res. 2015;9(2):NC01–NC03. Epub 2015 Feb 1. doi:10.7860/JCDR/2015/9054.5565.
8. Bae S, Kang S, Feng C, et al. Influence of myopia on size of optic nerve head and retinal nerve fiber layer thickness measured by spectral domain optical coherence tomography. Korean J Ophthalmol. 2016;30(5):335–343. doi:10.3341/kjo.2016.30.5.335
9. Zhang Y, Wen W, Sun X. Comparison of several parameters in two optical coherence tomography systems for detecting glaucomatous defects in high myopia. Invest Ophthalmol Vis Sci. 2016;57:4910–4915. doi:10.1167/iovs.16-19104
10. Akcay B, Gunay B, Kardes E, et al. Evaluation of the ganglion cell complex and retinal nerve fiber layer in low, moderate, and high myopia: a study by RTVue spectral domain optical coherence tomography. Semin Ophthalmol. 2017;32(6):682–688. Epub 2016 Jul 12. doi:10.3109/08820538.2016.1170157.
11. Oner A, Gumus K, Arda H, et al. Pattern electroretinographic recordings in eyes with myopia. Eye Contact Lens. 2009;35(5):238–241. doi:10.1097/ICL.0b013e3181b343d9
12. Mavilio A, Scrimieri F, Errico D. Can variability of pattern ERG signal help to detect retinal ganglion cells dysfunction in glaucomatous eyes? Biomed Res Int. 2015;2015:1–11. Epub 2015 Jun 8. doi:10.1155/2015/571314
13. Mavilio A, Sisto D, Ferreri P, et al. RE-PERG, a new procedure for electrophysiologic diagnosis of glaucoma that may improve PERG specificity. Clin Ophtalmol. 2017;11:209–218. doi:10.2147/OPTH.S122706
14. Lam BL, Feuer WJ, Abukhalil F, et al. Leber hereditary optic neuropathy gene therapy clinical trial recruitment: year 1. Arch Ophthalmol. 2010;128(9):1129–1135. doi:10.1001/archophthalmol.2010.201
15. Bodis-Wollner I. Visual electrophysiology in Parkinson’s disease: PERG, VEP and visual P300. Clin Electroencephalogr. 1997;28(3):143–147.
16. Porciatti V, Sorokoc N, Buchser W. Habituation of retinal ganglion cell activity in response to steady state pattern visual stimuli in normal subjects. Invest Opththalmol Vis Sci. 2005;46:1296–1302. doi:10.1167/iovs.04-1242
17. Kim N, Lee E, Seong G, et al. Comparing the ganglion cell complex and retinal nerve fibre layer measurements by Fourier domain OCT to detect glaucoma in High myopia. Br J Ophthalmol. 2011;95:1115–1121. doi:10.1136/bjo.2010.182493
18. Szigeti A, Tatrai E, Varga B, et al. The effect of axial length on the thickness of intraretinal layers of the macula. Plos One. 2015. doi:10.137/journal.pone.0142383
19. Maffei L, Fiorentini L. Electroretinographic responses to alternating gratings before and after section of the optic nerve. Science. 1981;211(4485):953–955. doi:10.1126/science.7466369
20. Zrenner E. The physiological basis of the pattern electroretinogram. Prog Retin Res. 1990;9:427–464. doi:10.1016/0278-4327(90)90014-9
21. Ventura LM, Sorokac N, Los Santos NR, et al. The relationship between retinal ganglion cell function and retinal nerve fiber thickness in early glaucoma. Invest Opththalmol Vis Sci. 2006;47(9):3904–3911. doi:10.1167/iovs.06-0161
22. Bach M, Hoffmann MB. Update on the pattern electroretinogram in glaucoma. Optom Vis Sci. 2008;85(6):386–395. doi:10.1097/OPX.0b013e318177ebf3
23. Pfeiffer N, Bach M. The pattern-electroretinogram in glaucoma and ocular hypertension. A cross-sectional and longitudinal study. Ger J Ophthalmol. 1992;1(1):35–40.
24. Bowd C, Tafreshi A, Vizzeri G, et al. Repeatability of pattern electroretinogram measurements using a new paradigm optimized for glaucoma detection. J Glaucoma. 2009;18(6):437–442. doi:10.1097/IJG.0b013e31818c6f44
25. Bowd C, Tafreshi A, Zangwill LM, et al. Pattern electroretinogram association with spectral domain-OCT structural measurements in glaucoma. Eye. 2011;25(2):224–232. doi:10.1038/eye.2010.203
26. Bowd C, Vizzeri C, Tafreshi A, et al. Diagnostic accuracy of pattern electroretinogram optimized for glaucoma detection. Ophthalmology. 2009;116(3):437–443. doi:10.1016/j.ophtha.2008.10.026
27. Tafreshi A, Racette L, Weinreb RN, et al. Pattern electroretinogram and psychophysical tests of visual function for discriminating between healthy and glaucoma eyes. Am J Ophthalmol. 2010;149(3):488–495. doi:10.1016/j.ajo.2009.09.027
28. Ventura LM, Porciatti V, Ishida K, et al. Pattern electroretinogram abnormality and glaucoma. Ophthalmology. 2005;112(1):10–19. doi:10.1016/j.ophtha.2004.07.018
29. Ventura LM, Golubev I, Feuer WJ, Porciatti V. The PERG in diabetic glaucoma suspects with no evidence of retinopathy. J Glaucoma. 2010;19(4):243–247.
30. DeLong ER, DeLong DM, Clarke-Pearson DL. Comparing the areas under two or more correlated receiver operating characteristic curves: a nonparametric approach. Biometrics. 1988;44(3):837–845.
 © 2019 The Author(s). This work is published and licensed by Dove Medical Press Limited. The
full terms of this license are available at https://www.dovepress.com/terms
and incorporate the Creative Commons Attribution
- Non Commercial (unported, 3.0) License.
By accessing the work you hereby accept the Terms. Non-commercial uses of the work are permitted
without any further permission from Dove Medical Press Limited, provided the work is properly
attributed. For permission for commercial use of this work, please see paragraphs 4.2 and 5 of our Terms.
© 2019 The Author(s). This work is published and licensed by Dove Medical Press Limited. The
full terms of this license are available at https://www.dovepress.com/terms
and incorporate the Creative Commons Attribution
- Non Commercial (unported, 3.0) License.
By accessing the work you hereby accept the Terms. Non-commercial uses of the work are permitted
without any further permission from Dove Medical Press Limited, provided the work is properly
attributed. For permission for commercial use of this work, please see paragraphs 4.2 and 5 of our Terms.