Back to Journals » Diabetes, Metabolic Syndrome and Obesity » Volume 8
Randomized, double-blind, placebo-controlled, clinical study on the effect of Diabetinol® on glycemic control of subjects with impaired fasting glucose
Authors Evans M, Judy W, Wilson D, Rumberger J, Guthrie N
Received 17 December 2014
Accepted for publication 23 February 2015
Published 25 June 2015 Volume 2015:8 Pages 275—286
DOI https://doi.org/10.2147/DMSO.S79450
Checked for plagiarism Yes
Review by Single anonymous peer review
Peer reviewer comments 3
Editor who approved publication: Professor Ming-Hui Zou
Malkanthi Evans,1 William V Judy,2 Dale Wilson,3 John A Rumberger,4 Najla Guthrie,1
1KGK Synergize Inc., London, ON, Canada; 2SIBR Research Inc., Bradenton, FL, USA; 3London Health Sciences Center, University of Western Ontario, London, ON, Canada; 4Princeton Longevity Center, Princeton, NJ, USA
Background: This study investigated the efficacy of Diabetinol® in people with diabetes on medication but not meeting the American Association of Clinical Endocrinologists and American Diabetes Association glycemic, blood pressure, and lipid targets.
Subjects and methods: Fifty subjects, aged 18–75 years, with fasting blood glucose ≤15.4 mmol/L, hemoglobin A1c levels ≤12%, and a body mass index between 25 and 40 kg/m2, were enrolled in a 24-week, randomized, double-blind, placebo-controlled, parallel study. Diabetinol® or placebo was administered as 2×525 mg capsules/day.
Results: In the Diabetinol® group, 14.3% versus 0% in the placebo group, 33.3% versus 15.4% in placebo, 20.0% versus 12.5% in placebo, and 83.3% versus 60% in placebo achieved the American Association of Clinical Endocrinologists and American Diabetes Association targets for hemoglobin A1c, low-density lipoprotein, total cholesterol, and systolic blood pressure, respectively. There was no difference in the maximum concentration (Cmax) of serum glucose or area under the curve (AUC)0–240 minutes. The time to Cmax was longer for participants on Diabetinol® than placebo group at week 12 (P=0.01). Fasting blood glucose increased from baseline to week 24 in both groups; however, this increase was 14.3 mg/dL lower in the Diabetinol® group versus placebo. The Diabetinol® group showed an increase of 5.53 mg/dL in fasting insulin at week 12 (P=0.09) and 3.2 mg/dL at week 24 (P=0.41) over and above the placebo group. A decrease of 1.5% in total cholesterol, 5.8% in low-density lipoprotein, and a 1.6% increase in high-density lipoprotein concentrations were seen in the Diabetinol® group. Diabetinol® improved 6-month oral glucose tolerance test and 2-hour postprandial glucose profiles in participants between 40 and 60 years of age.
Conclusion: The current study suggests a role for Diabetinol® as an adjunctive therapy for glycemic maintenance and for decreasing the risk of diabetes-associated comorbidities in type 2 diabetic patients on conventional therapies.
Keywords: diabetes, insulin, citrus flavonoids, limonoids, hyperlipidemia, hypercholesterolemia, adjunctive therapy
Introduction
In the United States, 26 million people suffer from diabetes with 1.3 million more being diagnosed with the disease each year.1,2 An aging population, rising obesity rates, and an increasingly sedentary lifestyle have been attributed to the increase in the incidence and prevalence rates. Ten percent of adults and more than 25% of the population over 65 years of age are living with diabetes.1 Furthermore, the rapid increase of type 2 diabetes mellitus (T2DM) in people 30–39 years of age as well as children and adolescents in recent years is alarming.2 Global prevalence rates are expected to increase from 6.4% or 285 million in 2010 to 7.7% or 439 million people by 2030.3
Clinical treatment goals for T2DM are directed at lowering blood glucose levels in order to prevent diabetes-related complications.4 Recently, the use of pharmacotherapies and their negative impact on the cardiovascular system have caused concern with the available treatment modalities. An increased risk of myocardial ischemia has been identified with thiazolidinedione use5 and sulfonylureas have been linked to an increased risk of cardiovascular disease (CVD).6 Complicating the issue, the ACCORD study reported that lowering blood glucose to normal levels was associated with increased mortality,7 although the ADVANCE study did not report similar results.8 Such conflicting outcomes may suggest that treatment strategies for T2DM are not fully understood. This raises the question as to whether lowering blood glucose level is sufficient to provide clinical merit in the treatment algorithm for T2DM. Several strategies currently include metformin in the management algorithm for T2DM with mono-, di-, and tri-therapies needing to be added to the algorithm.9 Therapies involving existing pharmaceuticals have limited efficacy or tolerability and show significant side effects.10 Many of the side effects of pharmaceuticals are thought to be associated with nutritional deficiencies with long-term use, ultimately resulting in a cascade of biochemical changes due to drug-associated nutrient depletion.11 In the United States, metformin is currently the most common antidiabetic drug with over 30 million prescriptions filled annually; however, long-term metformin treatment is associated with complications.12,13
The “State of Diabetes in America” report by the American Association of Clinical Endocrinologists (AACE) on diabetes management found that despite advances in diabetes care, blood sugar levels were poorly controlled, putting diabetics at an increased risk for disease-related complications.14 The report stated that two out of three Americans with T2DM did not achieve the AACE recommended glycosylated hemoglobin A1c (HbA1c) goal of ≤6.5%14 which directly impacts CVD risk factors. Furthermore, the 1999–2000 National Health and Nutrition Survey reported that only 7.3% of all adults with T2DM were within the acceptable range for the CVD risk factors, HbA1c, blood pressure, and total cholesterol (TC).15,16 These results suggest that novel treatment strategies are required for more effective control of T2DM and to alleviate the risk of associated comorbidities.
Nutraceutical products hold promise as potential adjunctive therapies for patients with diabetes. Combination therapies that consist of pharmaceutical drugs and nutraceutical products may provide a new treatment algorithm that would be beneficial to diabetic patients who do not respond to drug management alone. In fact, the AACE acknowledges the importance of nutritional medicine and identifies “complementary” or “integrative nutritionals” as products that may be used in combination with US Food and Drug Administration (FDA)-approved therapies.17 Nutraceutical products have been reported to reduce hyperglycemia and lipid disorders in individuals with T2DM or with a predisposition to T2DM.18–20 While conventional treatments such as insulin and other pharmacological interventions are effective in managing diabetes, microvascular complications and atherothrombosis are not prevented and can cause damage to the kidney, retina, and lens.21 Complementary and alternative medicine (CAM) has gained popularity as consumers seek alternatives to conventional pharmacological medications.22 According to a recent survey, 75% of Canadians with diabetes use alternative medicines and supplements in addition to conventional treatment,23 although CAMs have not been thoroughly tested in randomized controlled trials as concomitant therapies for FDA-approved drugs.
Citrus flavonoids (eg, naringin, hesperidin, nobiletin, and tangeretin) encompass several subgroups of flavonoids that have lipid-lowering, antidiabetic, anti-inflammatory, and antihypertensive properties.24 In animal models of metabolic syndrome and diabetes, citrus flavonoids not only improve glucose tolerance and insulin sensitivity but also reduce plasma and/or hepatic cholesterol and triglyceride levels,25–29 suggesting that they could be beneficial in controlling diabetes and comorbid conditions such as CVD. In fact, a recent study showed that flavonoid intake was associated with a lower risk of death from CVD.30 Unfortunately, administration of the citrus flavonoid, naringin, to hypercholesterolemic patients only decreased plasma low-density lipoprotein cholesterol (LDL-C) levels while having no effect on triglyceride and high-density lipoprotein cholesterol (HDL-C) levels.31 Hesperidin (800 mg) also failed to have an effect.32 Several variables (dose, flavonoid type, etc) likely account for these less than optimal results in humans; however, it is possible that citrus flavonoids alone are not sufficient to attenuate the biochemical changes associated with diabetes. Plant-derived molecules, such as tocotrienols33,34 and limonoids,35 have also been shown to attenuate hyperlipidemia and hypercholesterolemia in animal models. The pathways involved in regulating metabolism, triglyceride, and cholesterol levels are complex, and it is possible that a product consisting of tocotrienols, limonoids, and a broader range of flavonoids could act synergistically with conventional antidiabetic medications to provide better glycemic, cholesterolemic, and triglyceridemic control. In support of this, it was previously shown that coadministration of tocotrienol and insulin was more effective than either treatment alone in elevating plasma insulin and reducing plasma glucose in the streptozotocin-induced diabetic rat.33
The nutraceutical product, Diabetinol®, is rich in citrus flavonoids, limonoids, and tocotrienols and holds promise as an adjunctive therapy in T2DM. In a previous study, Diabetinol® supplementation for 3 months in subjects with mild impaired fasting glucose showed significantly reduced peak hyperglycemic response, TC, and LDL-C levels and a trend toward decreased HbA1c levels.36 We hypothesized that the results of the previous study could be extended, to subjects with greater severity of impaired fasting glucose, with longer supplementation of Diabetinol®. Thus, the objective of this study was to evaluate the antidiabetic and antihyperlipidemic potential of Diabetinol® in a 6-month study in people with diabetes, on medication, but not meeting the AACE and American Diabetes Association (ADA) targets of control.
Methods
Study participants
Fifty subjects between 18 and 75 years of age with a fasting blood glucose (FBG) concentration ≤15.5 mmol/L (up to 280 mg/dL), HbA1c ≤12%, and a body mass index (BMI) of 25–40 kg/m2 were recruited through local advertisements and the clinic’s electronic patient database. Subjects were permitted to continue prescribed medications for the control of diabetes and CVD. Subjects were excluded from the study if they were pregnant or breastfeeding, on medications affecting weight, taking insulin, had a history of heart disease, cancer, alcohol or drug abuse, had participated in a clinical trial within 30 days prior to randomization, had food restrictions, or allergies or intolerances to the investigational product. All study investigations were conducted in accordance with the Declaration of Helsinki and in compliance with the International Conference on Harmonisation Guidelines for Good Clinical Practices. This study was reviewed and approved by IntegReview Ethical Review Board (Austin, TX, USA). All subjects provided written informed consent prior to any study procedures being performed.
Study design
The study was a randomized, double-blind, placebo-controlled, parallel study conducted at SIBR Research, Inc. (West Bradenton, FL, USA) over a 24-week period.
At the screening visit, inclusion and exclusion criteria, medical history, and concomitant medications were reviewed. Heart rate, blood pressure, height, weight, and hip and waist circumference were measured and BMI calculated. Fasting blood was collected for the determination of complete blood count, electrolytes (Na+, K+, Cl–), kidney function (creatinine and creatinine kinase), liver function (aspartate aminotransferase, alanine transaminase, and bilirubin), glucose, HbA1c, and lipid profile (TC, HDL-C, LDL-C, and triglycerides). Female participants also provided a urine sample for pregnancy testing.
At baseline and at all other visits (weeks 4, 8, 12, 16, 20, and 24) blood pressure and heart rate were assessed, anthropometric measurements recorded, and BMI calculated. Fasting blood was collected for the determination of glucose, insulin, and HbA1c. An oral glucose tolerance test (OGTT) was conducted on all participants at baseline, 12 weeks, and 24 weeks, in which participants consumed a 100 g glucose beverage over a 10-minute period. Blood samples were collected at 30, 60, 120, 180, and 240 minutes post-glucose consumption and analyzed for glucose and insulin levels. Fasting blood was also collected at weeks 12 and 24 for the determination of complete blood count, electrolytes, kidney function, liver function, glucose, HbA1c, and lipid profile.
Participants maintained a diary for the duration of the study period to record concomitant therapies and adverse events (AEs). The diaries were reviewed at each study visit.
Randomization and blinding
Fifty subjects were eligible to participate in the study. Participants were randomized in a 1:1 ratio to receive either Diabetinol® or placebo in five blocks of ten, using a computer-generated randomization list. The test products were similar in shape, size, weight, and color, and packed in identical bottles that could only be identified by the randomization number to maintain blinding. Each randomization number had a corresponding sealed envelope containing the identity of the test product, and the investigator was to open the envelope only in an emergency where it became necessary to unblind the subject. All envelopes remained sealed during this study.
Investigational product
Diabetinol® (a 525 mg citrus bioflavonoid complex formulation/capsule) and placebo (525 mg of microcrystalline cellulose/ capsule) were encapsulated by Innovative Health Products (Largo, FL, USA). The active ingredients of Diabetinol® included mainly nobiletin (49%) and tangeretin (13%), together with limonoids, tocotrienols, and vitamin E. Participants were instructed to take two capsules per day, one capsule in the morning and one in the evening, with food for 24 weeks in addition to their prescribed medications. Unused products were returned at each study visit to calculate compliance.
Statistical analysis
The per-protocol analysis included participants who completed all visits of the 24-week study, and were compliant to the protocol. Data are presented as mean (± standard deviation, SD) for those participants who completed the study; descriptive statistics were calculated for each study group and statistical comparisons of glucose and HbA1c were performed using the analysis of covariance (ANCOVA) adjusting for baseline values. Statistical comparisons for baseline characteristics, lipid profiles, insulin response, and measures of safety (hematology, blood chemistry, biometrics, and vital signs) were performed using the analysis of variance. Comparisons of area under the glucose and insulin concentration curves and maximum concentration of serum glucose (Cmax) were made using data that were log-transformed prior to statistical comparisons. Within-group comparisons were made using a paired t-test. Due to the exploratory nature of this study, no alpha control was used. Differences were considered significant at P≤0.05.
The participants were divided into two age-related subgroups in order for OGTT curves to be compared while controlling for age-related differences.37,38 The subgroups consisted of participants between 40 and 60 years and those greater than 60 years of age. Between-group statistical comparisons of FBG and 2-hour postprandial (PP) glucose were performed using ANCOVA adjusting for baseline values, and within-group comparisons were made using a paired t-test.
The safety analysis was based on all randomized participants who were known to have taken at least one dose of the experimental or placebo product. Participants that did not meet the AACE/ADA-recommended goals at baseline for diabetes treatment (ie, reduction of CVD risk factors and diabetes control) were reassessed at 24 weeks and the proportion of participants that had achieved the recommended goals were identified and categorized accordingly.
Results
The disposition of the participants for the study is shown in Figure 1. There were no differences in baseline characteristics among the 50 participants that were randomized. Thirty-four participants completed the trial and participant baseline characteristics were similar between groups (Table 1). There were 16 withdrawals during the study (Figure 1); however, the number of withdrawals were not significant between groups (P=0.36). Anthropometric measures (weight, BMI, waist circumference, hip circumference, and waist-to-hip ratio) were consistent across both groups from baseline to week 24. Vital signs (systolic blood pressure, diastolic blood pressure, and heart rate) were not significantly different between the Diabetinol® and placebo groups after 24 weeks of supplementation (data not shown).
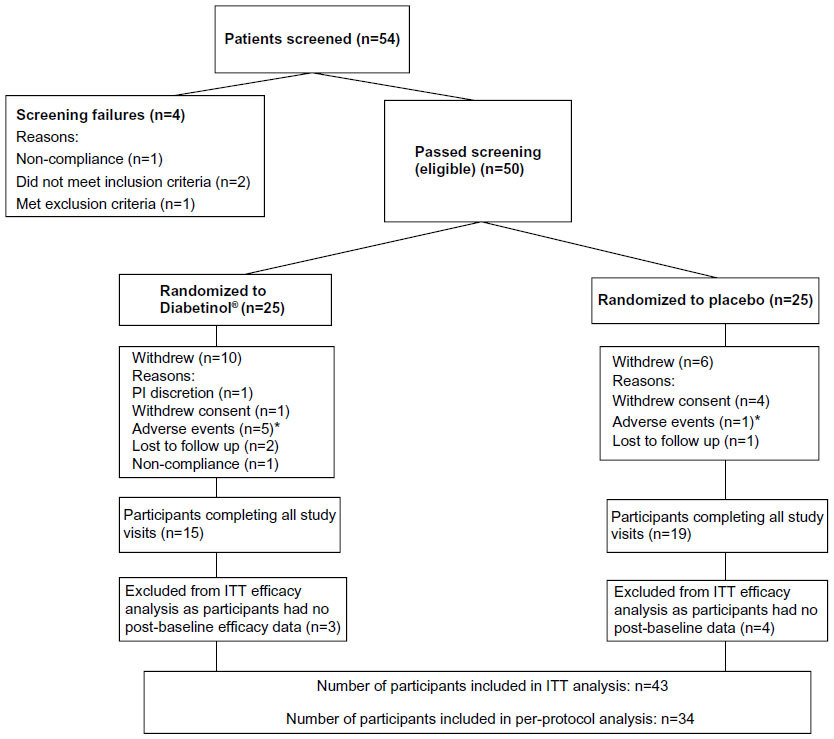 | Figure 1 Disposition of participants in this study. |
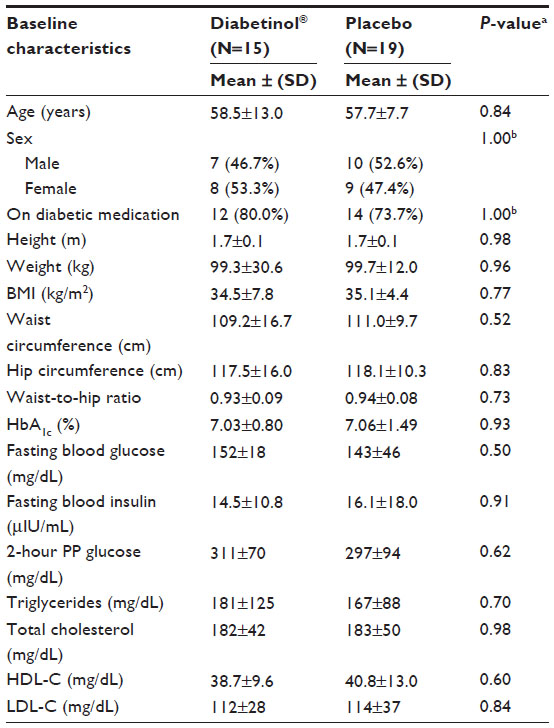 | Table 1 Baseline characteristics of study participants that completed the 24-week study |
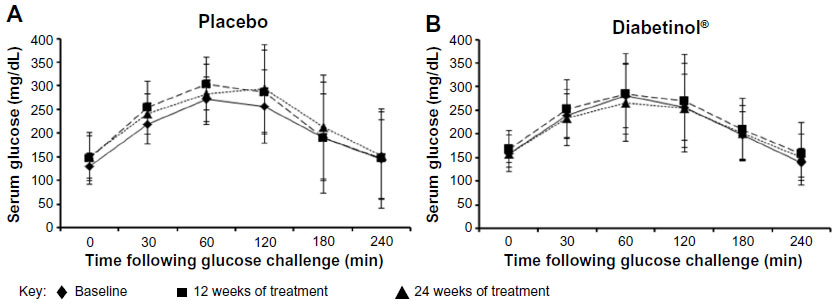
The glycemic parameters of participants at baseline, weeks 12 and 24 are presented in Table 2. Glucose tolerance tests at baseline, week 12, and week 24 demonstrated a peak in blood glucose at 120 minutes, with levels remaining above fasting levels at 240 minutes (Figure 2A and B). Both groups showed a mean increase in area under the curve (AUC)(0–240 minutes) and Cmax from baseline to weeks 12 and 24; however, there were no significant between-group differences in the Cmax (all P>0.90) or AUC(0–240 minutes) (all P>0.60) at baseline, week 12 or 24. The time to reach Cmax (Tmax) was on average 32.8 minutes longer for participants on Diabetinol® than placebo at week 12 (95% confidence interval [CI] [8.0, 57.6]; P=0.01) but this difference was not sustained through week 24 (95% CI [–19.2, 28.7]; P=0.70).
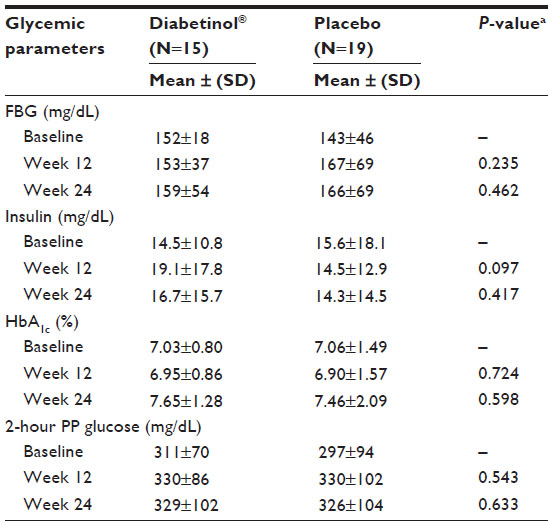 | Table 2 Glycemic parameters of study participants that completed the 24-week study |
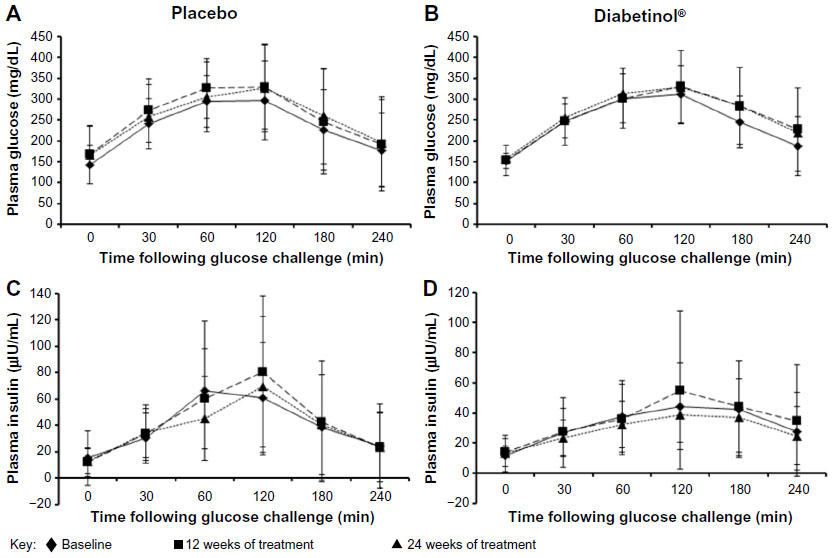 | Figure 2 Four-hour postprandial serum glucose and insulin levels after supplementation with placebo or Diabetinol®. |
FBG increased from baseline to week 24 in both groups; however, this increase was, on average, 14.3 mg/dL lower in the Diabetinol® group compared to placebo (95% CI [−23.3, 51.9]; P=0.46) (Figure 3). The within-group increase in FBG in the placebo group showed a trend toward significance at week 12 (95% CI [−3.3, 51.3]; P=0.08), and reached significance at week 24 (95% CI [0, 46.1]; P=0.05) (Figure 3A).
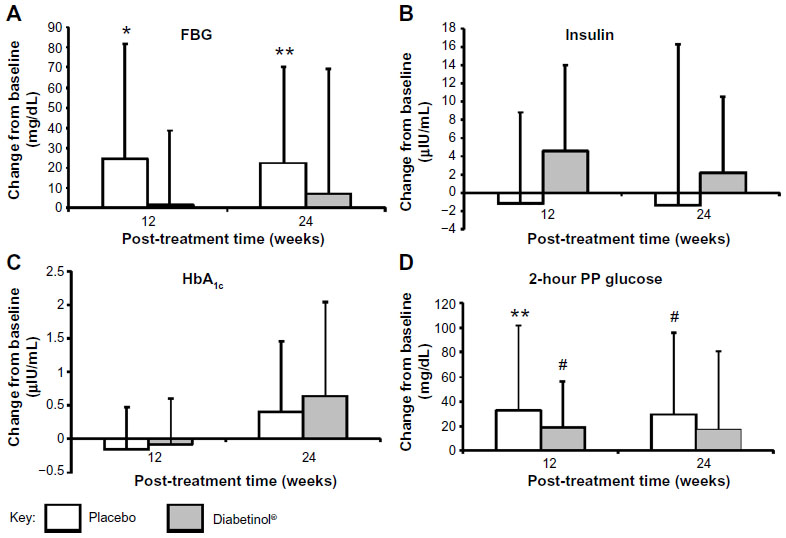 | Figure 3 Change from baseline in glycemic parameters after supplementation with placebo or Diabetinol®. |
After 24 weeks of supplementation, the 4-hour insulin AUC showed smaller excursions from baseline in the Diabetinol® group, which was not seen in the placebo (Figure 2C and D). Participants on Diabetinol® had an increase of 5.53 mg/dL in fasting insulin at week 12 (95% CI [–1.0, 12.1]; P=0.09) and 3.2 mg/dL at week 24 (95% CI [–4.7, 11.1]; P=0.41) over and above the placebo group (Table 2). As well, participants on Diabetinol® had an increase of 0.08% in HbA1c at week 12 (95% CI [–0.37, 0.54]; P=0.72) and 0.23% at week 24 (95% CI [–0.64, 1.09]; P=0.59) over and above the placebo group (Table 2). The within-group changes were not significant between groups for either fasting insulin (all P>0.40) (Figure 3B) or HbA1c (all P>0.60) at weeks 12 or 24 (Figure 3C).
A significant within-group increase of 33 mg/dL in 2-hour PP glucose concentration was seen in the placebo group at week 12 (95% CI [0, 66.6]; P=0.05), with a trend toward an increase at week 24 (of 29 mg/dL, 95% CI [–2.5, 60.5]; P=0.07) (Figure 3D). A trend in the within-group change was also seen in the Diabetinol® group with an increase of 19 mg/dL at week 12 (95% CI [–2.0, 40]; P=0.07), but the increase of 18 mg/dL at week 24 was not significant (95% CI [–15.6, 51.6]; P=0.30) (Figure 3D).
A subgroup investigation of the individual OGTT curves of participants over 60 years of age found that the profiles did not show the characteristic increase and subsequent decrease of a glucose challenge (data not shown). Participants between 40 and 60 years of age presented with characteristic profiles, with those on placebo showing greater OGTT excursions from baseline at weeks 12 and 24 (Figure 4A). In contrast, participants on Diabetinol® presented with lesser excursions from baseline at weeks 12 and 24 (Figure 4B). The placebo group had higher average fasting glucose of 6.6 mg/dL (95% CI [−55.9, 69.1]; P=0.82) than the Diabetinol® group at week 12 which increased further to 18.8 mg/dL (95% CI [−30.3, 68.0]; P=0.43) by week 24. The 2-hour PP glucose concentrations of the placebo group were 18.2 mg/dL (95% CI [–53.9, 90.4]; P=0.59) and 39.4 mg/dL (95% CI [–37.8, 111.5]; P=0.25) higher than the Diabetinol® group at weeks 12 and 24, respectively.
 | Figure 4 Four-hour postprandial serum glucose levels after supplementation with placebo or Diabetinol®. |
The lipid panel (triglycerides, TC, HDL-C, and LDL-C) improved for participants in the Diabetinol® group when compared to the placebo group. There were decreases in TC (−2.7 mg/dL, 95% CI [−17.7, 12.3]; P=0.71) and LDL-C (−6.5 mg/dL, 95% CI [−16.6, 3.5]; P=0.19) and an increase in HDL-C (0.7 mg/dL, 95% CI [–2.7, 4.1]; P=0.68) in the Diabetinol® group from baseline to week 24 (Figure 4). In contrast, increases in TC (19.8 mg/dL, 95% CI [6.8, 32.8]; P<0.01) and LDL-C (6.1 mg/dL, 95% CI [–5.4, 17.7]; P=0.28) and a decrease in average HDL-C (–1.9 mg/dL, 95% CI [–5.9, 2.1]; P=0.31) were seen in the placebo group (Figure 5). Although triglyceride concentration increased in both groups, there was a larger increase (47.9 mg/dL, 95% CI [–26.7, 122.5]; P=0.22) in the placebo group over and above the Diabetinol® group; however, the difference between the groups was not significant.
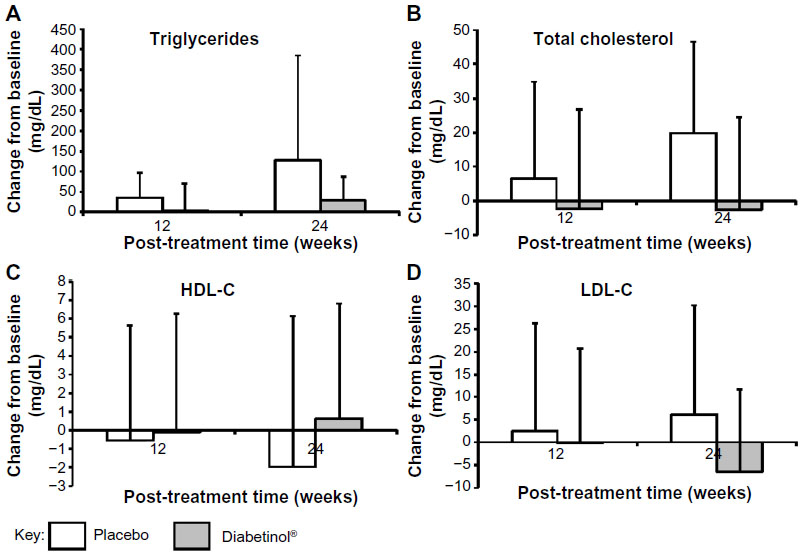 | Figure 5 Change from baseline in blood lipid parameters after supplementation with placebo or Diabetinol®. |
A greater proportion of subjects in the Diabetinol® group (47%) were above AACE and ADA target levels at baseline compared to those in the placebo group (21%). Of the participants that did not meet the AACE/ADA-recommended targets at baseline for diabetes treatment, the recommended goal for HbA1c (≤7%) was achieved by 14.3% of Diabetinol®-treated participants after 24 weeks versus 0% in the placebo group. Thirty-three percent of the participants on Diabetinol® achieved the recommended LDL ≤100 mg/dL versus 15.4% in the placebo group. Twenty percent of participants on Diabetinol® achieved the recommended TC levels ≤200 mg/dL versus 12.5% receiving placebo. Of the participants on Diabetinol®, 83.3% achieved the recommended systolic blood pressure ≤130 mmHg versus 60% in those on placebo.
There were no differences between the groups with respect to any laboratory or clinical measures of safety including complete blood count, electrolytes, and kidney or liver function at any point during the study. A total of five AEs were assessed by the investigator as being possibly or probably related to treatment, four in the Diabetinol® group and one in the placebo group (nausea). Three of the four AEs in the Diabetinol® were reported by one participant who had diarrhea and one person reported indigestion. Test product was discontinued for the two participants reporting diarrhea and they were withdrawn from the study.
Discussion
The current treatment algorithm for type 2 diabetes falls short of meeting AACE and ADA targets for patients. A recent consensus report on diabetes urges future research to allow and account for the complexity and heterogeneity encountered in these populations in order to address AACE and ADA treatment targets.39 Broadening inclusion criteria for randomized clinical trials to include subjects with multiple comorbidities and comparative effectiveness evidence from “real world” populations are encouraged and recommended. Most available glycemic control treatments have been used in combination to lower blood glucose in individuals with T2DM. A rational selection for effective diabetes management would include therapies which lower glucose production, increase insulin levels, and control CVD risk. CAM therapies commonly used to treat type 2 diabetes include cinnamon, green tea, bitter melon, fenugreek, fiber, and gymnema. However, a recent review of the literature found a paucity of evidence evaluating the effects of these therapies on biomarkers that are used as targets by physicians in treating diabetes.21 These authors found that reasonable conclusions, as to the efficacy of the interventions, were limited due to additional factors such as inadequate study duration, poor design, and confusing dosing regimens. Currently, there is no CAM research addressing microvascular or macrovascular clinical outcomes of these therapies.
The current 6-month study investigated a role for Diabetinol® in a combined management model. In our previous study, Diabetinol® significantly reduced glucose intolerance, TC, and LDL-C concentrations in subjects with FBG between 6.1 and 9.0 mmol/L and HbA1c ≤7% and not on insulin therapy.36 Here we extend upon the findings to further explore the possibility of Diabetinol® supplementation as an adjunctive therapy in a heterogeneous T2DM population with broader inclusion criteria in order to address AACE- and ADA-recommended treatment targets. Therefore, subjects on diabetic, lipid-lowering, and hypertension medications were allowed into the study. There was no diet restriction required for participation to better simulate real-world conditions.
Participants in both groups of this study showed similar excursions in the OGTT curve from baseline to weeks 12 and 24; however, those on Diabetinol® showed excursions at weeks 12 and 24 that remained similar to baseline profiles. This was reflected by the significantly longer Tmax as compared to the placebo group at week 12. Higher fasting insulin at weeks 12 and 24 in participants on Diabetinol® supported the smaller increase in FBG observed in this group compared to placebo. Furthermore, after 24 weeks, 53% of the Diabetinol®-treated participants showed a decrease in their 2-hour PP glucose concentration as compared to baseline. The FBG and OGTT excursions of participants that failed to meet all three diabetic targets at baseline (ie, FBG >100 mg/dL, 2-hour PP glucose >140 mg/dL, and HbA1c of >7%) were higher at weeks 12 and 24 in the placebo group, supporting the significantly higher fasting and 2-hour PP glucose levels observed in this group.
Analysis of diurnal glycemic profiles of non-insulin-treated diabetics has demonstrated that PP hyperglycemia excursions are a strong predictor of CVD compared to FBG.40 PP blood glucose excursions are better correlated to HbA1c levels than FBG; however, HbA1c has been determined to be a function of both fasting and PP hyperglycemia.41,42 A progressive shift in the contribution of fasting and PP glucose to hyperglycemia occurs when patients progress from mild to moderate hyperglycemia with FBG levels increasing as diabetes progresses and worsens.43 The significant within-group increase in FBG and 2-hour PP glucose concentrations in the placebo group despite being on diabetes medications confirms that conventional therapies alone are inadequate to prevent disease progression. Diabetinol® prevented the increase in FBG and 2-hour PP glucose concentrations seen after a glucose challenge in placebo-treated participants, suggesting better glycemic control.
It is well established that there is an age-related response to post-challenge glucose.37,38 Rhee et al reported that post-challenge glucose rose significantly with age even when glucose tolerance was normal.44 The greater proportion of participants that were 60 years of age and older on Diabetinol® compared to placebo, together with the non-characteristic OGTT profiles that were observed in this group, may have led to the obscuring of improvement in glucose tolerance. However, the improvement in OGTT profiles that were observed in participants between 40 and 60 years of age suggested that the efficacy of Diabetinol® was better seen in this age group.
The ACCORD and ADVANCE studies reported on the limitations of conventional diabetic treatments for decreasing CVD risk.7,8 In addition to the purported increased CVD risk associated with available treatment modalities, the risk of cardiovascular events has increased two- to fourfold in T2DM patients.45 As beta cell function declines, intensified treatment beyond the initial monotherapy regimen is required. The prevalence of obesity is also a concern in these patients and is thought to contribute to cardiovascular events. Data from the Emerging Risk Factors Collaboration indicates that in individuals with an FBG concentration exceeding 100 mg/dL, each additional 18 mg/dL increases the risk of cancer by 5%, CVD by 13%, and a risk of death from other causes by 10%.46 The results of the current study show decreases of 1.5% and 5.8% in TC and LDL-C concentrations, respectively, and a 1.7% increase in HDL-C concentrations following 24 weeks of Diabetinol® supplementation in contrast to 10.8% and 5.3% increases in TC and LDL-C concentrations, respectively, and a 4.9% decrease in HDL-C concentration in placebo-treated participants. Though not significant, these results are still noteworthy since decreasing TC by 10% results in a 30% reduction in the risk of coronary heart disease, and every 1% reduction in LDL-C is associated with a 2% drop in heart disease rates, and for each decrease of 1 mg/dL in HDL-C there is a 2%–3% increase in the risk of heart disease.47–49 As well, since all measured outcomes in the lipid panel showed results (though not significantly) in favor of Diabetinol®, the lack of statistical significance was likely a reflection of the study being underpowered and not due to a lack of efficacy.
Participants on Diabetinol® showed no differences in any laboratory or clinical measures of safety compared to those on placebo. As well, given only four AEs were reported by subjects on Diabetinol® (with three reported by the same subject) and one in the placebo were classified as having possible or probable relationship with test product, it can be concluded that Diabetinol® was safe and well tolerated by participants. It is possible that the higher dropout rates of participants enrolled in the current study was a reflection of the greater disease severity and number of comorbidities of the study population.
The placebo group in this study demonstrated the progression of disease in the absence of an intervention. This concept is of value in dietary supplement studies and has previously been discussed in the literature.50,51 It is interesting that participants on placebo showed deteriorated clinical readings compared to those on Diabetinol®, suggesting that Diabetinol® had a role in decreasing the progression of glucose impairment and improving lipid profiles. These are important achievements that are of clinical value and should be explored further in a larger, more homogenous population of participants.
The mechanism of action of citrus flavonoids has been previously established in both in vitro and in vivo models. In vitro studies on nobiletin and tangeretin suggest that these citrus flavonoids promoted glucose uptake in murine adipocytes in a concentration-dependent manner.52 As well, nobiletin was found to restore glucose tolerance and insulin sensitivity in hepatic and peripheral tissues.53 Nobiletin also induced apoptosis and suppressed lipid accumulation in adipocytes, and tangeretin suppressed intracellular triglyceride accumulation in adipocytes.54 In in vivo studies, Lee et al reported that ob/ob mice given nobiletin had lowered fasting and non-fasting plasma glucose, improved OGTT, and increased GLUT4 protein expression.55 Nobiletin has also been found to attenuate diet-induced obesity, hepatic steatosis, dyslipidemia, and increased hepatic fatty acid oxidation in Ldlr-/- mice.53 A previous study using hamsters on a high-fructose diet to induce hyperlipidemia and insulin-resistance found that those treated with Diabetinol® for 4 weeks showed decreased glucose and insulin levels, as well as reduced blood cholesterol, triacylglycerol, and non-esterified fatty acid concentrations.36
The current study, together with the results from our previous study and data obtained from both in vitro and in vivo research on nobiletin and tangeretin, suggests that Diabetinol® may have a role in improving glucose tolerance and reducing CVD risk in T2DM patients.
One limitation of this study was that the population in the current study was more heterogeneous, with greater severity and perhaps progression of diabetes than the population in the previous study. The inclusion criteria for the current study required participants to have higher fasting glucose and HbA1c levels. Furthermore, participants were on concomitant medications that indicated they were being treated for hypertension and hyperlipidemia. It is possible that the heterogeneity of participants, together with the relatively small sample size, contributed to the study not achieving statistical significance. Another limitation of this study was that participants were not required to control their diet. For future studies, a larger sample size is certainly warranted. Decreasing the heterogeneity of the study population by limiting the age range may eliminate the complication of the age-related response to the post-glucose challenge. The improvement in the glucose curve that was observed in participants 40–60 years of age is intriguing, and should be further explored in a future study with a larger sample size.
Conclusion
It is apparent that conventional treatments alone are inadequate to control fluctuations in PP glucose.14 The recommended goals for HbA1c were achieved by 14.3% of participants while 33% achieved LDL targets, 20% achieved TC targets, and 83.3% achieved systolic blood pressure targets. The results of the current study, in conjunction with the current understanding of the mechanisms of action of nobiletin and tangeritin from in vitro and in vivo studies, suggests that Diabetinol® administration holds promise as a synergistic adjunctive therapy that may slow or prevent disease progression, more closely control PP glucose fluctuations, and decrease CVD risk.
Acknowledgments
We would like to thank the volunteers of this study for their willingness and diligence in complying with the study protocol and also to SIBR Research Inc. (Bradenton, FL, USA) for successful completion of the research protocols. Larry Stitt, Assistant Director of the Biostatistical Unit at the University of Western Ontario (London, ON, Canada), is thanked for the statistical design and data analysis. We acknowledge the technical contributions of Joshua Baisley. The authors wish to thank Hui Jun Chew for her diligence in reviewing and editing this manuscript.
Disclosure
This study was supported by KGK Synergize Inc. (London, ON, Canada). ME, DW, and NG are employees of KGK Synergize, Inc. WVJ and DW are employees of SIBR Research Inc., the contract research organization responsible for conducting this study. JAR has no disclosures to report.
References
Fonseca VA, Kirkman MS, Darsow T, Ratner RE. The American Diabetes Association diabetes research perspective. Diabetes Care. 2012;35:1380–1387. | |
Rodbard HW, Jellinger PS, Davidson JA, et al. Statement by an American Association of Clinical Endocrinologists/American College of Endocrinology consensus panel on type 2 diabetes mellitus: an algorithm for glycemic control. Endocr Pract. 2009;15:540–559. | |
Chang HY, Wallis M, Tiralongo E. Use of complementary and alternative medicine among people with type 2 diabetes in Taiwan: a cross-sectional survey. Evid Based Complement Alternat Med. 2011;2011. Epub September 8, 2010. | |
Goldfine AB. Assessing the cardiovascular safety of diabetes therapies. N Engl J Med. 2008;359:1092–1095. | |
Nissen SE, Wolski K. Effect of rosiglitazone on the risk of myocardial infarction and death from cardiovascular causes. N Engl J Med. 2007;356:2457–2471. | |
Goldner MG, Knatterud GL, Prout TE. Effects of hypoglycemic agents on vascular complications in patients with adult-onset diabetes. 3. Clinical implications of UGDP results. JAMA. 1971;218:1400–1410. | |
Gerstein HC, Miller ME, Byington RP, et al. Effects of intensive glucose lowering in type 2 diabetes. N Engl J Med. 2008;358:2545–2559. | |
Patel A, MacMahon S, Chalmers J, et al. Intensive blood glucose control and vascular outcomes in patients with type 2 diabetes. N Engl J Med. 2008;358:2560–2572. | |
American Diabetes Association. Standards of medical care in diabetes – 2012. Diabetes Care 2012;35 Suppl 1:S11–S63. | |
Moller DE. New drug targets for type 2 diabetes and the metabolic syndrome. Nature. 2001;414:821–827. | |
Mannucci E, Ognibene A, Sposato I, et al. Fasting plasma glucose and glycated haemoglobin in the screening of diabetes and impaired glucose tolerance. Acta Diabetol. 2003;40:181–186. | |
Mazokopakis EE, Starakis IK. Recommendations for diagnosis and management of metformin-induced vitamin B12 (Cbl) deficiency. Diabetes Res Clin Pract. 2012;97:359–367. | |
de Jager J, Kooy A, Lehert P, et al. Long term treatment with metformin in patients with type 2 diabetes and risk of vitamin B-12 deficiency: randomised placebo controlled trial. BMJ. 2010;340:c2181. | |
Blonde L. State of diabetes care in the United States. Am J Manag Care. 2007;13 Suppl 2:S36–S40. | |
Anderson RA, Polansky MM. Tea enhances insulin activity. J Agric Food Chem. 2002;50:7182–7186. | |
Saydah SH, Fradkin J, Cowie CC. Poor control of risk factors for vascular disease among adults with previously diagnosed diabetes. JAMA. 2004;291:335–342. | |
Mechanick JI, Brett EM, Chausmer AB, Dickey RA, Wallach S. American Association of Clinical Endocrinologists medical guidelines for the clinical use of dietary supplements and nutraceuticals. Endocr Pract. 2003;9:417–470. | |
van Dam RM, Feskens EJ. Coffee consumption and risk of type 2 diabetes mellitus. Lancet. 2002;360:1477–1478. | |
Vuksan V, Sievenpiper JL, Koo VY, et al. American ginseng (Panax quinquefolius L) reduces postprandial glycemia in nondiabetic subjects and subjects with type 2 diabetes mellitus. Arch Intern Med. 2000;160:1009–1013. | |
Vuksan V, Sievenpiper JL, Wong J, et al. American ginseng (Panax quinquefolius L.) attenuates postprandial glycemia in a time-dependent but not dose-dependent manner in healthy individuals. Am J Clin Nutr. 2001;73:753–758. | |
Davi G, Santilli F, Patrono C. Nutraceuticals in diabetes and metabolic syndrome. Cardiovasc Ther. 2010;28:216–226. | |
Nahas R, Moher M. Complementary and alternative medicine for the treatment of type 2 diabetes. Can Fam Physician. 2009;55:591–596. | |
Pandey A, Tripathi P, Pandey R, Srivatava R, Goswami S. Alternative therapies useful in the management of diabetes: a systematic review. J Pharm Bioallied Sci. 2011;3:504–512. | |
Assini JM, Mulvihill EE, Huff MW. Citrus flavonoids and lipid metabolism. Curr Opin Lipidol. 2013;24:34–40. | |
Sharma AK, Bharti S, Ojha S, et al. Up-regulation of PPARgamma, heat shock protein-27 and -72 by naringin attenuates insulin resistance, beta-cell dysfunction, hepatic steatosis and kidney damage in a rat model of type 2 diabetes. Br J Nutr. 2011;106:1713–1723. | |
Assini JM, Mulvihill EE, Sutherland BG, et al. Naringenin prevents cholesterol-induced systemic inflammation, metabolic dysregulation, and atherosclerosis in Ldlr(-)/(-) mice. J Lipid Res. 2013;54:711–724. | |
Alam MA, Kauter K, Brown L. Naringin improves diet-induced cardiovascular dysfunction and obesity in high carbohydrate, high fat diet-fed rats. Nutrients. 2013;5:637–650. | |
Park HJ, Jung UJ, Cho SJ, Jung HK, Shim S, Choi MS. Citrus unshiu peel extract ameliorates hyperglycemia and hepatic steatosis by altering inflammation and hepatic glucose- and lipid-regulating enzymes in db/db mice. J Nutr Biochem. 2013;24:419–427. | |
Shin EJ, Hur HJ, Sung MJ, et al. Ethanol extract of the Prunus mume fruits stimulates glucose uptake by regulating PPAR-gamma in C2C12 myotubes and ameliorates glucose intolerance and fat accumulation in mice fed a high-fat diet. Food Chem. 2013;141:4115–4121. | |
McCullough ML, Peterson JJ, Patel R, Jacques PF, Shah R, Dwyer JT. Flavonoid intake and cardiovascular disease mortality in a prospective cohort of US adults. Am J Clin Nutr. 2012;95:454–464. | |
Jung UJ, Kim HJ, Lee JS, et al. Naringin supplementation lowers plasma lipids and enhances erythrocyte antioxidant enzyme activities in hypercholesterolemic subjects. Clin Nutr. 2003;22:561–568. | |
Demonty I, Lin Y, Zebregs YE, et al. The citrus flavonoids hesperidin and naringin do not affect serum cholesterol in moderately hypercholesterolemic men and women. J Nutr. 2010;140:1615–1620. | |
Kuhad A, Chopra K. Tocotrienol attenuates oxidative-nitrosative stress and inflammatory cascade in experimental model of diabetic neuropathy. Neuropharmacology. 2009;57:456–462. | |
Wong WY, Poudyal H, Ward LC, Brown L. Tocotrienols reverse cardiovascular, metabolic and liver changes in high carbohydrate, high fat diet-fed rats. Nutrients. 2012;4:1527–1541. | |
Ono E, Inoue J, Hashidume T, Shimizu M, Sato R. Anti-obesity and anti-hyperglycemic effects of the dietary citrus limonoid nomilin in mice fed a high-fat diet. Biochem Biophys Res Commun. 2011;410:677–681. | |
Judy W, Stogsdill W, Judy D, et al. Efficacy of Diabetinol™ on glycemic control in insulin resistant hamsters and subjects with impaired fasting glucose – a pilot study. J Funct Foods. 2010;2:171–178. | |
Gomyo M, Sakane N, Kamae I, et al. Effects of sex, age and BMI on screening tests for impaired glucose tolerance. Diabetes Res Clin Pract. 2004;64:129–136. | |
Basu R, Dalla MC, Campioni M, et al. Effects of age and sex on postprandial glucose metabolism: differences in glucose turnover, insulin secretion, insulin action, and hepatic insulin extraction. Diabetes. 2006; 55:2001–2014. | |
Kirkman MS, Briscoe VJ, Clark N, et al. Diabetes in older adults. Diabetes Care. 2012;35:2650–2664. | |
Giugliano D, Ceriello A, Esposito K. Glucose metabolism and hyperglycemia. Am J Clin Nutr. 2008;87:217S–222S. | |
Avignon A, Radauceanu A, Monnier L. Nonfasting plasma glucose is a better marker of diabetic control than fasting plasma glucose in type 2 diabetes. Diabetes Care. 1997;20:1822–1826. | |
Bonora E, Calcaterra F, Lombardi S, et al. Plasma glucose levels throughout the day and HbA(1c) interrelationships in type 2 diabetes: implications for treatment and monitoring of metabolic control. Diabetes Care. 2001;24:2023–2029. | |
Monnier L, Lapinski H, Colette C. Contributions of fasting and postprandial plasma glucose increments to the overall diurnal hyperglycemia of type 2 diabetic patients: variations with increasing levels of HbA(1c). Diabetes Care. 2003;26:881–885. | |
Rhee MK, Ziemer DC, Kolm P, Phillips LS. Postchallenge glucose rises with increasing age even when glucose tolerance is normal. Diabet Med. 2006;23:1174–1179. | |
Campbell IW. Comparing the actions of older and newer therapies on body weight: to what extent should these effects guide the selection of antidiabetic therapy? Int J Clin Pract. 2010;64:791–801. | |
Garber AJ. Obesity and type 2 diabetes: which patients are at risk? Diabetes Obes Metab. 2012;14:399–408. | |
Gordon DJ, Probstfield JL, Garrison RJ, et al. High-density lipoprotein cholesterol and cardiovascular disease. Four prospective American studies. Circulation. 1989;79:8–15. | |
Keil U. Coronary artery disease: the role of lipids, hypertension and smoking. Basic Res Cardiol. 2000;95 Suppl 1:I52–I58. | |
Koeller J, Talbert RL. Modification of high-density lipoprotein cholesterol in the management of cardiovascular risk. Pharmacotherapy. 2002;22:1266–1277. | |
Blumberg J, Heaney RP, Huncharek M, et al. Evidence-based criteria in the nutritional context. Nutr Rev. 2010;68:478–484. | |
Heaney RP. The nutrient problem. Nutr Rev. 2012;70:165–169. | |
Onda K, Horike N, Suzuki T, Hirano T. Polymethoxyflavonoids tangeretin and nobiletin increase glucose uptake in murine adipocytes. Phytother Res. 2013;27:312–316. | |
Mulvihill EE, Assini JM, Lee JK, et al. Nobiletin attenuates VLDL overproduction, dyslipidemia, and atherosclerosis in mice with diet-induced insulin resistance. Diabetes. 2011;60:1446–1457. | |
Miyata Y, Tanaka H, Shimada A, et al. Regulation of adipocytokine secretion and adipocyte hypertrophy by polymethoxyflavonoids, nobiletin and tangeretin. Life Sci. 2011;88:613–618. | |
Lee YS, Cha BY, Saito K, et al. Nobiletin improves hyperglycemia and insulin resistance in obese diabetic ob/ob mice. Biochem Pharmacol. 2010;79:1674–1683. |
 © 2015 The Author(s). This work is published and licensed by Dove Medical Press Limited. The
full terms of this license are available at https://www.dovepress.com/terms
and incorporate the Creative Commons Attribution
- Non Commercial (unported, 3.0) License.
By accessing the work you hereby accept the Terms. Non-commercial uses of the work are permitted
without any further permission from Dove Medical Press Limited, provided the work is properly
attributed. For permission for commercial use of this work, please see paragraphs 4.2 and 5 of our Terms.
© 2015 The Author(s). This work is published and licensed by Dove Medical Press Limited. The
full terms of this license are available at https://www.dovepress.com/terms
and incorporate the Creative Commons Attribution
- Non Commercial (unported, 3.0) License.
By accessing the work you hereby accept the Terms. Non-commercial uses of the work are permitted
without any further permission from Dove Medical Press Limited, provided the work is properly
attributed. For permission for commercial use of this work, please see paragraphs 4.2 and 5 of our Terms.