Back to Journals » Breast Cancer: Targets and Therapy » Volume 17
Radiomics Integration of Mammography and DCE-MRI for Predicting Molecular Subtypes in Breast Cancer Patients
Authors Yang X, Li J, Sun H, Chen J, Xie J, Peng Y, Shang T, Pan T
Received 23 July 2024
Accepted for publication 21 January 2025
Published 18 February 2025 Volume 2025:17 Pages 187—200
DOI https://doi.org/10.2147/BCTT.S488200
Checked for plagiarism Yes
Review by Single anonymous peer review
Peer reviewer comments 2
Editor who approved publication: Dr Pooja Advani
Xianwei Yang,1 Jing Li,1 Hang Sun,2 Jing Chen,1 Jin Xie,1 Yonghui Peng,1 Tao Shang,1 Tongyong Pan1
1Department of Radiology, Affiliated Hospital of Guizhou Medical University, Guiyang, 550004, People’s Republic of China; 2School of Information Science and Engineering, Shenyang Ligong University, Shenyang, 110159, People’s Republic of China
Correspondence: Jing Li, Email [email protected]; Hang Sun, Email [email protected]
Background: Accurate identification of the molecular subtypes of breast cancer is essential for effective treatment selection and prognosis prediction.
Aim: This study aimed to evaluate the diagnostic performance of a radiomics model, which integrates breast mammography and dynamic contrast-enhanced magnetic resonance imaging (DCE-MRI) in predicting the molecular subtypes of breast cancer.
Methods: We retrospectively included 462 female patients with pathologically confirmed breast cancer, including 53 cases of triple-negative, 94 cases of HER2 overexpression, 95 cases of luminal A, and 215 cases of luminal B breast cancer. Radiomics analysis was performed using FAE software, wherein the radiomic features were examined about the hormone receptor status. The performance of the model was evaluated using the area under the receiver operating characteristic curve (AUC) and accuracy.
Results: In multivariate analysis, radiomic features were the only independent predictive factors for molecular subtypes. The model that incorporates multimodal fusion features from breast mammography and DCE-MRI images exhibited superior overall performance compared to using either modality independently. The AUC values (or accuracies) for six pairings were as follows: 0.648 (0.627) for luminal A vs luminal B, 0.819 (0.793) for luminal A vs HER2 overexpression, 0.725 (0.696) for luminal A vs triple-negative subtype, 0.644 (0.560) for luminal B vs HER2 overexpression, 0.625 (0.636) for luminal B vs triple-negative subtype, and 0.598 (0.500) for triple-negative subtype vs HER2 overexpression.
Conclusion: The radionics model utilizing multimodal fusion features from breast mammography combined with DCE-MRI images showed high performance in distinguishing molecular subtypes of breast cancer. It is of significance to accurately predict prognosis and determine treatment strategy of breast cancer by molecular classification.
Keywords: breast cancer, molecular subtypes, magnetic resonance, mammography, radiomics
Introduction
Breast cancer is the prevailing malignant neoplasm in women globally, with a notable increase in its occurrence in recent times.1,2 Extensive investigation has been conducted on breast cancer at the molecular level, emphasizing the significance of accurately identifying its molecular subtypes for effective treatment selection and prognosis prediction.
The pioneering work of Perou et al in 2000 introduced the concept of molecular subtyping in breast cancer, primarily relying on the assessment of estrogen receptor (ER), progesterone receptor (PR), human epidermal growth factor receptor 2 (HER2), and proliferation cell nuclear antigen (Ki-67) expression.3,4 Different molecular subtypes exhibit distinct prognoses and responses to specific treatment modalities.5–9 For instance, Luminal A and Luminal B subtypes predominantly derive therapeutic benefits from endocrine therapy, while the HER2 overexpressing subtype can be effectively treated with anti-HER2 targeted therapy. Conversely, triple-negative breast cancer primarily relies on chemotherapy for treatment. Molecular typing of breast cancer is usually evaluated by invasive tissue sampling. However, due to the spatial and temporal heterogeneity of breast cancer, which is usually performed once at baseline, it is not suitable to monitor tumor changes during neoadjuvant chemoradiotherapy. This limits the application of invasive biopsy in molecular detection, biopsy is only based on the sampling site, which is prone to selection site bias, and the occurrence and development characteristics of diseases cannot be analyzed from the overall lesion level of the sample.10 In addition, biopsy has irreversible damage to the sample.10
A liquid biopsy is a biomarker that can be measured in body fluids such as blood to characterize genomic alterations present in solid tumors. It can be evaluated longitudinally during treatment. However, its limitation is the relative heterogeneity of time points in liquid biopsy collection.11 The discovery of a comprehensive genomic map includes predictive, prognostic, and diagnostic biomarkers, as well as the identification of somatic mutations that can indicate the efficacy of immunotherapy and molecule-guided therapies.12 However, the detection cost is high, the interpretation is relatively complicated, and the turnaround time is long. In contrast, medical imaging is a routine part of the clinical decision-making process. Unlike biopsy, medical imaging is non-invasive and can provide information about the entire tumor phenotype.
Imaging examinations, being the most direct and convenient approach, furnish crucial information about tumor size, morphology, and radiological characteristics.13,14 These findings are instrumental in the diagnosis, treatment, and prognosis assessment of breast cancer.
In recent years, there has been a surge in the utilization of novel technologies rooted in diverse imaging modalities for precision medicine and personalized treatment of breast cancer. Specifically, artificial intelligence (AI)-based computer-aided detection/diagnosis (CAD) systems and machine learning have been widely used in clinical practice to aid in the screening and diagnosis of breast cancer, and radiomics may also have the potential to aid clinical decision making. In addition, a combination of radiomic and multi-omics approaches, such as radiomics, has been reported,15 which in future studies may result in a more compelling model for bridging tumor phenotypes and genotypes, or for interpreting the biological significance of features in medical images. Supporting vector machine (SVM) is a classifier method based on machine learning, which has the characteristics of robustness and sparsity, and is good at solving problems such as nonlinear and small samples. Radiomics, a non-invasive imaging technique, effectively extracts a multitude of characteristics from radiographic images, thereby furnishing valuable insights regarding the tumor and facilitating the construction of predictive models for clinical outcomes.16–18 The practical advantages of non-invasive imaging over traditional biopsies: Firstly, invasive imaging is non-invasive to the patients, and can provide information about the overall phenotype of the tumor. Invasive imaging tissue samples are not destructive. Secondly, because biopsy is usually performed only once at baseline, it is not suitable for follow-up during neoadjuvant chemoradiotherapy, while invasive imaging can rapidly and dynamically monitor the nature and changes of tumors during neoadjuvant chemoradiotherapy for breast cancer. Thirdly, invasive imaging is faster than biopsy, and can obtain the diagnosis and classification of lesions in time before treatment. Imaging modalities such as mammography, ultrasound, and magnetic resonance imaging (MRI) assume pivotal roles in the identification, management, and prognosis prediction of breast cancer, offering a wealth of information that is imperceptible to the unaided human eye.18 Numerous investigations have been carried out on radiomics studies of breast cancer utilizing various imaging techniques, including mammography, digital breast tomosynthesis (DBT), ultrasound, and positron emission tomography.19 Breast MRI is extensively employed for screening, staging, efficacy evaluation, and recurrence monitoring in women at high risk of breast cancer, with dynamic contrast-enhanced MRI (DCE-MRI) being particularly recognized for its heightened sensitivity as an imaging modality.20–23 However, MRI is expensive, the imaging time is long, and MRI is not available for patients with metal objects in the body and poor tolerance. Compared with MRI, mammography is more sensitive to structural distortion and calcification.24 In this respect, an MRI is inferior to a mammogram. Similarly, mammogram has its shortcomings. Mammograms have limited sensitivity and specificity in identifying lesions and distinguishing benign and malignant lesions. Especially in dense mammary glands, the ability to detect lesions is greatly reduced. Although numerous studies have documented the potential correlation of radiomic features derived from MRI and mammography with the molecular subtypes of breast cancer25–27。 It is also encouraging to show that MRI and mammograph-based radiomics can predict molecular subtypes of breast cancer in a non-invasive manner. Limited research has been conducted on the integration of radiomic features from mammography and DCE-MRI images to distinguish between molecular subtypes of breast cancer. Therefore, the objective of this study is to investigate the combined predictive value of mammography and DCE-MRI radionics for distinguishing molecular subtypes of breast cancer.
Methods and Materials
Study Population
A retrospective analysis was undertaken on a cohort of 462 female patients who received a definitive diagnosis of breast cancer through pathology examination during the period from January 2018 to December 2020. Before undergoing breast mammography and DCE-MRI, these patients had not undergone a biopsy. In total, complete pathological data, encompassing the expression levels of ER, PR, HER2, and ki67, were available for 243 patients (53 cases of triple-negative subtype, 94 cases of HER2 overexpressing subtype, 95 cases of luminal A subtype, and 215 cases of luminal B subtype). Each patient underwent three types of imaging, including craniocaudal (CC), mediolateral oblique (MLO), and DCE-MRI.
Breast Mammography
After the patient has been prepared, the Selenia Dimensions device is utilized to capture both head-to-toe and oblique views of the subject under examination, potentially employing local compression for magnification. Following this, the acquired images are processed using the automatic exposure mode of the machine.
MRI
Breast magnetic resonance imaging (MRI) scans were conducted utilizing two Philips machines, namely the 3.0 T Achieva and Ingenia models. These machines, manufactured by the same company, possess identical field strengths for breast MRI scans. The scanning protocol employed is standardized across both machines, encompassing T1-weighted imaging, T2-weighted imaging, diffusion-weighted imaging (DWI), and dynamic contrast enhancement. Additionally, the post-processing workstations employed are uniform, enabling comparative analysis. Patients are positioned in the prone position, with both breasts suspended downward. MRI scans are conducted for both bilateral breast and axillary regions, including both plain and dynamic contrast-enhanced sequences.
A gadopentetate dimeglumine contrast agent, with a concentration of 469.01 mg/mL and a dosage of 0.1 mL/kg, is administered via a high-pressure injector through the dorsal hand vein at a rate of 2.0 mL/s. Subsequently, a 15 mL injection of 0.9% saline solution is administered at the same rate. The scanning sequences for the Philips 3.0 T MRI scanner comprise (1) Axial T2-weighted imaging with a repetition time (TR) of 8800.0 ms, echo time (TE) of 70.0 ms, slice thickness of 4 mm, and no slice gap. Axial T1-weighted imaging with a TR of 3.8 ms, TE of 1.9 ms, slice thickness of 4 mm, and no slice gap. (2) Axial dynamic contrast-enhanced sequence, starting with a pre-contrast acquisition followed by continuous imaging of 8 consecutive phases after contrast injection. The parameters for this sequence include a TR of 4.1 ms, TE of 2.1 ms, slice thickness of 1 mm, and no slice gap. Each phase is scanned for 50 seconds without interruption.
Image Analysis
Segmentation of Lesions
All Digital Imaging and Communications in Medicine (DICOM) images are transferred to a database and subsequently imported into the open-source image processing tool 3D slicer (https://www.slicer.org). Lesion segmentation was performed by a radiologist specializing in breast imaging, possessing more than 5 years of experience. For breast mammography images, the boundaries of the lesions were manually delineated on Cranio-Caudal (CC) or Medio-Lateral Oblique (MLO) views to generate 2D images. For DCE-MRI images, a multi-level stepwise sketching technique was employed to outline the tumor lesion, and these sketch images were then fused to create a three-dimensional volume of interest (VOI) (as depicted in Figure 1), including the enhancing component of all lesions. For a patient with multiple lesions in the breast, only the largest lesion was segmented.
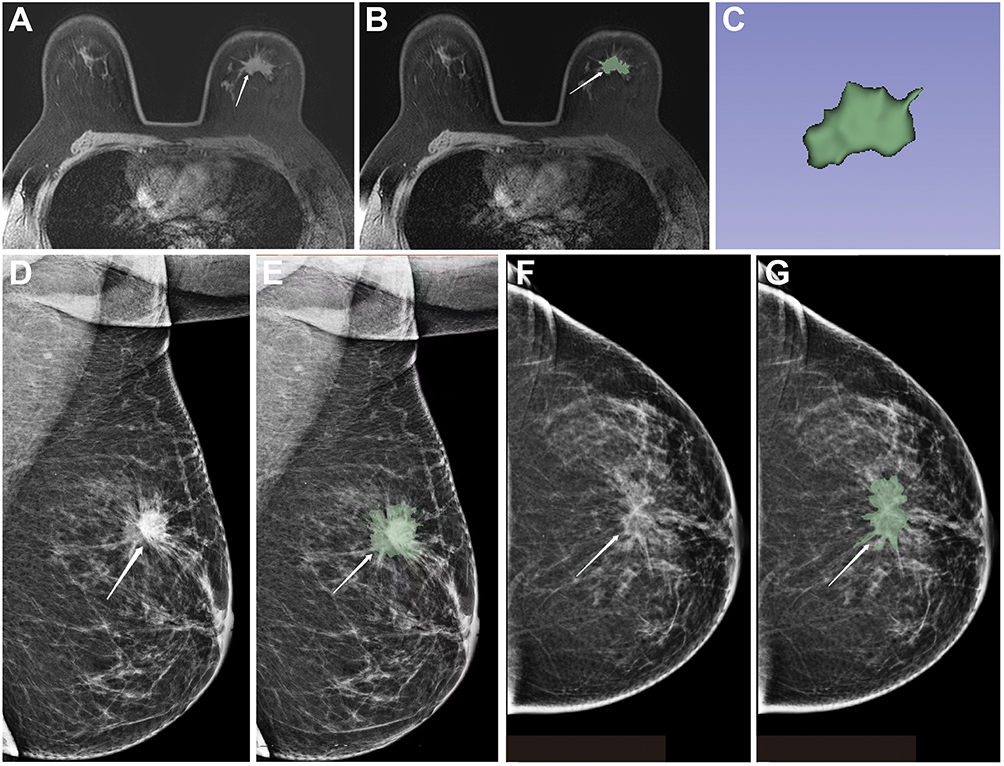 |
Figure 1 A 45-year-old female patient was diagnosed with infiltrating ductal carcinoma of the breast. (A-B) Axial images display irregular shapes, spiculated margins, and heterogeneous enhancement of the mass (indicated by arrows). (C) The gradual fusion of the volume of interest into the contour image. (D and E) left medial oblique view. (D) The white arrow shows an irregular mass in the upper quadrant of the left breast with irregular shape and marginal burrs; (E) the white arrow shows an lesion area; (F and G) left nipple-tail view. (F) The white arrow shows the lesion shape is irregular, with visible lobes and burrs. (G) The white arrow shows the lesion area of interest. |
Feature Extraction and Screening
A total of 851 radiomics features were then extracted using the Pyradiomics package in the 3Dslicer software, including 18 first-order features, 14 shape-based features (including 2D images and 3D images), 38 gray-level co-occurrence matrix (GLCM) features, 16 gray-level size zone matrix (GLSZM) features, 14 gray-level dependence matrix (GLDM) features, 32 gray-level run length matrix (GLRLM) features, and 5 neighboring gray-tone difference matrix (NGTDM) features. Radiomics analysis is implemented through Feature Explorer Pro (FAE, V 0.5.2) based on Python (3.7.6). Analysis of Variance (ANOVA) was used to screen out the imaging features with high stability, high differentiation, and high predictive value related to breast cancer molecular typing.
Model Construction and Verification
We performed six binary classifications for breast cancer molecular subtypes: luminal A versus luminal B, luminal A versus HER2 overexpressing, luminal A versus triple-negative, luminal B versus HER2 overexpressing, luminal B versus triple-negative, and triple-negative versus HER2 overexpressing. Support Vector Machine (SVM) machine learning was used to construct the models based on DCE-MRI and mammography. Then, the significant features extracted based on DCE-MRI and mammography were combined. The same method is used to screen features and construct a multi-modal feature fusion model. Finally, three models of single mammography, single DCE-MRI, and combined DCE-MRI were constructed in this study.
Finally, three models of single mammography, single DCE-MRI, and combined mammography and DCE-MRI were constructed in this study. The SVM parameters are set according to the default parameters of the “scikit learn” package (C = 1.0, kernel = “rbf”, degree = 3). SVM is an efficient and robust classifier for building models. Kernel functions can map features to higher dimensions by searching hyperplanes to separate bins with different labels. Here, we use the linear kernel function because it is easier to interpret the characteristic coefficients of the final model.
To determine the model’s hyperparameters (such as the number of features), we cross-validate the training dataset by a factor of 5, setting the hyperparameters based on the model’s performance on the validation dataset. To verify the classification accuracy, the whole sample was randomly divided into 5 groups by using the 5-fold cross-validation method. In each round, four groups are used as the training set and one as the validation set. The process is repeated five times until each group of samples has been validated.
Each SVM suitable for cross-validation generates a model with different features, and the classifier achieves maximum AUC and accuracy with a different number of significant features (top 1, 2, 3, etc., up to 30).
Histopathology
Based on the ASCO/CAP guidelines, breast cancer is categorized into Luminal A, Luminal B, HER2 overexpression, or triple-negative subtypes.28 In this classification, estrogen receptor (ER) and progesterone receptor (PR) levels exceeding 1% are deemed positive.29 HER2 negativity is determined by HER2 (-) or (1+), while HER2 positivity is indicated by (3+), with HER2 (2+) necessitating fluorescence in situ hybridization (FISH) for further assessment. Amplification of the HER2 gene signifies a positive result, whereas its absence denotes a negative result.30
Statistical Analysis
The random grouping function of FAE is employed to partition the sample data for each standard into training and testing sets, with a ratio of 7:3. To address the imbalance in the training data set, the number of samples is augmented by replicating random cases, thereby achieving equilibrium between positive and negative samples. Additionally, the feature matrix is normalized to account for the high dimensionality of the feature space. The similarity between feature pairs is assessed using the Pearson correlation coefficient (PCC), and if the PCC value exceeds 0.990, one of the features is eliminated. Before model construction, we use analysis of variance (ANOVA) to select features. Subsequently, a support vector machine (SVM) machine learning technique is utilized for classification. To assess the accuracy of the classification, a 5-fold cross-validation technique is employed, wherein the entire sample is randomly partitioned into five distinct groups. During each iteration, four groups are designated as the training set, while one group serves as the validation set. This iterative process is repeated five times until each sample group has been validated. The performance of the classification is evaluated in this study based on the area under the curve (AUC) of the receiver operating characteristic (ROC) curve and the accuracy.
Results
Feature Selection of Mammography-Based Radionics Model
Figure 2 shows the individual breast mammography imaging feature model identified specific features for different subtypes of breast cancer. Luminal A and luminal B subtypes selected 11 features, we found that the model based on 11 features can get the highest AUC on the validation data set. The AUC and the accuracy could achieve 0.586 and 0.655, respectively. In this point, he AUC and the accuracy of the model achieve 0.526 and 0.569 on the testing data set. Luminal A and HER2 overexpression subtypes selected 10 features, we found that the model based on 10 features can get the highest AUC on the validation data set. The AUC and the accuracy could achieve 0.622 and 0.651, respectively. In this point, the AUC and the accuracy of the model achieve 0.612 and 0.655 on the testing data set. Luminal A and TNBC subtypes selected 6 features, we found that the model based on 6 features can get the highest AUC on the validation data set. The AUC and the accuracy could achieve 0.506 and 0.564, respectively. In this point, the AUC and the accuracy of the model achieve 0.608 and 0.739 on the testing data set. Luminal B and HER2 overexpression subtypes selected 1 feature, we found that the model based on 1 feature can get the highest AUC on the validation data set. The AUC and the accuracy could achieve 0.559 and 0.452, respectively. In this point. the AUC and the accuracy of the model achieve 0.552 and 0.680 on the testing data set. Luminal B and triple-negative subtypes selected 20 features, we found that the model based on 20 features can get the highest AUC on the validation data set. The AUC and the accuracy could achieve 0.557 and 0.644, respectively. In this point, the AUC and the accuracy of the model achieve 0.602 and 0.545 on the testing data set and triple-negative and HER2 overexpression subtypes selected 4 features, we found that the model based on 4 features can get the highest AUC on the validation data set. The AUC and the accuracy could achieve 0.545 and 0.510, respectively. In this point, the AUC and the accuracy of the model achieve 0.571 and 0.727 on the testing data set. The AUC and the accuracy of the radionics model on the testing dataset are presented in Table 1.
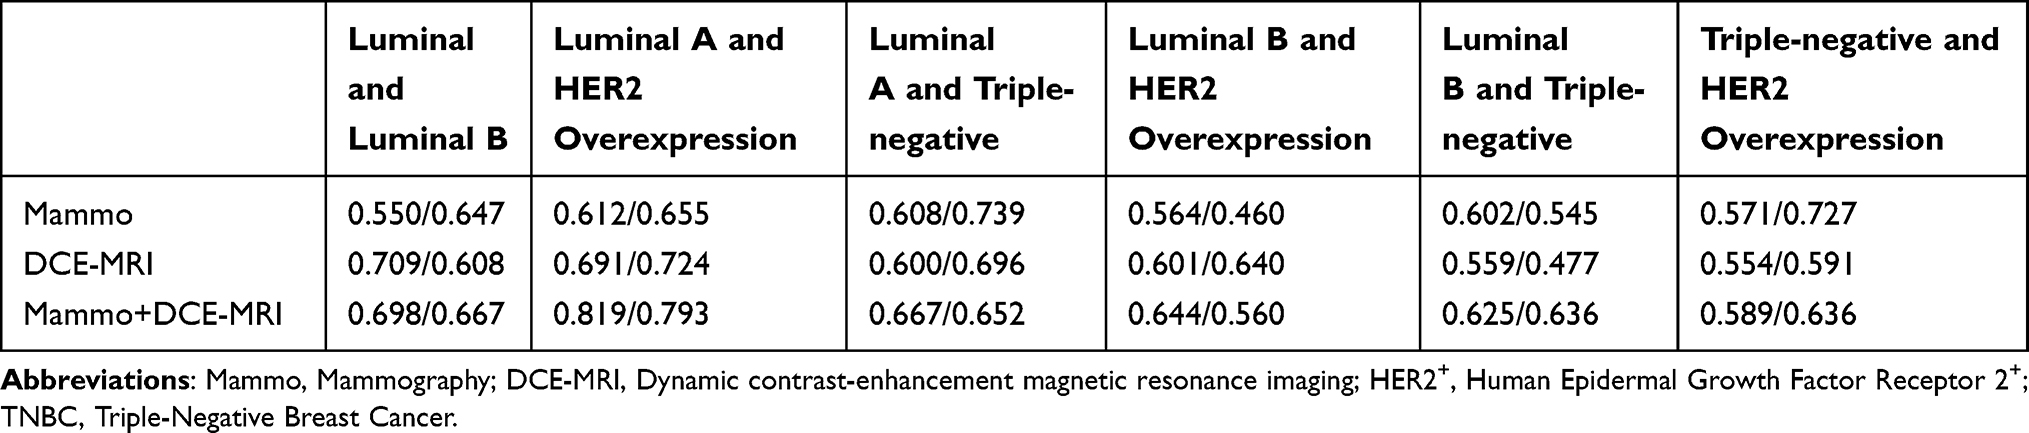 |
Table 1 The AUC and Accuracy of the Radiomics Model of Mammography-Based, DCE-MRI-Based, Combined on Testing Dataset |
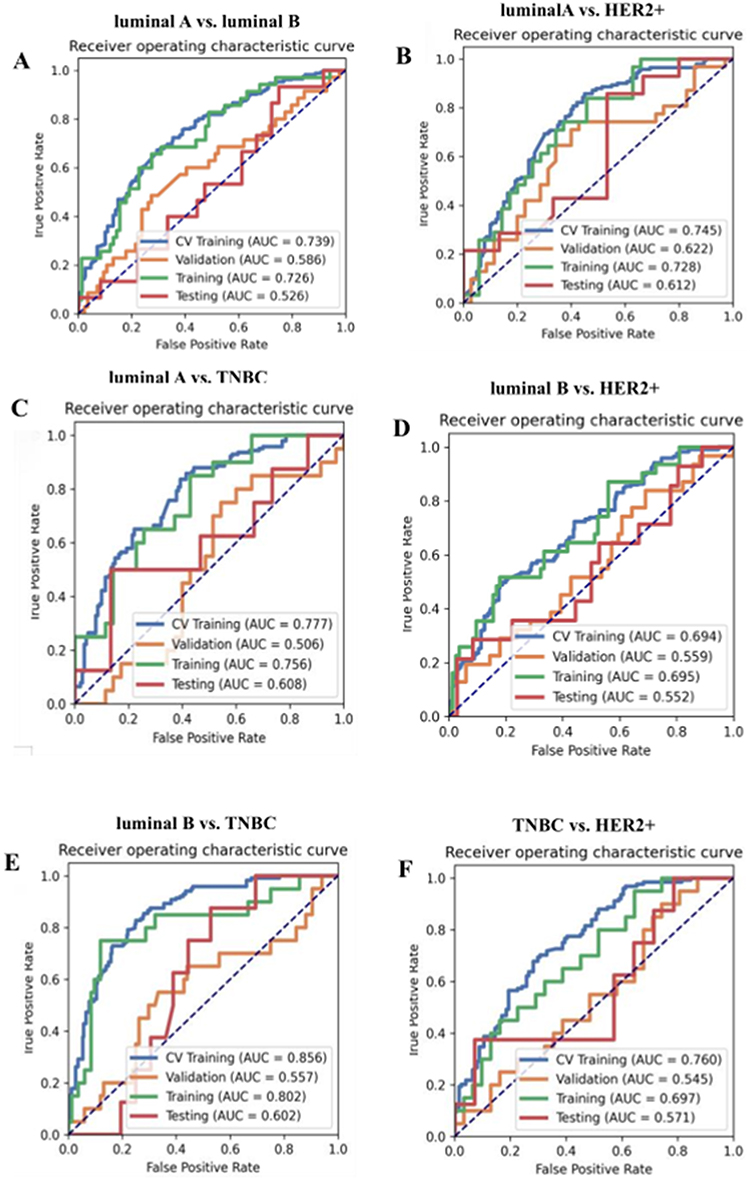 |
Figure 2 ROC curve for the mammography radiomics model. (A) The AUC of the model constructed based on luminal A and luminal B reaches 0.589 and 0.550 in the verification and test sets, respectively. (B) The AUC of the model constructed based on Luminal A and Her2 overexpression reached 0.622 and 0.612 in the validation and test sets, respectively. (C) The AUC of the models built based on luminal A and TNBC reached 0.506 and 0.608 on the verification and test sets, respectively. (D) The AUC of the models built based on luminal B and HER2 reached 0.592 and 0.563 on the verification and test sets, respectively. (E) The AUC of the models built based on luminal B and TNBC reached 0.557 and 0.602 on the validation and test sets, respectively. (F) The AUC of the models built based on TNBC and HER2 reached 0.545 and 0.571 on the verification and test sets, respectively. HER2+, Human Epidermal Growth Factor Receptor 2+. TNBC, Triple-Negative Breast Cancer. |
Feature Selection of DCE-MRI-Based Radionics Model
In the individual breast DCE-MRI feature model, the luminal A and luminal B subtypes identified a total of 5 features. We found that the model based on 5 features can get the highest AUC on the validation data set, the AUC and the accuracy could achieve 0.603 and 0.529, respectively. In this point, the AUC and the accuracy of the model achieve 0.709 and 0.608 on the testing data set. While the luminal A subtype in conjunction with HER2 overexpression identified 10 features. We found that the model based on 10 features can get the highest AUC on the validation data set. The AUC and the accuracy could achieve 0.721 and 0.727, respectively. In this point, the AUC and the accuracy of the model achieve 0.691 and 0.724 on the testing data set. Similarly, A total of 5 features in the luminal A subtype combined with triple-negative were identified, we found that the model based on 5 features can get the highest AUC on the validation data set. The AUC and the accuracy could achieve 0.681 and 0.600, respectively. In this point, the AUC and the accuracy of the model achieve 0.600 and 0.696 on the testing data set. Whereas, the luminal B subtype in conjunction with HER2 overexpression identified 13 features. We found that the model based on 13 features can get the highest AUC on the validation data set. The AUC and the accuracy could achieve 0.602 and 0.713, respectively. In this point, the AUC and the accuracy of the model achieve 0.601 and 0.640 on the testing data set. Furthermore, the luminal B subtype combined with triple-negative identified 4 features. We found that the model based on 4 features can get the highest AUC on the validation data set. The AUC and the accuracy could achieve 0.492 and 0.548, respectively. In this point the AUC and the accuracy of the model achieve 0.590 and 0.705 on the testing data set. Triple-negative in combination with HER2 overexpression identified 5 features. We found that the model based on 5 features can get the highest AUC on the validation data set. The AUC and the accuracy could achieve 0.723 and 0.745, respectively. In this point, the AUC and the accuracy of the model achieve 0.562 and 0.591 on the testing data set. The AUC and the accuracy of the radionics model on the testing dataset are presented in Table 1.
Feature Selection of Combined Radionics Model
In the combined mammography and DCE-MRI radiomics model, luminal A and luminal B selected 1 feature. We found that the model based on 1 feature can get the highest AUC on the validation data set. The AUC and the accuracy could achieve 0.617 and 0.630, respectively. In this point, the AUC and the accuracy of the model achieve 0.648 and 0.627 on the testing data set. Luminal A and HER2 overexpression selected 11 features. We found that the model based on 11 features can get the highest AUC on the validation data set. The AUC and the accuracy could achieve 0.645 and 0.636, respectively. In this point, the AUC and the accuracy of the model achieve 0.819 and 0.793 on the testing data set. Luminal A and triple-negative selected 4 features. We found that the model based on 4 features can get the highest AUC on the validation data set. The AUC and the accuracy could achieve 0.673 and 0.600, respectively. In this point, the AUC and the accuracy of the model achieve 0.725 and 0.696 on the testing data set. Luminal B and HER2 overexpression selected 16 features. We found that the model based on 16 features can get the highest AUC on the validation data set. The AUC and the accuracy could achieve 0.682 and 0.583, respectively. In this point, the AUC and the accuracy of the model achieve 0.644 and 0.560 on the testing data set. Luminal B and triple-negative selected 25 features. We found that the model based on 25 features can get the highest AUC on the validation data set. The AUC and the accuracy could achieve 0.626 and 0.712, respectively. In this point, the AUC and the accuracy of the model achieve 0.625 and 0.636 on the testing data set. And triple-negative and HER2 overexpression selected 14 features. We found that the model based on 14 features can get the highest AUC on the validation data set. The AUC and the accuracy could achieve 0.624 and 0.588, respectively. In this point, the AUC and the accuracy of the model achieve 0.598 and 0.500 on the testing data set. The AUC and accuracy of multi-feature fusion models with single mammography, single mammography DCE-MRI, and mammography combined with DCE-MRI on the test data set are shown in Table 1.
As shown in Figure 3, the AUC values for the combined model in the training and testing datasets were 0.687 and 0.648, 0.777 and 0.819, 0.857 and 0.725, 0.783 and 0.644, 0.925 and 0.625, 0.895 and 0.598, respectively. The AUC of the combined model in the validation dataset is presented in Table 2.
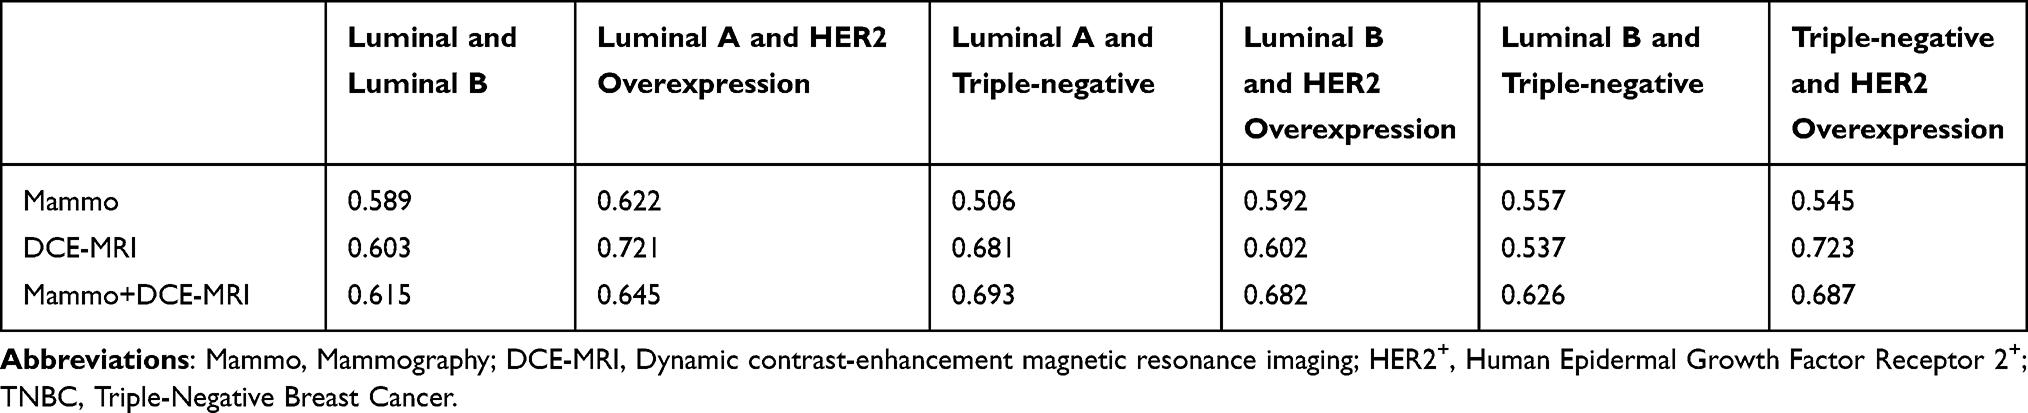 |
Table 2 The Classification Performance (AUC) of the Radiomics Model in the Validation Set |
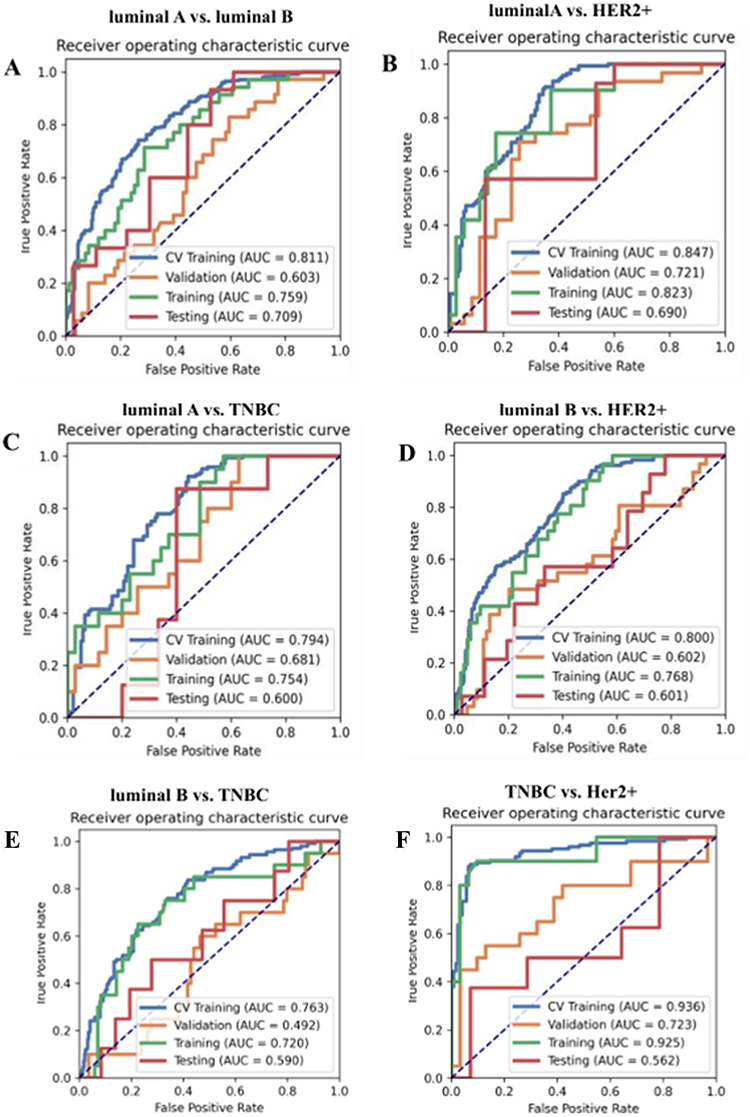 |
Figure 3 ROC curve for the DCE-MRI radiomics model. (A) The AUC of the model constructed based on luminal A and luminal B reached 0.603 and 0.709 in the verification and test sets, respectively. (B) The AUC of the model constructed based on Luminal A and HER2+ overexpression reached 0.721 and 0.690 in the verification and test sets, respectively. (C) The AUC of the model constructed based on luminal A and TNBC reached 0.681 and 0.600 in the validation set and test set, respectively. (D) The AUC of the model constructed based on luminal B and HER2+ reached 0.602 and 0.601 in the verification and test sets, respectively. (E) The AUC of the model constructed based on luminal B and TNBC reached 0.537 and 0.559 in the verification and test sets, respectively. (F) The AUC of the models built based on TNBC and HER2 reached 0.723 and 0.554 in the verification set and test set, respectively. HER2+, Human Epidermal Growth Factor Receptor 2+. TNBC, Triple-Negative Breast Cancer. |
Diagnostic Performance of Different Models
As shown in Figures 2–4, the combined model outperformed the individual models constructed solely from breast mammography or DCE-MRI. The overall classification performance of the three models is shown in Table 2. It is evident that across all experiments, the AUC values ranged from 0.526 to 0.819, while the accuracy values ranged from 0.500 to 0.793. Notably, the combination of breast mammography and DCE-MRI resulted in increased AUC values in all six binary classifications. In terms of accuracy, in the six subtypes of mammography and DCE-MRI models, luminal A type and luminal B type increased. Luminal A type and HER2 overexpression type also increased. The fusion models based on mammography and DCE-MRI in luminal A and three negative models are comparable to DCE-MRI. The luminal B and three negative models based on mammography and DCE-MRI fusion models were higher than the mammography alone (Table 1). Overall, the combined model produced the best classification performance.
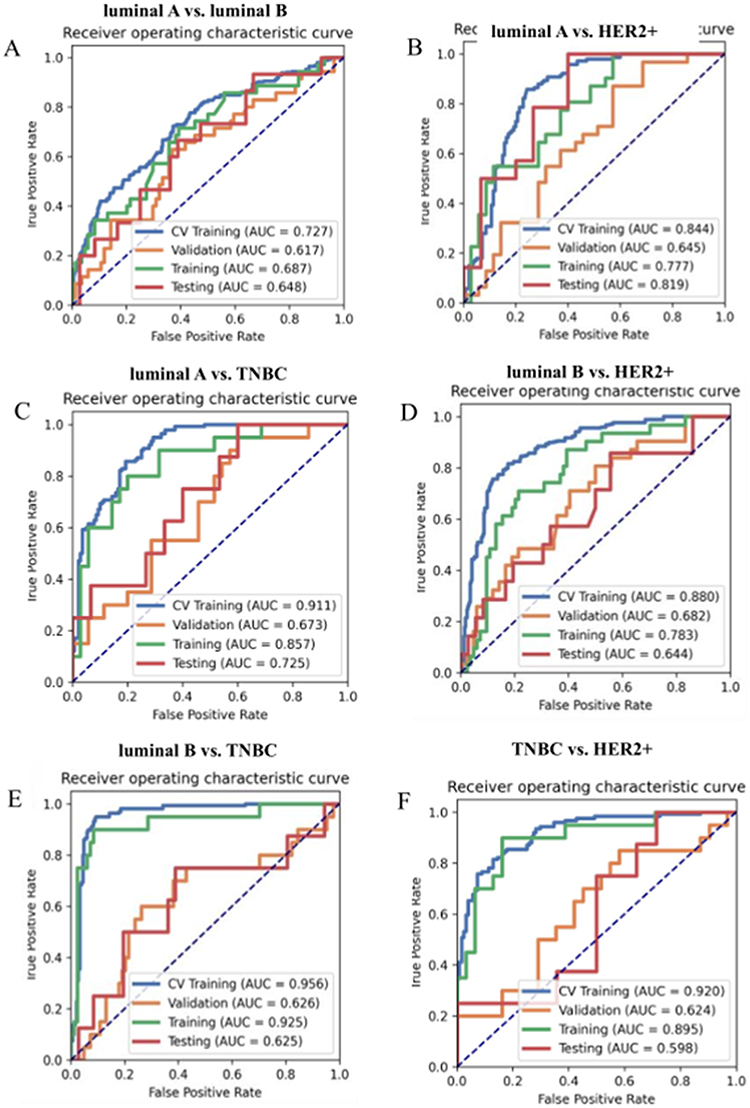 |
Figure 4 ROC curve for the combined mammography and DCE-MRI radiomics model. (A) The AUC of the models built based on luminal A and luminal B reached 0.615 and 0.698 on the verification and test sets, respectively. (B) The AUC of the models constructed based on luminal A and HER2+ overexpression reached 0.645 and 0.819 in the validation and test sets, respectively. (C) The AUC of the models built based on luminal A and TNBC reached 0.693 and 0.667 on the validation set and test set, respectively. (D) The models built based on luminal B and HER2+ achieved an AUC of 0.682 and 0.644 on the verification and test sets, respectively. (E) The AUC of the models built based on luminal B and TNBC reached 0.626 and 0.625 on the validation set and test set, respectively. (F) The AUC of the models built based on TNBC and HER2+ reached 0.687 and 0.589 on the verification set and test set, respectively. HER2+, Human Epidermal Growth Factor Receptor 2+. TNBC, Triple-Negative Breast Cancer. |
Discussion
In contrast to prior investigations concerning breast imaging radionics, this study extracts radiomic features from multimodal images to investigate the molecular subtypes of breast cancer. The findings of this study demonstrated that the combined breast mammography and DCE-MRI radiomics model yielded superior AUC and accuracy when compared to models constructed solely using either breast mammography or DCE-MRI images. The Luminal A+HER2+ model performed best among the six binary tasks, with AUC and accuracy of 0.819 and 0.793, possibly because the luminalA+HER2+ model provided more complementary information. The accuracy of the luminalA+HER2+ model was higher than that of Sutton EJ et al31 based on the SVM machine learning prediction model combined with image features extracted by MRI (71.2%). Similarly, the AUC and accuracy of this model are higher than those of Lafcı O et al32 (AUC and accuracy are 0.764 and 0.694, respectively). This indicates that our model is relevant to the molecular typing of breast cancer and can be used as an alternative marker for predicting and prognostic genetic subtypes of breast cancer molecular typing, providing a reference for targeted therapy. However, compared with the study of Zhu S et al33 (AUC of 0.93, 0.89, and 0.87 in the internal test set, respectively), the AUC of our study ranges from 0.517 to 0.819, and the results are not overly optimistic, possibly due to data imbalance. This study employed the support vector machine (SVM) classification algorithm and the variance analysis selection method to develop a model for predicting breast cancer molecular subtypes. The SVM classifier demonstrated favorable classification performance in terms of AUC and accuracy on the test dataset, aligning with previous research findings.34–39 These results suggest that the SVM classifier holds significant promise for evaluating molecular subtypes. We speculate that the construction of a diagnostic predictive model, utilizing the fusion of breast mammography and MRI, holds the potential to offer a distinctive avenue for non-invasive clinical prognostication of breast cancer molecular subtypes. Furthermore, this model can serve as a foundation for the development of precise and personalized treatment strategies, informed by our research findings.
Given the considerable heterogeneity of breast cancer, distinct molecular subtypes exhibit notable variations in their response to treatment. The utilization of breast mammography and DCE-MRI images to directly identify molecular markers holds the potential for distinguishing the four molecular subtypes of breast cancer, thereby obviating the need for invasive biopsy procedures. Numerous studies conducted in recent years have investigated the radiomic features of breast MRI, breast mammography, and ultrasound,40,41 and have observed correlations between qualitative and visual information and the molecular subtypes of breast cancer. Leithner et al employed multiparametric MRI radiomics to assess the molecular subtypes of breast cancer, achieving high accuracy in distinguishing the triple-negative subtype from other subtypes and luminal A and triple-negative subtype (AUC of 0.80 and 0.76).42 Similarly, Son et al utilized 129 radiomic features extracted from synthetic mammography reconstructed from digital breast tomosynthesis to predict the molecular subtypes of breast cancer.43 In the validation cohort, the radiomic features produced AUC values of 0.838, 0.556, and 0.645 for triple-negative, HER2, and luminal subtypes, respectively. Ma et al observed the superior performance of a combination of CC and MLO views in analyzing mammography images of 331 patients.26 They extracted quantitative radiomic features and reported the AUC values and accuracy, for different subtypes: triple-negative versus non-triple-negative subtype (0.865 [0.796]), HER2 overexpression versus non-HER2 overexpression subtype (0.784 [0.748]), and luminal versus non-luminal subtype (0.752 [0.788]). However, the existing literature on breast imaging radiomics primarily concentrates on distinguishing breast cancer molecular subtypes by utilizing radiomic features, which are extracted from single-modal images, with a majority of studies relying on the analysis of two-dimensional images. In contrast, the present study places its primary emphasis on the extraction of radiomic features from breast mammography and DCE-MRI images individually. Furthermore, it compares the classification performance of models constructed from the individual breast mammography and DCE-MRI images to the model constructed from their multimodal feature fusion, to identify subtypes. Different molecular types of breast cancer respond differently to specific treatments, for example, Luminal A and Luminal B focus on endocrine therapy, HER2-overexpressed types focus on anti-HER2-targeted therapy, and triple-negative types mainly rely on chemotherapy. If the molecular classification of breast cancer can be accurately predicted by this model, targeted treatment can be carried out according to different types of breast cancer patients, thereby reducing unnecessary biopsies and surgeries. In addition, when the pathological results are different from the results of this model, it can arouse the alarm for radiologists and oncologists to find the cause and adjust the treatment plan in time before tumor treatment. At the same time, knowing the molecular classification of breast cancer before or during surgery can help determine the surgical plan, the scope of surgery, and the individual treatment after surgery. We believe that the development of the diagnostic prediction performance of multi-feature fusion models based on mammography and MRI can enable oncologists and radiologists to quickly and accurately identify breast cancer molecular typing in a short time, and provide unique ideas for non-invasive prediction of breast cancer molecular typing classification. The model could pave the way for more targeted treatment strategies that improve patient outcomes and potentially reduce overtreatment or inappropriate treatment. The development of clinically precise and personalized treatment plans based on our research results provides a benchmark and has important guiding value for clinical treatment. However, our study has some limitations. Firstly, it is worth noting that this study was conducted solely at a single institution, utilizing images exclusively from a single vendor. The need for data from multi-center or different imaging systems or external validation datasets in future studies will strengthen the conclusions and generalizations of the model. Secondly, the inherent disparities in imaging acquisition machines, technical parameters, slice thickness, and reconstruction algorithms pose a challenge in attaining consistent imaging and obtaining uniform results that can be effectively applied in clinical practice. Thirdly, in this study, the image segmentation of MRI and mammogram was performed manually, which was time-consuming and might have observer bias. This bias could be addressed in the future by using automated or semi-automatic segmentation, and exploring these tools could also serve as recommendations for future research and implementation strategies. Lastly, we assert that the investigation of breast cancer molecular subtype classification and its comparison with alternative machine learning techniques hold substantial promise, prompting us to include this exploration in our forthcoming research endeavors.
In conclusion, this study demonstrates that the multi-feature fusion model based on the combination of breast mammography and DCE-MRI radionics shows higher classification performance. Larger-scale cases will be included in the future to further evaluate the research findings. We plan to combine genomic data with radiomics in future work to further refine machine learning algorithms, exploring the role of radiomics in predicting treatment response or long-term outcomes.
Conclusion
The radiation omics analysis based on MRI combined with mammography can effectively predict the molecular subtypes of breast cancer before surgery, and Luminal A and HER2 overexpression models perform best, which provides an effective tool for the individualized treatment of breast cancer patients before surgery.
Limitations and Future Work
The lack of multi-institution data or external dataset validation is a limitation of our study. Our equipment is relatively single and currently does not enable multi-institution data or external data set validation. In future research, the importance of multi-institution data or external data sets will be taken into account. More multi-institution data or external data will be collected and applied in future research, to increase the feasibility of the model and improve the extrapolation and generalization ability of the model.
Data Sharing Statement
The datasets analyzed during the study are available from the corresponding author upon reasonable request.
Ethics Statement
The study was approved by the Ethics Committee of Affiliated Hospital of Guizhou Medical University and all patients provided informed consent, in accordance with the Declaration of Helsinki.
Author Contributions
All authors made a significant contribution to the work reported, whether that is in the conception, study design, execution, acquisition of data, analysis, and interpretation, or all these areas; took part in drafting, revising, or critically reviewing the article; gave final approval of the version to be published; have agreed on the journal to which the article has been submitted; and agree to be accountable for all aspects of the work.
Funding
This study was supported by the Science and Technology Fund Project of Guizhou Provincial Health Committee (gzwkj2021-377), the Natural Science Foundation of Liaoning Provincial Department of Science and Technology-Doctoral Initiation Fund (2022-BS-074), and the National Natural Science Foundation of China (82260505).
Disclosure
The authors declare no competing interests in this work.
References
1. Bray F, Ferlay J, Soerjomataram I, et al. Global cancer statistics 2018: GLOBOCAN estimates of incidence and mortality worldwide for 36 cancers in 185 countries. CA. 2018;68:394–424. doi:10.3322/caac.21492
2. Sung H, Ferlay J, Siegel RL, et al. Global cancer statistics 2020: GLOBOCAN estimates of incidence and mortality worldwide for 36 cancers in 185 countries. CA. 2021;71:209–249. doi:10.3322/caac.21660
3. Perou CM, Sørlie T, Eisen MB, et al. Molecular portraits of human breast tumours. Nature. 2000;406:747–752. doi:10.1038/35021093
4. Cho N. Imaging features of breast cancer molecular subtypes: state of the art. J Pathol Transl Med. 2021;55:16–25. doi:10.4132/jptm.2020.09.03
5. Bedard PL, Hansen AR, Ratain MJ, et al. Tumour heterogeneity in the clinic. Nature. 2013;501(7467):355–364. doi:10.1038/nature12627
6. Metzger-Filho O, Sun Z, Viale G, et al. Patterns of recurrence and outcome according to breast cancer subtypes in lymph node–negative disease: results from international breast cancer study group trials VIII and IX. J Clin Oncol. 2013;31:3083–3090. doi:10.1200/JCO.2012.46.1574
7. Li H, Zhu Y, Burnside ES, et al. Quantitative MRI radiomics in the prediction of molecular classifications of breast cancer subtypes in the TCGA/TCIA data set. NPJ Breast Cancer. 2016;2:16012. doi:10.1038/npjbcancer.2016.12
8. Bloom HJG, Richardson WW. Histological grading and prognosis in breast cancer. Br J Cancer. 1957;11:359–377. doi:10.1038/bjc.1957.43
9. Dilorenzo G, Telegrafo M, La Forgia D, et al. Breast MRI background parenchymal enhancement as an imaging bridge to molecular cancer sub-type. Eur J Radiol. 2019;113:148–152. doi:10.1016/j.ejrad.2019.02.018
10. Zhong ME, Duan X, Ni-Jia-Ti MY, et al. CT-based radiogenomic analysis dissects intratumor heterogeneity and predicts prognosis of colorectal cancer: a multi-institutional retrospective study. J Transl Med. 2022;20(1):574. doi:10.1186/s12967-022-03788-8
11. González-Medina A, Vila-Casadesús M, Gomez-Rey M, et al. Clinical value of liquid biopsy in patients with FGFR2 fusion-positive cholangiocarcinoma during targeted therapy. Clin Cancer Res. 2024;30(19):4491–4504. doi:10.1158/1078-0432.CCR-23-3780
12. Pankiw M, Masley C, Charames GS. Comprehensive genomic profiling for oncological advancements by precision medicine. Med Oncol. 2023;41(1):1. doi:10.1007/s12032-023-02228-x
13. Montemezzi S, Camera L, Giri MG, et al. Is there a correlation between 3T multiparametric MRI and molecular subtypes of breast cancer? Eur J Radiol. 2018;108:120–127. doi:10.1016/j.ejrad.2018.09.024
14. Marino MA, Leithner D, Sung J, et al. Radiomics for tumor characterization in breast cancer patients: a feasibility study comparing contrast-enhanced mammography and magnetic resonance imaging. Diagnostics. 2020;10:492. doi:10.3390/diagnostics10070492
15. Qi YJ, Su GH, You C, et al. Radiomics in breast cancer: current advances and future directions. Cell Rep Med. 2024;5(9):101719. doi:10.1016/j.xcrm.2024.101719
16. Lambin P, Rios-Velazquez E, Leijenaar R, et al. Radiomics: extracting more information from medical images using advanced feature analysis. Eur J Cancer. 2012;48:441–446. doi:10.1016/j.ejca.2011.11.036
17. Kumar V, Gu Y, Basu S, et al. Radiomics: the process and the challenges. Magn Reson Imaging. 2012;30:1234–1248. doi:10.1016/j.mri.2012.06.010
18. Gillies RJ, Kinahan PE, Hricak H. Radiomics: images are more than pictures, they are data. Radiology. 2015;278:563–577. doi:10.1148/radiol.2015151169
19. Li W, Yu K, Feng C, et al. Molecular subtypes recognition of breast cancer in dynamic contrast-enhanced breast magnetic resonance imaging phenotypes from radiomics data. Comput Math Methods Med. 2019;2019:6978650. doi:10.1155/2019/6978650
20. Valdora F, Houssami N, Rossi F, et al. Rapid review: radiomics and breast cancer. Breast Cancer Res Treat. 2018;169(2):217–229. doi:10.1007/s10549-018-4675-4
21. Wang PN, Velikina JV, Bancroft LCH, et al. The influence of data-driven compressed sensing reconstruction on quantitative pharmacokinetic analysis in breast DCE MRI. Tomography. 2022;8:1552–1569. doi:10.3390/tomography8030128
22. Mann RM, Balleyguier C, Baltzer PA, et al. Breast MRI: EUSOBI recommendations for women’s information. Eur Radiol. 2015;25:3669–3678. doi:10.1007/s00330-015-3807-z
23. Baltzer PAT, Kapetas P, Marino MA, et al. New diagnostic tools for breast cancer. Memo. 2017;10:175–180. doi:10.1007/s12254-017-0341-5
24. Niu S, Jiang W, Zhao N, et al. Intra- and peritumoral radiomics on assessment of breast cancer molecular subtypes based on mammography and MRI. J Cancer Res Clin Oncol. 2022;148(1):97–106. doi:10.1007/s00432-021-03822-0
25. Leithner D, Moy L, Morris EA, et al. Abbreviated MRI of the breast: does it provide value? J Magn Reson Imaging. 2019;49(7):e85–e100. doi:10.1002/jmri.26291
26. Ma M, Gan L, Jiang Y, et al. Radiomics analysis based on automatic image segmentation of DCE-MRI for predicting triple-negative and nontriple-negative breast cancer. Comput Math Methods Med. 2021;2021:2140465. doi:10.1155/2021/2140465
27. Ma W, Zhao Y, Ji Y, et al. Breast cancer molecular subtype prediction by mammographic radiomic features. Acad Radiol. 2019;26:196–201. doi:10.1016/j.acra.2018.01.023
28. Zhang H-X, Sun Z-Q, Cheng Y-G, et al. A pilot study of radiomics technology based on X-ray mammography in patients with triple-negative breast cancer. J Xray Sci Technol. 2019;27:485–492. doi:10.3233/XST-180488
29. Goldhirsch A, Wood WC, Coates AS, et al. Strategies for subtypes—dealing with the diversity of breast cancer: highlights of the St gallen international expert consensus on the primary therapy of early breast cancer 2011. Ann Oncol. 2011;22(8):1736–1747. doi:10.1093/annonc/mdr304
30. Zhong S, Wang F, Wang Z, et al. Multiregional radiomic signatures based on functional parametric maps from DCE-MRI for preoperative identification of estrogen receptor and progesterone receptor status in breast cancer. Diagnostics. 2022;12(10):2558. doi:10.3390/diagnostics12102558
31. Sutton EJ, Dashevsky BZ, Oh JH, et al. Breast cancer molecular subtype classifier that incorporates MRI features. J Magn Reson Imaging. 2016;44(1):122–129. doi:10.1002/jmri.25119
32. Lafcı O, Celepli P, Seher Öztekin P, Koşar PN. DCE-MRI radiomics analysis in differentiating luminal A and luminal B breast cancer molecular subtypes. Acad Radiol. 2023;30(1):22–29. doi:10.1016/j.acra.2022.04.004
33. Zhu S, Wang S, Guo S, et al. Contrast-enhanced mammography radiomics analysis for preoperative prediction of breast cancer molecular subtypes. Acad Radiol. 2024;31(6):2228–2238. doi:10.1016/j.acra.2023.12.005
34. Li J, Chen Z, Su K, et al. Clinicopathological classification and traditional prognostic indicators of breast cancer. Int J Clin Exp Pathol. 2015;8(7):8500–8505.
35. Wu J, Hicks C. Breast cancer type classification using machine learning. J Pers Med. 2021;11:61. doi:10.3390/jpm11020061
36. Asri H, Mousannif H, Moatassime HA, et al. Using machine learning algorithms for breast cancer risk prediction and diagnosis. Procedia Comput Sci. 2016;83:1064–1069. doi:10.1016/j.procs.2016.04.224
37. Polat K, Güneş S. Breast cancer diagnosis using least square support vector machine. Digit Signal Process. 2007;17:694–701. doi:10.1016/j.dsp.2006.10.008
38. Akay MF, Akay MF. Support vector machines combined with feature selection for breast cancer diagnosis. Expert Syst Appl. 2009;36(2):3240–3247. doi:10.1016/j.eswa.2008.01.009
39. Heidari M, Khuzani AZ, Hollingsworth AB, et al. Prediction of breast cancer risk using a machine learning approach embedded with a locality preserving projection algorithm. Phys Med Biol. 2018;63:035020. doi:10.1088/1361-6560/aaa1ca
40. Wang L, Wang D, Chai W, et al. MRI features of breast lymphoma: preliminary experience in seven cases. Diagn Interv Radiol. 2015;21:441–447. doi:10.5152/dir.2015.14534
41. Wu M, Ma J. Association between imaging characteristics and different molecular subtypes of breast cancer. Acad Radiol. 2017;24:426–434. doi:10.1016/j.acra.2016.11.012
42. Leithner D, Mayerhoefer ME, Martinez DF, et al. Non-invasive assessment of breast cancer molecular subtypes with multiparametric magnetic resonance imaging radiomics. J Clin Med. 2020;9:1853. doi:10.3390/jcm9061853
43. Son J, Lee SE, Kim E-K, et al. Prediction of breast cancer molecular subtypes using radiomics signatures of synthetic mammography from digital breast tomosynthesis. Sci Rep. 2020;10(1):21566. doi:10.1038/s41598-020-78681-9
 © 2025 The Author(s). This work is published and licensed by Dove Medical Press Limited. The
full terms of this license are available at https://www.dovepress.com/terms
and incorporate the Creative Commons Attribution
- Non Commercial (unported, 3.0) License.
By accessing the work you hereby accept the Terms. Non-commercial uses of the work are permitted
without any further permission from Dove Medical Press Limited, provided the work is properly
attributed. For permission for commercial use of this work, please see paragraphs 4.2 and 5 of our Terms.
© 2025 The Author(s). This work is published and licensed by Dove Medical Press Limited. The
full terms of this license are available at https://www.dovepress.com/terms
and incorporate the Creative Commons Attribution
- Non Commercial (unported, 3.0) License.
By accessing the work you hereby accept the Terms. Non-commercial uses of the work are permitted
without any further permission from Dove Medical Press Limited, provided the work is properly
attributed. For permission for commercial use of this work, please see paragraphs 4.2 and 5 of our Terms.