Back to Journals » Journal of Hepatocellular Carcinoma » Volume 10
Radiomics Based on Dynamic Contrast-Enhanced Magnetic Resonance Imaging in Preoperative Differentiation of Combined Hepatocellular-Cholangiocarcinoma from Hepatocellular Carcinoma: A Multi-Center Study
Authors Guo L, Li X, Zhang C, Xu Y ![]() , Han L, Zhang L
, Han L, Zhang L
Received 2 February 2023
Accepted for publication 2 May 2023
Published 2 June 2023 Volume 2023:10 Pages 795—806
DOI https://doi.org/10.2147/JHC.S406648
Checked for plagiarism Yes
Review by Single anonymous peer review
Peer reviewer comments 2
Editor who approved publication: Professor Manal Hassan
Le Guo,1,* Xijun Li,2,* Chao Zhang,3,* Yang Xu,4 Lujun Han,5 Ling Zhang1
1Department of Radiology, Nanfang Hospital, Southern Medical University, Guangzhou, People’s Republic of China; 2Key Laboratory of Hunan Province for Internet of Things and Information Security, Xiangtan University, Xiangtan, Hunan Province, People’s Republic of China; 3Department of Pathology, Sun Yat-sen University Cancer Center, State Key Laboratory of Oncology in South China, Collaborative Innovation Center for Cancer Medicine, Guangzhou, Guangdong, People’s Republic of China; 4Department of Interventional, Nanfang Hospital, Southern Medical University, Guangzhou, People’s Republic of China; 5Department of Medical Imaging, Sun Yat-sen University Cancer Center, State Key Laboratory of Oncology in South China, Collaborative Innovation Center for Cancer Medicine, Guangzhou, Guangdong, People’s Republic of China
*These authors contributed equally to this work
Correspondence: Ling Zhang, Department of Radiology, Nanfang Hospital, Southern Medical University, Guangzhou, People’s Republic of China, Tel +86-2062786561, Email [email protected] Lujun Han, Department of Medical Imaging, Sun Yat-sen University Cancer Center, State Key Laboratory of Oncology in South China, Collaborative Innovation Center for Cancer Medicine, Guangzhou, Guangdong, People’s Republic of China, Tel +86-2087342125, Email [email protected]
Purpose: To explore whether texture features based on magnetic resonance can distinguish diseases combined hepatocellular-cholangiocarcinoma (cHCC-CC) from hepatocellular carcinoma (HCC) before operation.
Methods: The clinical baseline data and MRI information of 342 patients with pathologically diagnosed cHCC-CC and HCC in two medical centers were collected. The data were divided into the training set and the test set at a ratio of 7:3. MRI images of tumors were segmented with ITK-SNAP software, and python open-source platform was used for texture analysis. Logistic regression as the base model, mutual information (MI) and Least Absolute Shrinkage and Selection Operator (LASSO) regression were used to select the most favorable features. The clinical, radiomics, and clinic-radiomics model were constructed based on logistic regression. The model’s effectiveness was comprehensively evaluated by the receiver operating characteristic (ROC) curve, area under the curve (AUC), sensitivity, specificity, and Youden index which is the main, and the model results were exported by SHapley Additive exPlanations (SHAP).
Results: A total of 23 features were included. Among all models, the arterial phase-based clinic-radiomics model showed the best performance in differentiating cHCC-CC from HCC before an operation, with the AUC of the test set being 0.863 (95% CI: 0.782 to 0.923), the specificity and sensitivity being 0.918 (95% CI: 0.819 to 0.973) and 0.738 (95% CI: 0.580 to 0.861), respectively. SHAP value results showed that the RMS was the most important feature affecting the model.
Conclusion: Clinic-radiomics model based on DCE-MRI may be useful to distinguish cHCC-CC from HCC in a preoperative setting, especially in the arterial phase, and RMS has the greatest impact.
Keywords: magnetic resonance, radiomics, machine learning, primary liver cancer, differential diagnosis
Introduction
As the rarest pathological type of primary liver cancer, combined hepatocellular carcinoma-cholangiocarcinoma (cHCC-CC) accounts for about 0.4–14.2% of all primary liver carcinomas.1 It displays a mixture of histological characteristics of hepatocellular carcinoma (HCC) and intrahepatic cholangiocarcinoma (ICC) and has the differentiation characteristics of hepatocytes and bile duct cells. At present, where cHCC-CC originates from remains controversial, with several studies supporting that liver progenitor cells are the origin of cHCC-CC.1–4 While some scholars hold that HCC and ICC components in cHCC-CC may come from HCC or common stem cells, which then differentiate into hepatocytes and bile duct epithelial cells.3,5 HCC is the primary liver cancer with the highest incidence. When it contains ICC, it conforms to type C cHCC-CC,6 i.e, HCC and ICC are located within the same mass. Yet, these two diseases differ in their prognosis. The survival rate of HCC after liver transplantation or surgical resection is higher than that of cHCC-CC.7–14 Transarterial chemoembolization (TACE) is a common treatment for HCC patients whose tumor is unresectable or inability to tolerate surgery due to medical comorbidities, even those who want to be exempt from the pain of surgery. However, this therapy turns out to be less effective due to the low intake of chemotherapy drugs resulting from the lack of blood supply in cHCC-CC.11,15
However, cHCC-CC presents with similar clinical and imaging features to HCC,16–19 making distinguishing these two diseases in a preoperative setting difficult. Studies have pointed out that the proportion of HCC components in cHCC-CC will affect the classification of Liver Imaging Reporting and Data System (LI-RADS) and tumors with HCC components >50% are more likely to be classified into LR-4/5.20 Compared with LI-RAIDS, KLCA-NCC is more sensitive in diagnosing HCC.21 However, both depend on film readers’ subjective analysis based on their own experience, which leads to a high false-positive rate of HCC diagnosis. Li et al reported in a small sample size study22 that ultrasonic proteomics can better distinguish cHCC-CC from HCC than LI-RADS. Previous studies on these two types of tumors mostly used data from a single center with few samples and imaging features whose interpretation depends on clinical data and subjective judgment,19,22,23 lacking universality and objectivity. With histopathological examination being the “gold standard” of preoperative diagnosis of cHCC-CC, there are some cases where the puncture is not in place or the collected samples are insufficient, leading to misdiagnosis of cHCC-CC as HCC. Mainly, when the proportion of ICC components only accounts for a small proportion of the lesion and some patients are treated without even undergoing a puncture examination, a histopathological examination will not be of much help. This study excluded imaging signs that subjective factors would significantly influence. The aim was to determine whether DCE-MRI imaging based on multi-center data could differentiate HCC from cHCC-CC before an operation and further explain the model output results.
Methods
Inclusion and Exclusion Criteria
In this retrospective study, the ethics committees of Nanfang Hospital of Southern Medical University and Sun Yat-sen University Cancer Center exempted the patients’ informed consent. Three hundred and forty-two samples were included, including 217 HCC samples and 125 cHCC-CC samples. The patient enrollment process is shown in Figure 1. The information on patients who undergone abdominal DCE-MRI and surgical resection of liver masses between May 2017 and March 2021 at Nanfang Hospital of Southern Medical University (Institution 1) and Sun Yat-sen University Cancer Center (Institution 2) was collected. Inclusion criteria: 1. Pure HCC or conformance to type C cHCC-CC had been pathologically confirmed after surgical resection; 2. The maximum tumor diameter was ≥ 1cm; 3. DCE-MRI scan had been performed within one month before the operation; 4. Clinical data and images were complete. Exclusion criteria: 1. The maximum diameter was < 1cm; 2. Other anti-tumor therapies before the MRI examination, such as TACE or tumor ablation, had been performed; 3. The patient had a history of tumor in other parts of the body; 4. Poor image quality. Multi-center data were compiled and randomly divided into the training and test sets in relative proportion.
 |
Figure 1 The recruitment process of the cases for this study. Abbreviations: cHCC-CC, combined hepatocellular carcinoma-cholangiocarcinoma; HCC, hepatocellular carcinoma; TACE, transarterial chemoembolization. |
Clinical Baseline Data
Clinical baseline data were derived from the picture archiving and communication system (PACS), including sex, age, serum alpha-fetoprotein (AFP), carcinoembryonic antigen (CEA), cancer antigens 19–9 (CA199), hepatitis B e antigen (HBeAg) and hepatitis B surface antigen (HBsAg) levels. Pathologists diagnosed liver cirrhosis through histopathological examination. The tumor size was measured at the largest level by two radiologists with 8 years of experience in tumor diagnosis. The one with the largest diameter was selected when there were multiple masses. The selected tumors were divided into the > 5cm group and the ≤ 5cm group. In case of ambiguity, the decision would be made through consultation.
MRI Image Acquisition
In this study, all patients underwent MRI scans using a 3.0T scanning system (the one used by Institution 1 was a UIH product and Institution 2 used the product offered by GE) with a 16-channel abdominal coil. The 0.1mmol/kg contrast agent (Gd-DPTA, an extracellular contrast) was injected into the elbow vein with a high-pressure syringe at a rate of 2.0 mL/s. The scanning time points after the injection of the contrast agent were the same in both institutions: the scanning was performed in 20–25s (the arterial phase, AP), 50–60s (portal venous phase, PVP), and 90–120s (delayed phase, DP), respectively. Table 1 summarizes the scanning parameters of MRI in these two institutions.
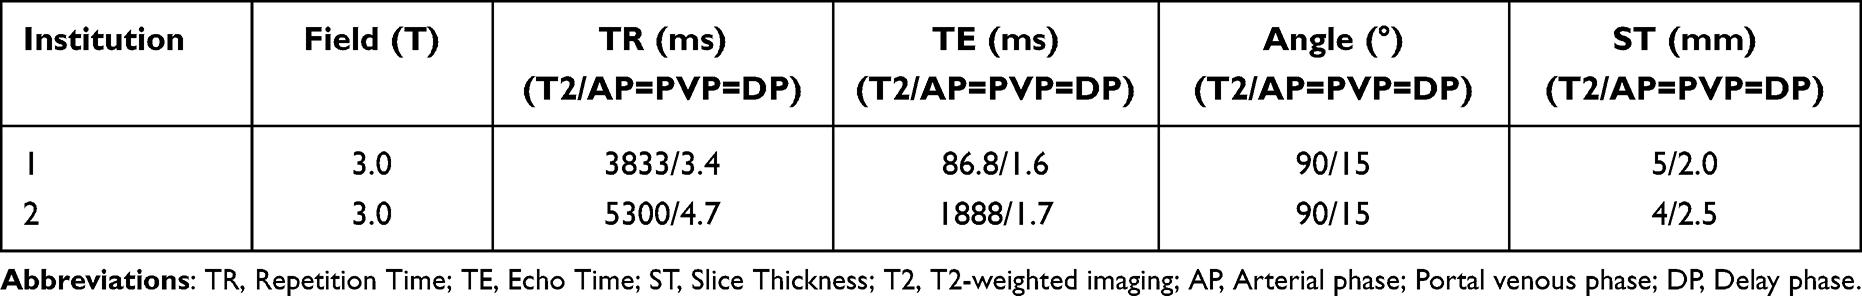 |
Table 1 Sequences and Parameters of Dynamic-Enhanced MRI |
Radiomics Analysis
Workflow
Image processing and radiomics analysis in this study followed the Image Biomarker Standardization Initiative (IBSI) standards.24 The analysis process of the radiomics analysis is shown in Figure 2.
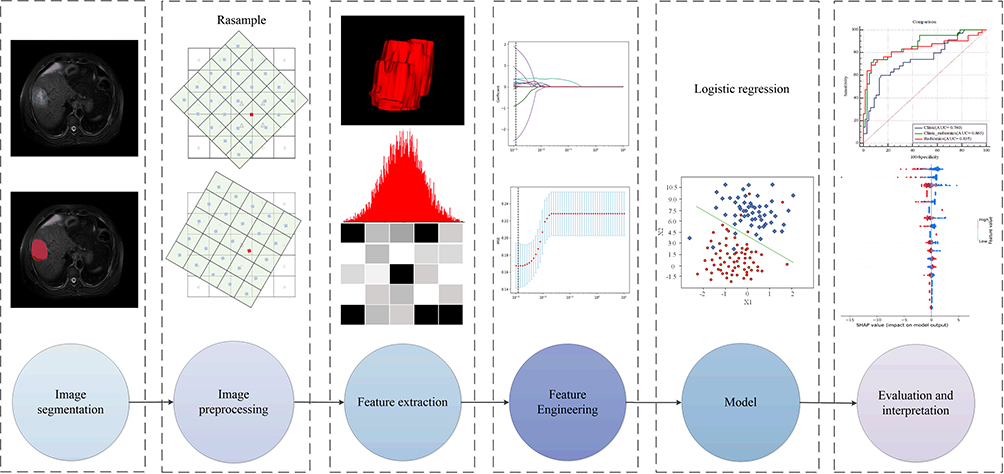 |
Figure 2 The general flow of radiomics analysis in this study. |
Image Segmentation and Preprocessing
Two radiologists with 5 years of experience in abdominal diagnosis participated in the tumor segmentation. ITKSNAP (v. 3.8.0) was used to segment the tumors layer by layer along the visible boundaries of the tumor at AP, PVP, DP and T2-weighted imaging (T2WI), respectively. Each ROI was a three-dimensional image on the horizontal axis. Because of the batch differences in multi-center data and different body shapes of patients, the images had been distorted more or less, so we had to re-sample DICOM images and masks using sitkLinear and sitkNearestNeighbor, respectively. The pixel value of the DICOM image was normalized to 0–1 by the min-max normalization method.
Feature Extraction and Selection
The data were divided into the training set and the test set at a ratio of 7:3. Python 3.9.7 (Pyradiomics Version 2.12) was applied to extract features from ROI, with 1409 features in each sequence, totaling 5636 features. The two physicians’ intra-class correlation coefficient (ICC) was 0.81, indicating good consistency. Before feature screening, the min-max normalization method was used to normalize the feature values to 0–1. First, the characteristics of radiomics were preliminarily screened by MI to remove those characteristics with a correlation threshold <0.1. Then, LASSO was used for 10-fold cross-validation to select the best features to be included in the model construction.
Model Construction
This study chose logistic regression (LR), a commonly used binary classification model, for model training. Linear Support Vector Classification (LSVC) was used to cross-check the training set by 50% to select the optimal parameters, and L2 regularization was used as the penalty to make the weight W infinitely close to but not zero. Squared_hinge was chosen as the loss function. The radiomics, clinical (all clinical data included), and clinic-radiomics model (radiomics characteristics + clinical data) were constructed, respectively.
Model Evaluation and Interpretation
Model performance was evaluated using ROC curves, AUC, sensitivity, specificity, and the Youden index, the primary indicator. An independent test set verified the model. The feature importance only tells us which feature is important, but it is unclear how it affects the prediction results. As a method to solve the interpretability of the model, Shapley Additive exPlanations (SHAP) can reflect the influence of features in each sample on the model and show both the positive and negative aspects of such influence. Therefore, this study cited SHAP to explain the model’s output to help decision-makers understand how to use the model correctly.
Statistical Analysis
SPSS 25.0 and MedCalc 19.7.1 were used for data analysis and descriptive statistics. With age as a continuous variable, age was presented by the  and was compared in pairs using t-test. Other clinical baseline characteristics and tumor size were classified variables presented in frequency. Their between-group comparison was performed using the χ2 test. All statistical tests were bilateral, and p value <0.05 was considered as having statistical differences.
Results
Clinical Baseline Data
Three hundred and forty-two patients (125 with cHCC-CC and 217 with HCC) were enrolled. The process of patient recruitment is shown in Figure 1. Patients were randomized at a ratio of 7:3 into the training set (n = 239) and the test set (n = 103). Table 2 details the comparison of clinical data between the training set and the test set. All clinical baseline features, including the distribution of the two sets, had no statistical difference between the training set and the test set (p > 0.05).
 |
Table 2 Comparison of Patient Characteristics of cHCC-CC and HCC in the Train and Test Set |
Model Performance
In this study, cHCC-CC=1 and HCC=0 were used as labels. Synthesize all model evaluation indexes, especially the Youden index, the clinic-radiomics model based on LR (combining clinical baseline data and radiomics characteristics) performed best in distinguishing cHCC-CC from HCC in AP, AUC was 0.902 (95% CI: 0.863 to 0.933)/0.863 (95% CI: 0.782 to 0.923) (training set/test set), with the specificity and sensitivity being 0.918 (95% CI: 0.819 to 0.973) and 0.738 (95% CI: 0.580 to 0.861), respectively, and Youden index 0.656. The radiomics model based on PVP did the best performance in distinguishing the two groups of patients, with an AUC of 0.856 (95% CI: 0.805 to 0.898) in the training set and 0.835 (95% CI: 0.749 to 0.901) in the test set, and the specificity, sensitivity and Youden index of 0.934 (95% CI: 0.841 to 0.982), 0.691 (95% CI: 0.529 to 0.824) and 0.625, respectively. The clinical model showed a relatively low performance, with an AUC of 0.767 (95% CI: 0.708 to 0.819) and 0.740 (95% CI: 0.645 to 0.822) in the training set and the test set, respectively, and the Youden index of only 0.452. The performances of these three models are detailed in Table 3, and their ROC curves are shown in Figure 3.
 |
Table 3 Performance of Each Model Based on Logistic Regression |
 |
Figure 3 Comparison of ROC curves in the test set of each model based on logistic regression. Abbreviations: ROC, receiver operating characteristic; AUC, area under the curve. |
Result Explanation
AP-based clinic-radiomics model is the best model for distinguishing cHCC-CC from HCC in this study. In the test set, 56/61 HCC and 31/42 HCC were correctly predicted (Figure 4). To further explore the interpretability of the fusion model in this study, we obtained the SHAP values of features to determine their contribution to the fusion model based on AP. Finally, 23 features are included in the fusion model, including 11 Wavelet features, 2 Original image features, 2 LocalBinaryPattern2D features, and 8 clinical features. The most crucial feature was the first-order statistics based on filtering transformation ---the root mean square (RMS) (Figure 5), the square root of the mean square of all intensity values. The high RMS had a positive effect on the model, supporting the model to have the predicted result of cHCC-CC, while the low RMS did the opposite. Figure 6 provides the contribution value of each feature to the model. The contribution value is the average of the absolute value of the SHAP value for each feature, which is located on the right of each red bar chart. The output of a pathologically confirmed HCC patient in the fusion model is shown in Figure 7, with the sum of SHAP values being −1.80 and the RMS of SHAP value being 0.153. Thus, it was considered that RMS supported the diagnosis of HCC.
 |
Figure 4 Confusion matrix of the clinic-radiomics model in the test set based on logistic regression. Abbreviations: cHCC-CC, combined hepatocellular carcinoma-cholangiocarcinoma; HCC, hepatocellular carcinoma. |
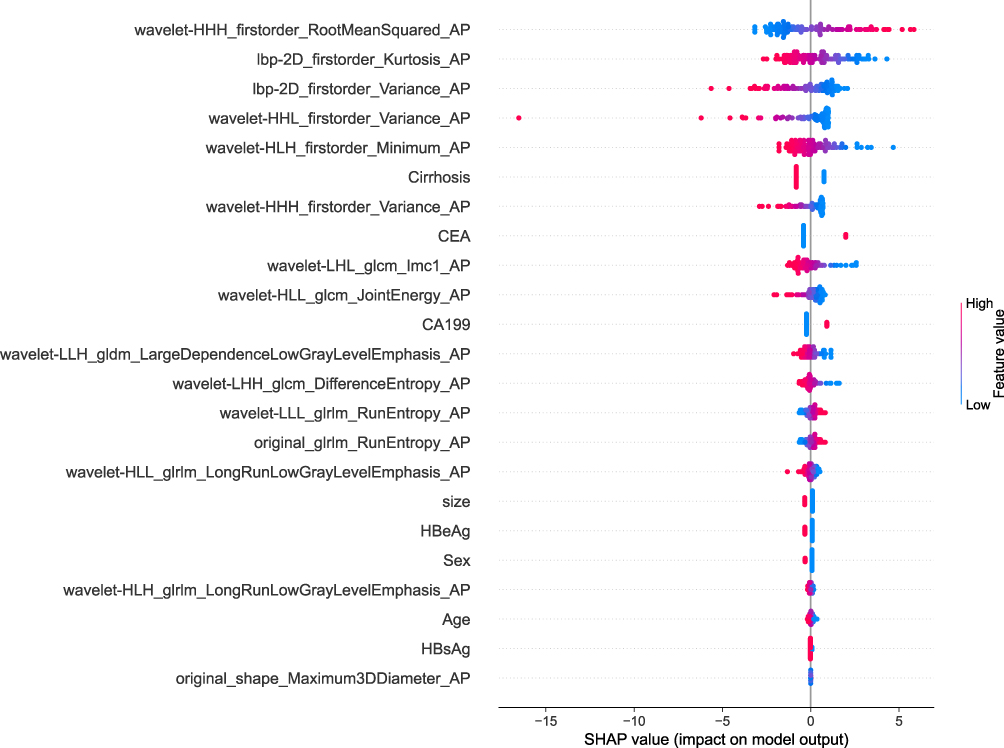 |
Figure 5 The global SHAP explanatory diagram shows the distribution of features’ influence on the clinic-radiomics model’s output. Red has a positive effect on the prediction and blue has a negative impact. Abbreviations: SHAP, SHapley Additive exPlanations; CEA carcinoembryonic antigen; CA199, cancer antigens 19–9; HBeAg, hepatitis b e antigen, HBsAg, hepatitis b surface antigen; AP, arterial phase. |
 |
Figure 6 Distribution of importance for each feature in the fusion model based on AP. The value to the right of each red bar is the contribution coefficient of the feature to the model, which is the average value of the absolute value of the SHAP value for each feature. Abbreviations: AP, arterial phase; SHAP, SHapley Additive exPlanations; CEA carcinoembryonic antigen; CA199, cancer antigens 19–9; HBeAg, hepatitis b e antigen, HBsAg, hepatitis b surface antigen. |
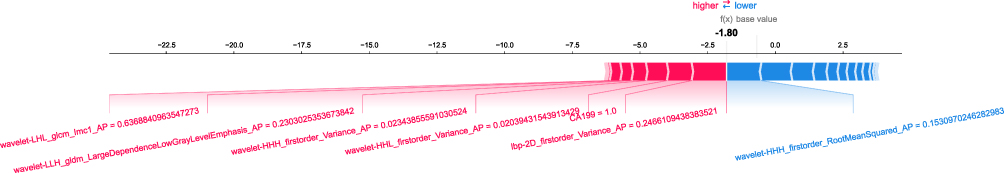 |
Figure 7 A single-sample SHAP interpretation plot that the model for HCC diagnosed. Abbreviations: SHAP, SHapley Additive exPlanations; CA199, cancer antigens 19–9; AP, arterial phase. |
Discussion
In this multi-center study, three different models were developed and verified with LR as the classifier, which proved the performance and reliability of the fusion of imaging features and clinical features in differentiating cHCC-CC from HCC in a preoperative setting. The fusion of imaging and clinical features has been widely used in clinical research, such as differential diagnosis of tumors,25–27 prognosis study,28–32 and microvascular invasion (MVI) prediction,33–35 and has shown good performance.
cHCC-CC is a rare but highly malignant tumor. Most patients were diagnosed at the advanced stage, often accompanied by ascites, venous tumor thrombus, intrahepatic metastasis, and distant metastasis. Similar to ICC, the overall postoperative survival rate or disease-free survival rate of cHCC-CC is lower than that of HCC.10,13,36 Accurate preoperative diagnosis of cHCC-CC is of great significance for precise treatment and balanced allocation of medical resources. Some studies have shown that the imaging features of cHCC-CC are more similar to those of HCC, although a few features are similar to ICC.16,17 This study removed image signs involving subjective descriptions, and only the relationship between clinical baseline data and imaging radiomics features and the two groups of patients was explored. The results showed that the fusion of PVP and clinical baseline data had the highest AUC value for distinguishing cHCC-CC from HCC, but the Youden index was slightly lower than AP. We think AP can distinguish the two groups of patients based on other evaluation indexes more effectively. In the arterial phase of HCC, contrast media gathered in the hepatic artery, while some cHCC-CC dominated by ICC components showed the characteristics of progressive enhancement. At this phase, the intra-tumor enhancement values of the two groups were quite different, and the heterogeneity might be more obvious. The model’s output results showed that RMS was the essential feature, the square root of the mean square of all intensity values. This feature is volume-confounded, a larger value increases the effect of volume-confounding. The positive impact of the high value of RMS on the model showed that the gray value of MRI images of cHCC-CC was higher than that of HCC, probably because most cHCC-CC are larger in diameter than HCC and contain more intensity values. Meanwhile, we believe that ICC components in cHCC-CC may affect its imaging characteristics, which is consistent with the previous research results.12,16,20 However, the proportion of HCC components in cHCC-CC does not correspond to the imaging features of HCC.20 The effect of the clinical model was poor, which could explain why simply conducting a few laboratory tests might lead to misdiagnosing some cHCC-CC as HCC.
Currently, with the absence of specific guidelines for the effective treatment of cHCC-CC, surgical intervention is still the first choice for clinicians. Compared with open hepatectomy, laparoscopic hepatectomy can achieve the same effect with less damage to liver function.37 Even the inoperable patients misdiagnosed as HCC before the operation were treated with TACE. The prognosis of cHCC-CC patients with varying dominating components is different.12,20,28,38 The early recurrence rate of cHCC-CC of LR-M within 6 months after surgical resection is significantly higher than that of LR-5/4.39 And the difference in LI-RADS classification may be related to the proportion of HCC components in the tumor. In this study, some pathological results lacked information on component proportion, and we will conduct more data collection and exploration in the future. Currently, IL-6 trans-signaling is considered to promote the development of mixed cancer and can be used to study new therapeutic methods of cHCC-CC.2 This also provides ideas for our future clinical and basic research.
This study is feasible for the following reasons: First, our cases came from two medical centers, which can reflect the generality and universality of radiomics; Second, to reduce the uncontrollable influence of selection bias and equipment differences on the model, we performed a series of data preprocessing; Third, we used SHAP to explain the output results of the model, calculate the marginal contribution of features to the output of the model, and explain the “black box model” from the holistic and local levels. However, this study also has limitations: 1. As a retrospective study, some patients were excluded because of incomplete data or lack of surgical treatment, and certain selection biases could exist; 2. Tumor segmentation by manual operation can never be 100% accurate; 3. As cHCC-CC is a rare tumor, our samples in each center are tiny and unbalanced, so the overall sample size was still limited. More data need to be collected to prove the current research results.
Conclusion
Based on the clinical baseline data from multi-medical center data and MRI imaging radiomics characteristics, the LR-based clinic-radiomics model performs well in distinguishing cHCC-CC from HCC before an operation and provides a reference for clinicians to make treatment decisions, especially in the arterial phase. RMS showed significant effects.
Abbreviations
DCE-MRI, dynamic contrast-enhanced magnetic resonance imaging; cHCC-CC, combined hepatocellular-cholangiocarcinoma; HCC, hepatocellular carcinoma; LASSO, least absolute shrinkage and selection operator; ROC, receiver operating characteristic; AUC, area under the curve; SHAP, SHapley Additive exPlanations; AP, arterial phase; CI, confidence interval; RMS, root mean square; LI-RADS, Liver Imaging Reporting and Data System; KLCA-NCC, Korean Liver Cancer Association and National Cancer Center; TACE, transarterial chemoembolization; AFP, alpha-fetoprotein; CEA, carcinoembryonic antigen; CA199, cancer antigens 19-9; HBeAg, hepatitis b e antigen; HBsAg, hepatitis b surface antigen; UIH, United Imaging healthcare; GE, general electric; PVP, portal vein phase; DP, delayed phase; T2WI, T2-weighted imaging; DICOM, digital imaging and communications in medicine; ROI, region of interest; LSVC, Linear Support Vector Classification; MVI, microvascular invasion; IL-6, interleukin-6.
Patient Consent Statement
Since this study is retrospective and MRI is a commonly used examination method in clinical practice, this study was approved by the two institutional review boards (Nanfang Hospital of Southern Medical University and Sun Yat-sen University Cancer Center) and the requirement for informed consent was waived. We adhere to the 1964 《 Declaration of Helsinki 》 and subsequent amendments or similar ethical standards. And we confirm that all clinical data contained in this study have been anonymous or confidential.
Acknowledgments
We want to thank the whole study team at 2 Hospitals (Nanfang Hospital of Southern Medical University and Sun Yat-sen University Cancer Center) and 1 laboratory (Key Laboratory of Hunan Province for Internet of Things and Information Security, Xiangtan University) for their continuous support.
Funding
This study has received funding from the Natural Science Foundation of Guangdong province (2018A030313951), the Science and Technology Planning Project of Ganzhou (2022--RC1339, 2022-ZD1373).
Disclosure
The authors report no conflicts of interest in this work.
References
1. Beaufrère A, Calderaro J, Paradis V. Combined hepatocellular-cholangiocarcinoma: an update. J Hepatol. 2021;74:1212–1224. doi:10.1016/j.jhep.2021.01.035
2. Rosenberg N, Van Haele M, Lanton T, et al. Combined hepatocellular-cholangiocarcinoma derives from liver progenitor cells and depends on senescence and IL-6 trans-signaling. J Hepatol. 2022;77:1631–1641. doi:10.1016/j.jhep.2022.07.029
3. Wang G, Wang Q, Liang N, et al. Oncogenic driver genes and tumor microenvironment determine the type of liver cancer. Cell Death Dis. 2020;11:313 doi:10.1038/s41419-020-2509-x.
4. Moeini A, Sia D, Zhang Z, et al. Mixed hepatocellular cholangiocarcinoma tumors: cholangiolocellular carcinoma is a distinct molecular entity. J Hepatol. 2017;66:952–961. doi:10.1016/j.jhep.2017.01.010
5. Park YH, Hwang S, Ahn CS, et al. Long-term outcome of liver transplantation for combined hepatocellular carcinoma and cholangiocarcinoma. Transplant Proc. 2013;45:3038–3040. doi:10.1016/j.transproceed.2013.08.056
6. Allen RA, Lisa JR. Combined liver cell and bile duct carcinoma. Am J Clin Pathol. 1949;4:647–655.
7. Groeschl RT, Turaga KK, Gamblin TC. Transplantation versus resection for patients with combined hepatocellular carcinoma-cholangiocarcinoma. J Surg Oncol. 2013;107:608–612. doi:10.1002/jso.23289
8. Sapisochin G, Fidelman N, Roberts JP, Yao FY. Mixed hepatocellular cholangiocarcinoma and intrahepatic cholangiocarcinoma in patients undergoing transplantation for hepatocellular carcinoma. Liver Transplant. 2011;17:934–942. doi:10.1002/lt.22307
9. Kim KH, Lee SG, Park EH, et al. Surgical treatments and prognoses of patients with combined hepatocellular carcinoma and cholangiocarcinoma. Ann Surg Oncol. 2009;16:623–629. doi:10.1245/s10434-008-0278-3
10. Koh KC, Lee H, Choi MS, et al. Clinicopathologic features and prognosis of combined hepatocellular cholangiocarcinoma. Am J Surg. 2005;189:120–125. doi:10.1016/j.amjsurg.2004.03.018
11. Liu C, Fan S, Lo C, et al. Hepatic resection for combined hepatocellular and cholangiocarcinoma. Arch Surg. 2003;138:86–90. doi:10.1001/archsurg.138.1.86
12. Kim JH, Yoon HK, Ko GY, et al. Nonresectable combined hepatocellular carcinoma and cholangiocarcinoma: analysis of the response and prognostic factors after transcatheter arterial chemoembolization. RADIOLOGY. 2010;255:270–277. doi:10.1148/radiol.09091076
13. Lee W, Lee K, Heo J, et al. Comparison of combined hepatocellular and cholangiocarcinoma with hepatocellular carcinoma and intrahepatic cholangiocarcinoma. Surg Today. 2006;36:892–897. doi:10.1007/s00595-006-3276-8
14. Vilchez V, Shah MB, Daily MF, et al. Long-term outcome of patients undergoing liver transplantation for mixed hepatocellular carcinoma and cholangiocarcinoma: an analysis of the UNOS database. HPB. 2016;18:29–34. doi:10.1016/j.hpb.2015.10.001
15. Dahiya D, Wu T, Lee C, Chan K, Lee W, Chen M. Minor versus major hepatic resection for small hepatocellular carcinoma (HCC) in cirrhotic patients: a 20-year experience. SURGERY. 2010;147:676–685. doi:10.1016/j.surg.2009.10.043
16. Wang Y, Yang Q, Li S, Luo R, Mao S, Shen J. Imaging features of combined hepatocellular and cholangiocarcinoma compared with those of hepatocellular carcinoma and intrahepatic cholangiocellular carcinoma in a Chinese population. Clin Radiol. 2019;74:401–407. doi:10.1016/j.crad.2019.01.016
17. Li R, Yang D, Tang C, et al. Combined hepatocellular carcinoma and cholangiocarcinoma (biphenotypic) tumors: clinical characteristics, imaging features of contrast-enhanced ultrasound and computed tomography. BMC CANCER. 2016;16:158. doi:10.1186/s12885-016-2156-x
18. Joo I, Lee JM, Lee DH, Jeon JH, Han JK. Retrospective validation of a new diagnostic criterion for hepatocellular carcinoma on gadoxetic acid-enhanced MRI: can hypointensity on the hepatobiliary phase be used as an alternative to washout with the aid of ancillary features? Eur Radiol. 2019;29:1724–1732. doi:10.1007/s00330-018-5727-1
19. Fraum TJ, Tsai R, Rohe E, et al. Differentiation of hepatocellular carcinoma from other hepatic malignancies in patients at risk: diagnostic performance of the liver imaging reporting and data system version 2014. RADIOLOGY. 2018;286:158–172. doi:10.1148/radiol.2017170114
20. Zhou C, Lu X, Wang Y, Qian X, Yang C, Zeng M. Histopathological components correlated with MRI features and prognosis in combined hepatocellular carcinoma-cholangiocarcinoma. Eur Radiol. 2022;32:6702–6711. doi:10.1007/s00330-022-09065-y
21. Kim T, Kim H, Joo I, Lee JM. Combined hepatocellular-cholangiocarcinoma: changes in the 2019 world health organization histological classification system and potential impact on imaging-based diagnosis. Korean J Radiol. 2020;21:1115. doi:10.3348/kjr.2020.0091
22. Li C, Zheng X, Guo H, et al. Differentiation between combined hepatocellular cholangiocarcinoma and hepatocellular carcinoma: comparison of diagnostic performance between ultrasonics-based model and CEUS LI-RADS v2017. BMC Med Imaging. 2022;22:36. doi:10.1186/s12880-022-00765-x
23. Lu L, Zhang C, Yu X, et al. The value of contrast-enhanced magnetic resonance imaging enhancement in the differential diagnosis of hepatocellular carcinoma and combined hepatocellular cholangiocarcinoma. J Oncol. 2022;2022:4691172 doi:10.1155/2022/4691172.
24. Zwanenburg A, Vallières M, Abdalah MA, et al. The image biomarker standardization initiative: standardized quantitative radiomics for high-throughput image-based phenotyping. RADIOLOGY. 2020;295:328–338. doi:10.1148/radiol.2020191145
25. Hwang J, Kim YK, Park MJ, et al. Differentiating combined hepatocellular and cholangiocarcinoma from mass-forming intrahepatic cholangiocarcinoma using gadoxetic acid-enhanced MRI. J Magn Reson Imaging. 2012;36:881–889. doi:10.1002/jmri.23728
26. Zhou Y, Zhou G, Zhang J, Xu C, Zhu F, Xu P. DCE-MRI based radiomics nomogram for preoperatively differentiating combined hepatocellular-cholangiocarcinoma from mass-forming intrahepatic cholangiocarcinoma. Eur Radiol. 2022;7:5004–5015. doi:10.1007/s00330-022-08548-2
27. Yin P, Mao N, Zhao C, et al. Comparison of radiomics machine-learning classifiers and feature selection for differentiation of sacral chordoma and sacral giant cell tumour based on 3D computed tomography features. Eur Radiol. 2019;29:1841–1847. doi:10.1007/s00330-018-5730-6
28. Wu Y, Liu H, Zeng J, et al. Development and validation of nomogram to predict very early recurrence of combined hepatocellular-cholangiocarcinoma after hepatic resection: a multi-institutional study. World J Surg Oncol. 2022;20:20. doi:10.1186/s12957-022-02488-3
29. Park HJ, Park B, Park SY, et al. Preoperative prediction of postsurgical outcomes in mass-forming intrahepatic cholangiocarcinoma based on clinical, radiologic, and radiomics features. Eur Radiol. 2021;31:8638–8648. doi:10.1007/s00330-021-07926-6
30. Shan Q, Hu H, Feng S, et al. CT-based peritumoral radiomics signatures to predict early recurrence in hepatocellular carcinoma after curative tumor resection or ablation. CANCER IMAGING. 2019;19:19. doi:10.1186/s40644-019-0203-y
31. Zhang J, Wang X, Zhang L, et al. Radiomics predict postoperative survival of patients with primary liver cancer with different pathological types. Ann Transl Med. 2020;8:820. doi:10.21037/atm-19-4668
32. Zhang Z, Jiang H, Chen J, et al. Hepatocellular carcinoma: radiomics nomogram on gadoxetic acid-enhanced MR imaging for early postoperative recurrence prediction. CANCER IMAGING. 2019;19:22 doi:10.1186/s40644-019-0209-5.
33. Li YM, Zhu YM, Gao LM, et al. Radiomic analysis based on multi-phase magnetic resonance imaging to predict preoperatively microvascular invasion in hepatocellular carcinoma. World J Gastroenterol. 2022;28:2733–2747. doi:10.3748/wjg.v28.i24.2733
34. Gao L, Xiong M, Chen X, et al. Multi-region radiomic analysis based on multi-sequence MRI can preoperatively predict microvascular invasion in hepatocellular carcinoma. Front Oncol. 2022;12:818681 doi:10.3389/fonc.2022.818681.
35. Lv K, Cao X, Du P, Fu JY, Geng DY, Zhang J. Radiomics for the detection of microvascular invasion in hepatocellular carcinoma. World J Gastroenterol. 2022;28:2176–2183. doi:10.3748/wjg.v28.i20.2176
36. Choi SH, Lee SS, Park SH, et al. LI-RADS Classification and Prognosis of Primary Liver Cancers at Gadoxetic Acid-enhanced MRI. RADIOLOGY. 2019;290:388–397. doi:10.1148/radiol.2018181290
37. Song D, Zhu K, Tan J, et al. Perioperative and oncologic outcomes of laparoscopic versus open liver resection for combined hepatocellular-cholangiocarcinoma: a propensity score matching analysis. Surg Endo. 2022;37(2):967–976 doi:10.1007/s00464-022-09579-y.
38. Xiao Y, Zheng X, Zhou C, et al. Combined hepatocellular carcinoma-cholangiocarcinoma with a predominant HCC component: better survival and MRI-based prediction. Eur Radiol. 2022;33:1412–1421. doi:10.1007/s00330-022-09131-5
39. Jeon SK, Joo I, Lee DH, et al. Combined hepatocellular cholangiocarcinoma: LI-RADS v2017 categorisation for differential diagnosis and prognostication on gadoxetic acid-enhanced MR imaging. Eur Radiol. 2019;29:373–382. doi:10.1007/s00330-018-5605-x
 © 2023 The Author(s). This work is published and licensed by Dove Medical Press Limited. The
full terms of this license are available at https://www.dovepress.com/terms
and incorporate the Creative Commons Attribution
- Non Commercial (unported, 3.0) License.
By accessing the work you hereby accept the Terms. Non-commercial uses of the work are permitted
without any further permission from Dove Medical Press Limited, provided the work is properly
attributed. For permission for commercial use of this work, please see paragraphs 4.2 and 5 of our Terms.
© 2023 The Author(s). This work is published and licensed by Dove Medical Press Limited. The
full terms of this license are available at https://www.dovepress.com/terms
and incorporate the Creative Commons Attribution
- Non Commercial (unported, 3.0) License.
By accessing the work you hereby accept the Terms. Non-commercial uses of the work are permitted
without any further permission from Dove Medical Press Limited, provided the work is properly
attributed. For permission for commercial use of this work, please see paragraphs 4.2 and 5 of our Terms.