Back to Journals » Clinical Ophthalmology » Volume 15
Radiological Characteristics of Extraocular Muscles in Myasthenia Gravis Patients with Ocular Manifestations: A Case–Control Study
Authors Lueangaram S, Tritanon O, Siriyotha S, Vanikieti K, Padungkiatsagul T ![]() , Preechawat P, Poonyathalang A
, Preechawat P, Poonyathalang A ![]() , Dejthevaporn C, Pulkes T
, Dejthevaporn C, Pulkes T ![]() , Tunlayadechanont S, Jindahra P
, Tunlayadechanont S, Jindahra P ![]()
Received 1 February 2021
Accepted for publication 21 April 2021
Published 1 June 2021 Volume 2021:15 Pages 2279—2285
DOI https://doi.org/10.2147/OPTH.S280508
Checked for plagiarism Yes
Review by Single anonymous peer review
Peer reviewer comments 2
Editor who approved publication: Dr Scott Fraser
Sirin Lueangaram,1 Oranan Tritanon,2 Sukanya Siriyotha,3 Kavin Vanikieti,1 Tanyatuth Padungkiatsagul,1 Pisit Preechawat,1 Anuchit Poonyathalang,1 Charungthai Dejthevaporn,4 Teeratorn Pulkes,4 Supoch Tunlayadechanont,4 Panitha Jindahra4
1Department of Ophthalmology, Faculty of Medicine Ramathibodi Hospital, Mahidol University, Bangkok, Thailand; 2Department of Diagnostic and Therapeutic Radiology, Faculty of Medicine Ramathibodi Hospital, Mahidol University, Bangkok, Thailand; 3Department of Clinical Epidemiology and Biostatistics, Faculty of Medicine Ramathibodi Hospital, Mahidol University, Bangkok, Thailand; 4Department of Medicine, Faculty of Medicine Ramathibodi Hospital, Mahidol University, Bangkok, 10400, Thailand
Correspondence: Panitha Jindahra
Division of Neurology, Department of Medicine, Faculty of Medicine, Ramathibodi Hospital, Mahidol University, 270 Rama VI Road, Thung Phayathai, Ratchatewi, Bangkok, 10400, Thailand
Tel +6622011386
Email [email protected]
Purpose: To analyze radiological characteristics of the extraocular muscles (EOMs) in myasthenia gravis (MG) patients with ocular manifestations.
Patients and Methods: This retrospective case–control study included all MG cases with ocular manifestations, who attended a neuro-ophthalmology clinic at a university hospital, Bangkok, from April 2009 to June 2018. They experienced double vision and ophthalmoplegia. Control participants had normal eye movements. Orbital scans were thoroughly reviewed. We measured muscle thickness (MT) of the superior rectus, inferior rectus, medial rectus and lateral rectus muscles in both eyes using magnetic resonance imaging or computed tomography scan. The sum of the muscle thickness at all sites was calculated (MTsum). Comparisons of the mean MT of each muscle type and the mean MTsum between the MG and control groups were performed by using Student’s t-test. MRI signal intensities of the EOMs were also recorded.
Results: Twenty MG cases and 20 controls were included in the study. The mean MTsum was 23.7 (standard deviation 4.8) mm in the MG group and 32.6 (3.5) mm in the controls. There were statistically significant differences between the two groups with respect to the mean MT and mean MTsum (p < 0.001). In the MG group, there was a negative correlation between the MTsum and disease duration (p= 0.03). By using coronal T2-weighted orbital MRI with fat suppression (T2W/FS), the most frequent finding was isointensity with central hypointensity of the EOMs in the MG group.
Conclusion: Atrophic EOMs were frequently found in the MG group, particularly in chronic cases. Isointensity with central hypointensity of EOMs on T2W/FS was also common in the MG group. These findings highlight the importance of muscle involvement in MG and may be helpful for clinical decision-making.
Keywords: myasthenia gravis, acetylcholine receptor antibodies, extraocular muscles, extraocular muscle atrophy, central hypodensity
Introduction
Myasthenia gravis (MG) is an autoimmune disorder of the neuromuscular junction, frequently mediated by anti-acetylcholine receptor antibodies (anti-AChR-Ab) and anti-muscle-specific tyrosine kinase antibodies (anti-MuSK-Ab). The diagnosis is usually based on clinical symptoms and signs. Common symptoms are fluctuation of double vision, drooping eyelids, limb weakness, and difficulties with speech, swallowing, and breathing. Differential diagnoses of MG include chronic progressive external ophthalmoplegia (CPEO), inflammatory myositis, Miller-Fisher syndrome, and brainstem lesions. Establishing a diagnosis can be challenging in treatment-resistant patients. It would be helpful if there is an additional test for clinical judgement. Magnetic resonance imaging (MRI) enables noninvasive visualization of muscles and extraocular muscles (EOMs). It is increasingly being used in the evaluation of muscle disorders. Besides, EOMs are commonly affected in MG. However, MRI is not frequently performed in MG cases and radiological characteristics of MG are limited.1–3 The goal of this study was to analyze the radiological patterns of the EOMs in MG cases with ocular manifestations.
Patients and Methods
Patients
This retrospective, case–control study included all MG patients with ocular manifestations, who attended a neuro-ophthalmology clinic in Ramathibodi Hospital, Bangkok, from April 2009 to June 2018. The study established the completeness of reporting, as defined by adherence STARD 2015.4 Inclusion criteria for MG were 1) double vision and ophthalmoplegia; 2) fluctuating course; 3) ocular examinations consistent with MG, such as positive fatigability test, Cogan’s lid twitch, and fast saccadic eye movement; 4) at least one of the following tests was positive: anti-AChR-Ab, decremental response (>10%) of a compound muscle action potential on 2–3-Hz repetitive nerve stimulation and increased jitter on single-fiber electromyography; 5) exclusion of alternative diagnoses; and 6) available orbital MRI or computerized tomography (CT) scans. The patients might or might not have experienced dysarthria, difficulty in swallowing, limb weakness and respiratory symptoms. All cases had been diagnosed with MG before inclusion in the study. Exclusion criteria for the MG group were alternative diagnoses such as CPEO, Miller-Fisher syndrome, cranial nerve palsies or brainstem lesions; and no orbital scans. Inclusion criteria for the controls were 1) no double vision; 2) normal eye movements; and 3) available orbital MRI/CT scans. The controls attended the same neuro-ophthalmology clinic and had orbital scans performed during the same period of time. They experienced orbital pain or optic neuropathy (inflammation, infarction, toxin, and compression). All orbital scans were carried out only for routine clinical care long before the study was performed.
Orbital Scans
The MRI examinations were performed on a 3.0-T scanner (Ingenia; Philips Healthcare, Best, Netherlands) with a standard head coil and our routine brain and orbital MRI protocols. Imaging sequences of the orbital MRI included axial and coronal contrast-enhanced T1-weighted images with fat suppression (CE-T1W/FS) and T2-weighted images with fat suppression (T2W/FS). Coronal CE-T1W/FS images were performed with TR = 500–700, TE=10, matrix size = 450×450, FOV = 180×180, slice thickness 3 mm, and intersection gap 0.3 mm. Coronal T2W FS images were acquired with TR = 3000–5000, TE=80–120, matrix size = 450×450, FOV = 180×180, slice thickness 3 mm, and intersection gap 0.3 mm. The CT examinations were conducted with a 64-channel multidetector CT scanner (IQon Elite Spectral CT scanner; Philips Healthcare, Best, Netherlands). Imaging sequences included unenhanced and contrast-enhanced axial images. A standard CT protocol was performed with an injection of nonionic-iodinated contrast (1 mL/kg) at a rate of 1.2–1.5 mL/s and a 60–70-s delay for the venous phase. CT images were acquired with reconstructed slice thickness of 1 mm. The orbital MRI or CT scans of all participants were reviewed by the neuroradiologist (O.T.) with 8 years of experience, who was unaware of the clinical diagnoses. Muscle thicknesses (MT) of superior rectus (SR), inferior rectus (IR), medial rectus (MR) and lateral rectus (LR) in both eyes were measured (mm.) perpendicularly to the muscle at the thickest part using the coronal CE-T1W/FS of orbital MRI or contrast enhanced CT (Figure 1). We evaluated the entire muscle and measured the thickness at least 3 points. The thickest point of each muscle was then selected. As it is difficult to separate the SR and the levator palpebrae, we included the levator palpebrae for the SR measurement. The sum of the muscle thickness at all sites was calculated (MTsum). Signal intensities of the EOMs on coronal T2W/FS images were classified as 1) isointensity, 2) hypointensity, 3) hyperintensity or 4) Isointensity with central hypointensity. The cerebral cortex was the reference point for muscle intensity.
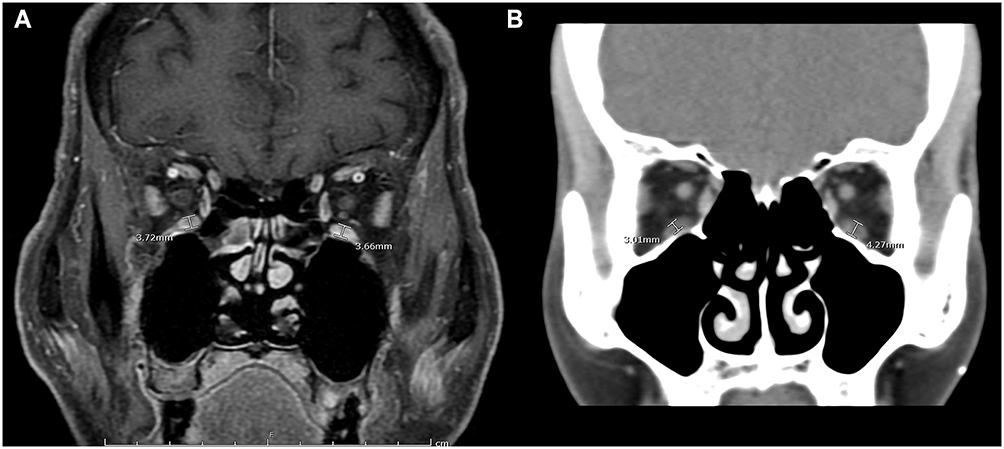 |
Figure 1 (A) Coronal contrast-enhanced T1-weighted orbital magnetic resonance imaging with fat suppression (CE-T1W/FS) in a patient with myasthenia gravis. (B) Coronal orbital computerized tomography scan in a patient with myasthenia gravis. The thickest part of bilateral inferior rectus muscles was measured (white line) in both cases. |
Ethical Issue
The study was approved by the Ethical Clearance Committee on Human Rights Related to Research Involving Human Subjects, Faculty of Medicine Ramathibodi Hospital, Mahidol University, and followed the ethical principles in the Declaration of Helsinki (ID: COA.MURA.2019/556). The patient informed consent to review their medical records was not required by the ethics committee because the research involved no more than minimal risks; the waiver of informed consent will not adversely affect the rights and welfare of the subjects; it was not practicable to conduct the research without the waiver or alteration; whenever appropriate, participants will be provided with additional pertinent information after their participation.
Statistical Analysis
The Student’s t-test was used to compare the mean of MTsum and the mean MT of each muscle between the two groups. The Shapiro–Wilk W-test was evaluated before calculating the Student’s t-tests. The test revealed that the data was normally distributed. Correlation between the sum of muscle thick MTsum and the disease duration (years) in the MG group was analyzed using Spearman correlation coefficient analysis. P-values of less than 0.05 were considered to be statistically significant. Stata 15.1 (College Station, Tx; StataCorp. LLC.) was used in the analysis.
Results
Demographic Data
A total of 40 participants were included in the study. There were 20 cases in the MG group [aged 17–63 years (mean 42.1, standard deviation (SD) 13.8); 14 females (70%); 5 patients (25%) had thymoma and 10 (50%) were seropositive to anti-AChR-Ab]. Disease duration ranged from 0.083 to 30 years (median 4.5). Of the MG cases, orbital MRIs were performed in 14, whereas orbital CT scans were performed in the others. There were 20 participants in the control group [aged 22–78 years (mean 56.2, SD 15.2); 16 females (80%)].
Muscle Thickness
Of all 40 participants, the mean MTsum was 23.7 mm (SD 4.8) in the MG group and 32.6 mm (SD 3.5) in the control group. There was a statistically significant difference in the mean MTsum between the two groups (p <0.001). Table 1 shows the mean MT of each muscle in both groups. There were statistically significant differences in the mean MT of each muscle between the two groups. There was no statistically significant difference in the mean MTsum between seropositive and seronegative MG patients (mean 21.9, SD 4.2; mean 25.3 SD, 5.1, respectively; p=0.12). Of all MG patients, 55% received prednisolone before the scan examinations. There was no statistically significant difference in the mean MTsum between prednisolone treatment and no prednisolone treatment subgroups (mean 21.9, SD 4.8; mean 25.9, SD 4.1, respectively; p=0.06). Of all MG patients, there was a negative correlation between the MTsum and disease duration (Spearman’s rank correlation coefficient of −0.49, p =0.03) (Figure 2). There was no significant correlation between the MTsum and age (p=0.36).
 |
Table 1 Mean Muscle Thickness of Each Muscle in the Myasthenia Gravis and Control Groups in All Participants |
 |
Figure 2 Graph of the correlation between the sum of muscle thickness (mm) and disease duration (years) in the myasthenia gravis group. |
MRI Subgroup Analysis
Of all 35 participants who had MRI scans performed, there were 14 MG patients (disease duration 0.083–30 years [median 5]) and 20 controls. The mean MTsum was 24.4 mm (SD 5.0) in the MG group and 32.6 mm (SD 3.5) in the control group. There was a statistically significant difference in the mean MTsum between the two groups (p <0.001). Table 2 shows the mean MT of each muscle in both groups. There were statistically significant differences in the mean MT of each muscle between the two groups.
 |
Table 2 Mean Muscle Thickness of Each Muscle in the Myasthenia Gravis and Control Groups in Participants with MRI Scans |
Muscle Signal Intensities
Orbital MRIs were reviewed in 14 MG cases. The signal intensities of the MR, LR, SR and IR muscles were recorded (total muscle number=112) with poor visualization in 10 muscles (8.9%). Of the remaining 102 muscles, the most frequent signal intensity in coronal T2W/FS images was isointensity with central hypointensity (n=66, 64.7%), followed by isointensity (n=32, 31.4%) and hypointensity (n=4, 3.9%). There was no hyperintensity in any muscle. Isointensity with central hypointensity was mainly observed in the MR, SR, and IR muscles in cases with disease duration between 0.1 and 30 years (median 5.5 years) (Figure 3). Conversely, isointensity was frequently found in the LR muscles. The signal intensities of the MR, LR, SR and IR muscles were also recorded in the controls (total muscle number=160). Of the 160 muscles, the most frequent signal intensity was isointensity (n=140, 87.5%), followed by isointensity with central hypointensity (n=20, 12.5%). Neither hypointensity nor hyperintensity was demonstrated in the controls. Isointensity was the most frequent signal in all muscle groups. In the controls, isointensity with central hypointensity was demonstrated in participants aged 71–80 (75%), 61–70 (0%), 51–60 (25%), 41–50 (50%), 31–40 (0%), and 21–30 years (0%).
 |
Figure 3 (A) Coronal T2-weighted orbital magnetic resonance imaging with fat suppression (T2W/FS) and (B) coronal CE-T1W/FS in a 49-year-old woman with myasthenia gravis for 10 years, showing bilateral extraocular muscle (EOM) atrophy and isointensity with central hypointensity of bilateral inferior rectus muscles (arrow); (C) Coronal T2W/FS and (D) coronal CE-T1W/FS in a control participant, showing normal EOM size and isointense muscles. |
Discussion
The EOM thickness of the controls in this study was comparable to the standard values measured in the healthy Thai population.1 This study demonstrated EOM atrophy in the acute and chronic MG cases, being more pronounced in patients with long disease duration. Additionally, the EOM thickness in patients treated with prednisolone did not significantly differ from those without the treatment. The findings were more or less the same as those in previous case reports.2–5 Using CT/MRI scans, two case reports demonstrated bilateral EOM atrophy in anti-AChR-Ab and anti-MuSK-Ab MG with long disease duration.3,5 Keene et al recently demonstrated an increase in fat fraction of EOMs in acute and chronic anti-AChR-Ab MG, using 7-T MRI with Dixon and multi-echo spin-echo sequences. The findings indicate fat replacement in the EOMs in the early phase of the disease.6 Moreover, muscle atrophy also extends beyond the EOMs. There was MRI evidence of early muscle atrophy in anti-AChR-Ab MG in the posterior cervical, paraspinal, sternocleidomastoid, and masseter muscles.7 Farrugia et al showed MRI evidence of bulbar- and facial-muscle wasting in chronic anti-MuSK-Ab MG.8
A study of an anti-AChR-Ab-positive patient showed fibrosis in the SR, which corresponded with EOM atrophy in the orbital MRIs.2 Although fibrosis is a pathological feature of chronic inflammation, we observed atrophic muscles in some acute cases. MG seems to manifest differently among patients as EOM atrophy can occur early or many years later in the course of the disease. The study showed that MG, a primary neuromuscular junction disorder, can eventually affect the muscle fibers.2 Besides, a few pathological studies demonstrated lymphocyte infiltrations in the muscles of MG patients. The inflammatory responses damage the motor endplates, leading to denervation of the muscles and subsequent muscle atrophy.2,9–11 Mitochondrial damage and fibro-fatty replacement were commonly found in myasthenic EOMs, particularly in anti-MuSK-Ab MG.11 Additionally, Martignago et al compared myopathological features between anti-AchR-Ab and anti-MuSK-Ab in skeletal muscles. They demonstrated muscle atrophy in both conditions with more mitochondrial involvement in muscle biopsies of anti-MuSK-Ab MG.12 These findings contribute to the treatment-resistance of myasthenic ophthalmoplegia.
EOM atrophy was also observed in CPEO and cranial neuropathies.13–15 A study compared EOM volume among patients with CPEO, MG, and cranial neuropathies. It demonstrated that the patients with cranial neuropathies had the smallest muscles. The EOM volume in CPEO and MG did not differ significantly. One of the characteristics of CPEO was an abnormally bright signal within the EOMs on T1W orbital scans.14 On the contrary, isointensity with central hypointensity on coronal T2W/FS was prominent in the MG cases in our study. This might be due to central fibrosis of the muscles. It was less likely to be the orbital fat because the orbital fat in the surroundings was suppressed entirely (Figure 3).
A limitation of this study was a possible selection bias that only patients with available scans were included. This limits the generalizability of the study results. Further cohort studies are required to address this issue.
Conclusion
Atrophic EOMs and isointensity with central hypointensity of the muscles on T2W/FS were frequently found in the MG group. EOM atrophy was found in the early course of the disease and becoming more prominent in chronic cases. These findings highlight the importance of muscle involvement in MG and may be helpful for clinical decision-making.
Acknowledgment
Sirin Lueangaram and Oranan Tritanon are joint first authors.
Funding
The study was supported by Division of Neurology, Department of Medicine, Faculty of Medicine Ramathibodi Hospital, Mahidol University.
Disclosure
The authors report no conflicts of interest in this work.
References
1. Lerdlum S, Boonsirikamchai P, Setsakol E. Normal measurement of extraocular muscle using computed tomography. J Med Assoc Thai. 2007;90:307–312.
2. Gratton S, Herro A, Bermudez-Magner J, Guy J. Atrophy and fibrosis of extraocular muscles in anti-acetylcholine receptor antibody myasthenia gravis. Open J Ophthalmol. 2014;4:117–119. doi:10.4236/ojoph.2014.44019
3. Chan JW, Orrison WW. Ocular myasthenia: a rare presentation with MuSK antibody and bilateral extraocular muscle atrophy. Br J Ophthalmol. 2007;91:842–843. doi:10.1136/bjo.2006.108498
4. Bossuyt PM, Reitsma JB, Bruns DE, et al. STARD Group. STARD 2015: an updated list of essential items for reporting diagnostic accuracy studies. Radiology. 2015;277:826–832. doi:10.1148/radiol.2015151516
5. Okamoto K, Ito J, Tokiguchi S, Furusawa T. Atrophy of bilateral extraocular muscles: CT and clinical features of seven patients. J Neuroophthalmol. 1996;16:286–288. doi:10.1097/00041327-199612000-00012
6. Keene KR, van Vught L, van de Velde NM, et al. The feasibility of quantitative MRI of extra-ocular muscles in myasthenia gravis and Graves’ orbitopathy. NMR Biomed. 2021;34(1):e4407. doi:10.1002/nbm.4407
7. Zouvelou V, Rentzos M, Toulas P, Evdokimidis I. AchR-positive myasthenia gravis with MRI evidence of early muscle atrophy. J Clin Neurosci. 2012;19:918–919. doi:10.1016/j.jocn.2011.09.022
8. Ferrugia ME, Robson MD, Clover L, et al. MRI and clinical studies of facial and bulbar muscle involvement in MuSK antibody-associated myasthenia gravis. Brain. 2006;129:1481–1492. doi:10.1093/brain/awl095
9. Russell D. Histological changes in the striped muscles in myasthenia gravis. J Pathol Bacteriol. 1953;65:279–289. doi:10.1002/path.1700650202
10. Oosterhuis H, Bethlem J. Neurogenic muscle involvement in myasthenia gravis: a clinical and histopathological study. J Neurol Neurosurg Psychiatry. 1973;36:244–254. doi:10.1136/jnnp.36.2.244
11. Europa TA, Nel M, Heckmann JM. A review of the histopathological findings in myasthenia gravis: clues to the pathogenesis of treatment-resistance in extraocular muscles. Neuromuscular Disord. 2019;29:381–387. doi:10.1016/j.nmd.2019.03.009
12. Martignago S, Fanin M, Albertini E, Pegoraro E, Angelini C. Muscle histopathology in myasthenia gravis with antibodies against MuSK and AChR. Neuropathol Appl Neurobiol. 2009;35:103–110. doi:10.1111/j.1365-2990.2008.00965.x
13. Ortube MC, Bhola R, Demer JL. Orbital magnetic resonance imaging of extraocular muscles in chronic progressive external ophthalmoplegia: specific diagnostic findings. J AAPOS. 2006;10:414–418. doi:10.1016/j.jaapos.2006.04.012
14. Yu-Wai-Man C, Smith FE, Firbank MJ, et al. Extraocular muscle atrophy and central nervous system involvement in chronic progressive external ophthalmoplegia. PLoS One. 2013;8:e75048. doi:10.1371/journal.pone.0075048
15. Demer JL, Ortube MC, Engle EC, et al. High-resolution magnetic resonance imaging demonstrates abnormalities of motor nerves and extraocular muscles in patients with neuropathic strabismus. J AAPOS. 2006;10(2):135–142. doi:10.1016/j.jaapos.2005.12.006
 © 2021 The Author(s). This work is published and licensed by Dove Medical Press Limited. The
full terms of this license are available at https://www.dovepress.com/terms
and incorporate the Creative Commons Attribution
- Non Commercial (unported, 3.0) License.
By accessing the work you hereby accept the Terms. Non-commercial uses of the work are permitted
without any further permission from Dove Medical Press Limited, provided the work is properly
attributed. For permission for commercial use of this work, please see paragraphs 4.2 and 5 of our Terms.
© 2021 The Author(s). This work is published and licensed by Dove Medical Press Limited. The
full terms of this license are available at https://www.dovepress.com/terms
and incorporate the Creative Commons Attribution
- Non Commercial (unported, 3.0) License.
By accessing the work you hereby accept the Terms. Non-commercial uses of the work are permitted
without any further permission from Dove Medical Press Limited, provided the work is properly
attributed. For permission for commercial use of this work, please see paragraphs 4.2 and 5 of our Terms.