Back to Journals » International Journal of Nanomedicine » Volume 10 » Issue 1
Quantum dot-based multiplexed imaging in malignant ascites: a new model for malignant ascites classification
Authors Zeng W, Peng C, Yuan J, Cui R, Li Y ![]()
Received 28 June 2014
Accepted for publication 28 November 2014
Published 5 March 2015 Volume 2015:10(1) Pages 1759—1768
DOI https://doi.org/10.2147/IJN.S70228
Checked for plagiarism Yes
Review by Single anonymous peer review
Peer reviewer comments 4
Editor who approved publication: Professor Carlos Rinaldi
Wei-Juan Zeng,1 Chun-Wei Peng,1 Jing-Ping Yuan,1 Ran Cui,2 Yan Li1
1Department of Oncology, Zhongnan Hospital of Wuhan University, Hubei Key Laboratory of Tumor Biological Behaviors and Hubei Cancer Clinical Study Center, Wuhan, People’s Republic of China; 2Key Laboratory of Analytical Chemistry for Biology and Medicine (Ministry of Education) and College of Chemistry and Molecular Sciences, Wuhan University, Wuhan, People’s Republic of China
Purpose: The aims of this study are to establish a new method for simultaneously detecting the interactions between cancer cells and immunocytes in malignant ascites (MA) and to propose a new model for MA classification.
Methods: A quantum dot (QD)-based multiplexed imaging technique was developed for simultaneous in situ imaging of cancer cells, lymphocytes, and macrophages. This method was first validated in gastric cancer tissues, and then was applied to MA samples from 20 patients with peritoneal carcinomatosis from gastrointestinal and gynecological origins. The staining features of MA and the interactions between cancer cells and immunocytes in the ascites were further analyzed and correlated with clinical features.
Results: The QD-based multiplexed imaging technique was able to simultaneously show gastric cancer cells, infiltrating macrophages, and lymphocytes in tumor tissue, and the technique revealed the distinctive features of the cancer tumor microenvironment. When this multiplexed imaging protocol was applied to MA cytology, different features of the interactions and quantitative relations between cancer cells and immunocytes were observed. On the basis of these features, MA could be classified into immunocyte-dominant type, immunocyte-reactive type, cancer cell-dominant type, and cell deletion type; the four categories were statistically different in terms of the ratio of cancer cells to immunocytes (P<0.001). Moreover, in the MA, the ratio of cancer cells to immunocytes was higher for patients with gynecological and gastric cancers than for those with colorectal cancer.
Conclusion: The newly developed QD-based multiplexed imaging technique was able to better reveal the interactions between cancer cells and immunocytes. This advancement allows for better MA classification and, thereby, allows for treatment decisions to be more individualized.
Keywords: gastric cancer, malignant ascites, quantum dots, classification, multiplexed imaging
Introduction
Malignant ascites (MA), defined as the abnormal accumulation of cancer-containing fluid in the peritoneal cavity, is a sign of peritoneal carcinomatosis.1 It is caused by a variety of primary abdominal and extra-abdominal cancers. The former category mainly includes gastric cancer (GC), colorectal cancer, pancreatic cancer, ovarian cancer, and primary peritoneal carcinomatosis. The category of extra-abdominal cancers includes breast cancer, lung cancer, lymphoma, and some unknown primary cancers.1,2 MA presents a difficult clinical problem that causes distressful symptoms, including abdominal pain and distension, nausea, vomiting, dyspnea, and anorexia. MA is a grave prognostic sign with a median survival time of less than 6 months.1–4
There are no curative therapies for MA. The current treatments include sodium- restricted diets, paracentesis, diuretic therapy, peritoneovenous shunting, and chemotherapy. These are palliative procedures mainly to relieve symptoms, and they have limited efficacy and some degree of risk.1,2 MA is distinctive exudate containing cancer cells, macrophages, mesothelium cells, lymphocytes, and other cell components. Macrophages and lymphocytes are immunocytes; both have been confirmed to play important roles in cancer progression.5–9
At present, studies on MA at the cellular level are limited. In clinical practice, MA is mainly used to prepare cell smears to observe whether there are cancer cells. The immunocytes have not been investigated systematically.
The staining methods mainly include Giemsa staining, Haematoxylin and Eosin (HE) staining, and immunohistochemistry (IHC). Giemsa staining and HE staining are single-color staining techniques that focus on cancer cells and are not able to reveal different cell types simultaneously. Although IHC can be visible with multiplexed imaging, IHC multiplexed imaging techniques based on organic dyes and fluorescent proteins such as fluorescein isothiocyanate and rhodamine have several shortcomings in common.7–9 As a result, these organic dye-based or fluorescent protein-based IHC multiplexed imaging technologies are usually limited to research purposes and have few clinical applications.10–12
Quantum dots (QDs) are inorganic nanoparticles with unique optical and electronic properties. They have promising potential applications in many fields, such as medicine and energy.10,11 Compared with organic dyes and fluorescent proteins, QDs have higher fluorescence efficiency, intensity, stability, and constant excitation wavelength, and they have narrower emission spectra; these properties allow simultaneous excitation of multiple QDs in the same area with one light source.9,12
In this work, we developed a QD-based multiplexed imaging technique for MA, and a new model for MA classification and prognosis. Before using QD-based IHC staining with MA, we stained with GC tissue to optimize the staining conditions and explore the GC microenvironment. Then we developed the QD-based multiplexed imaging of MA with the optimized staining conditions.
Material and methods
Patients for GC tissue specimens and for MA cell preparations
We obtained ten GC tissues and 20 MA samples from the Department of Oncology, Zhongnan Hospital of Wuhan University (Wuhan, People’s Republic of China), and the study protocol was approved by ethics committee of hospital. The tumor tissues were prepared with conventional histopathology procedures, and tissue slides (3 μm thickness) were used for QD-based multiplexed imaging as detailed in the next section. The median age of patients with MA was 60 years (range 22–80). The major clinicopathological characteristics of patients with MA are listed at Table 1.
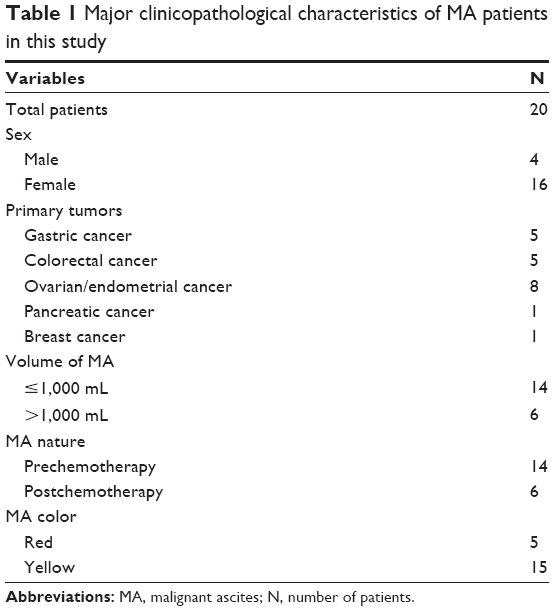 | Table 1 Major clinicopathological characteristics of MA patients in this study |
Conventional IHC and QDs-based IHC for GC tissue slides
All GC tissue slides were preheated at 65°C for 1 hour and then deparaffinated in xylene three times, each for 6 minutes. Then, tissue and cell hydration was carried out by successively immersing the samples in 100%, 95%, 95% and 85% ethanol for 6 minutes, 3 minutes, 3 minutes, and 3 minutes, respectively, and was followed by rinsing the samples in water for 5 minutes. Then, for antigen retrieval, the slides were pretreated in 0.01 M citrate buffer (pH 6.0) and heated at 98°C for 15 minutes. After cooling in the citrate buffer at room temperature, the slides were washed in water and stored in a solution of Tris-buffered saline (TBS) and buffer containing 0.05% Tween 20 until they needed to be used.
For conventional IHC, GC tissue slides were immersed in 3% H2O2 for 10 minutes at 37°C to quench endogenous peroxidase activity. Then, slides were blocked with 2% bovine serum albumin (BSA) for 10 minutes at 37°C. Next, the slides were incubated overnight at 4°C in these combinations: 1) mouse anti-human monoclonal antibody against carcinoembryonic antigen (CEA) (ab-4451, dilution 1:300) (Abcam, Cambridge, UK); 2) mouse anti-human monoclonal antibody against CA125 (ab-693, dilution 1:300) (Abcam); 3) mouse anti-human monoclonal antibody against CA19-9 (ab-15146, dilution 1:300, for labeling cancer cells ) (Abcam); 4) rabbit anti-human polyclonal antibody against CD68 (ab-125157, dilution 1:100, for labeling macrophages) (Abcam); 5) goat anti-human polyclonal antibody against CD3 (sc-1127, dilution 1:300) (Santa Cruz, USA); and 6) goat anti-human polyclonal antibody against CD20 (sc-7733, dilution 1:300, for labeling lymphocytes) (Santa Cruz, USA). Slides were then incubated for 30 minutes at 37°C with corresponding secondary antibodies: 1) horseradish peroxide (HRP)-labeled goat anti-mouse IgG (H+L) antibody (074-1806, dilution 1:200) (KPL, Gaithersburg, MD, USA); 2) HRP-labeled goat anti-rabbit IgG (H+L) antibody (074-1506, dilution 1:200) KPL); and 3) HRP-labeled rabbit anti-goat IgG (H+L) antibody (14-13-06, dilution 1:200) (KPL). Finally, the reaction products were visualized with diaminobenzidine (Dako, Glostrup, Denmark). As a negative control, the primary antibody was replaced by TBS.
For simple QD-based IHC staining, after being blocked with 2% BSA for 30 minutes at 37°C, the slides were incubated with the primary antibodies overnight at 4°C. The slides were then incubated for 2 hours with the corresponding QD probes that were secondary antibodies conjugated with QD on the F(ab’)2 fragments: 1) QD-525 goat F(ab’)2 anti-mouse IgG conjugate (QD-525), which emits green light and whose dilution was 1:200 (Thermo Fisher Scientific, Waltham, MA, USA); 2) QD-585 goat F(ab’)2 antirabbit IgG conjugate (QD-585), which emits yellow light and whose dilution was 1:200 (Thermo Fisher Scientific); and 3) QD-655 rabbit F(ab’)2 anti-goat IgG conjugate (QD-655), which emits red light and whose dilution was 1:500 (Thermo Fisher Scientific).
For multiple QD-based IHC staining, in order to improve the staining sensitivity, cancer cells were simultaneously marked with anti-CEA, anti-CA125, and anti-CA19-9 antibodies, and lymphocytes were simultaneously marked with anti-CD3 and anti-CD20 antibodies. Cells were recognized as cancer cells if only green was visible and as lymphocytes if only red was visible. The primary antibodies of three different species (mouse, rabbit, and goat) were mixed and simultaneously incubated with the slides. Correspondingly, the three QD probes were mixed to incubate and to stain the corresponding antibodies.
MA smears preparation and cell paraffin embedding
MA was centrifuged at 3000 rotations per minute at room temperature for 5 minutes. The supernatant was discarded, and the sediment was resuspended in the residual liquid. Part of the cell mixture (10 μL) was transferred to a slide, and cell smears were made. They were dried at room temperature for 2 hours, then fixed in 4% paraformaldehyde for 20 minutes. The smears were washed in TBS three times each for 3 minutes, and then dried at room temperature for 1 hour. The prepared spears were either subjected to Giemsa staining or sealed in tin foil and stored in dark at −20°C until they needed to be used. The rest of the cell mixture was centrifuged at 3,000 rotations per minute at room temperature for 5 minutes again. Then, the supernatant was discarded and the sediment was dried. Paraffin was embedded in accordance with a standard procedure for serial slides (3 μm thickness) and subjected to either conventional HE staining or QD-based IHC staining as detailed in the next section.
QD-based IHC for MA cell spears and MA cell slides
For QD-based IHC staining, before being labeled with a primary antibody, MA cell slides were prepared as GC slides by using the procedure previously mentioned. MA cell spears were first treated with 0.01% triton-X 100 as surfactant for 10 minutes to improve the permeability of cell membranes and expose antigenic determinants. The spears were then blocked with 2% BSA for 30 minutes at 37°C. All MA cell spears and slides were incubated with mixed primary antibodies from different specimens overnight at 4°C. Then, they were incubated with corresponding mixed QD probes for 2 hours after being blocked with 2% BSA for 30 minutes at 37°C.
Image acquisition and processing
All slides and smears were examined under an Olympus BX51 fluorescence microscope (Olympus Corporation, Tokyo, Japan) equipped with an Olympus DP72 camera (Olympus Corporation) and CRi Nuance multiplexed imaging systems (Cambridge Research and Instrumentation, Inc., Hopkinton, MA, USA). QD-based IHC staining sections were excited by ultraviolet light (330–385 nm). HE, conventional IHC, and QD-based IHC staining images were captured by the DP72 camera under the same conditions. QD-based IHC staining cubes that contained complete spectral information at 10-nm wavelength intervals from 420–720 nm were captured by CRi Nuance systems under the same conditions. For the spectral unmixing of the cubes, the analysis software package that came with the Nuance system was used.
For each MA slide, cell images were captured at magnifications of 100 times, 200 times, and 400 times. The ratio of cancer cells to immunocytes was calculated for each case.
Statistical analysis
Statistical analyses were performed with SPSS software version 13.0 (SPSS Inc., Chicago, IL, USA). A t-test was used to compare the ratio of cancer cells and immunocytes between groups. Two-sided P<0.05 was considered statistically significant.
Results
IHC and QD-based IHC staining of GC tissue
GC tissue samples were successfully stained with all antibodies, including anti-CEA, anti-CA125, anti-CA19-9, anti-CD68, anti-CD3, and anti-CD20 antibodies (Figures 1A–1F, respectively), with good sensitivity and specificity for both conventional IHC staining (Figures 1A1–1C1 and 1D1–1F1) and QD-based IHC staining (Figures 1A2–1C2 and 1D2–1F2). From these simple staining samples, it was observed that macrophages and lymphocytes surrounded tumor nests and cancer cells. Furthermore, they presented lineal distribution on one side of the tumor nests and cancer cells, and there were some macrophages in tumor nests as well (Figures 1D1 and 1F1, black arrow). Moreover, more macrophages and lymphocytes presented at the cancer invasion front.
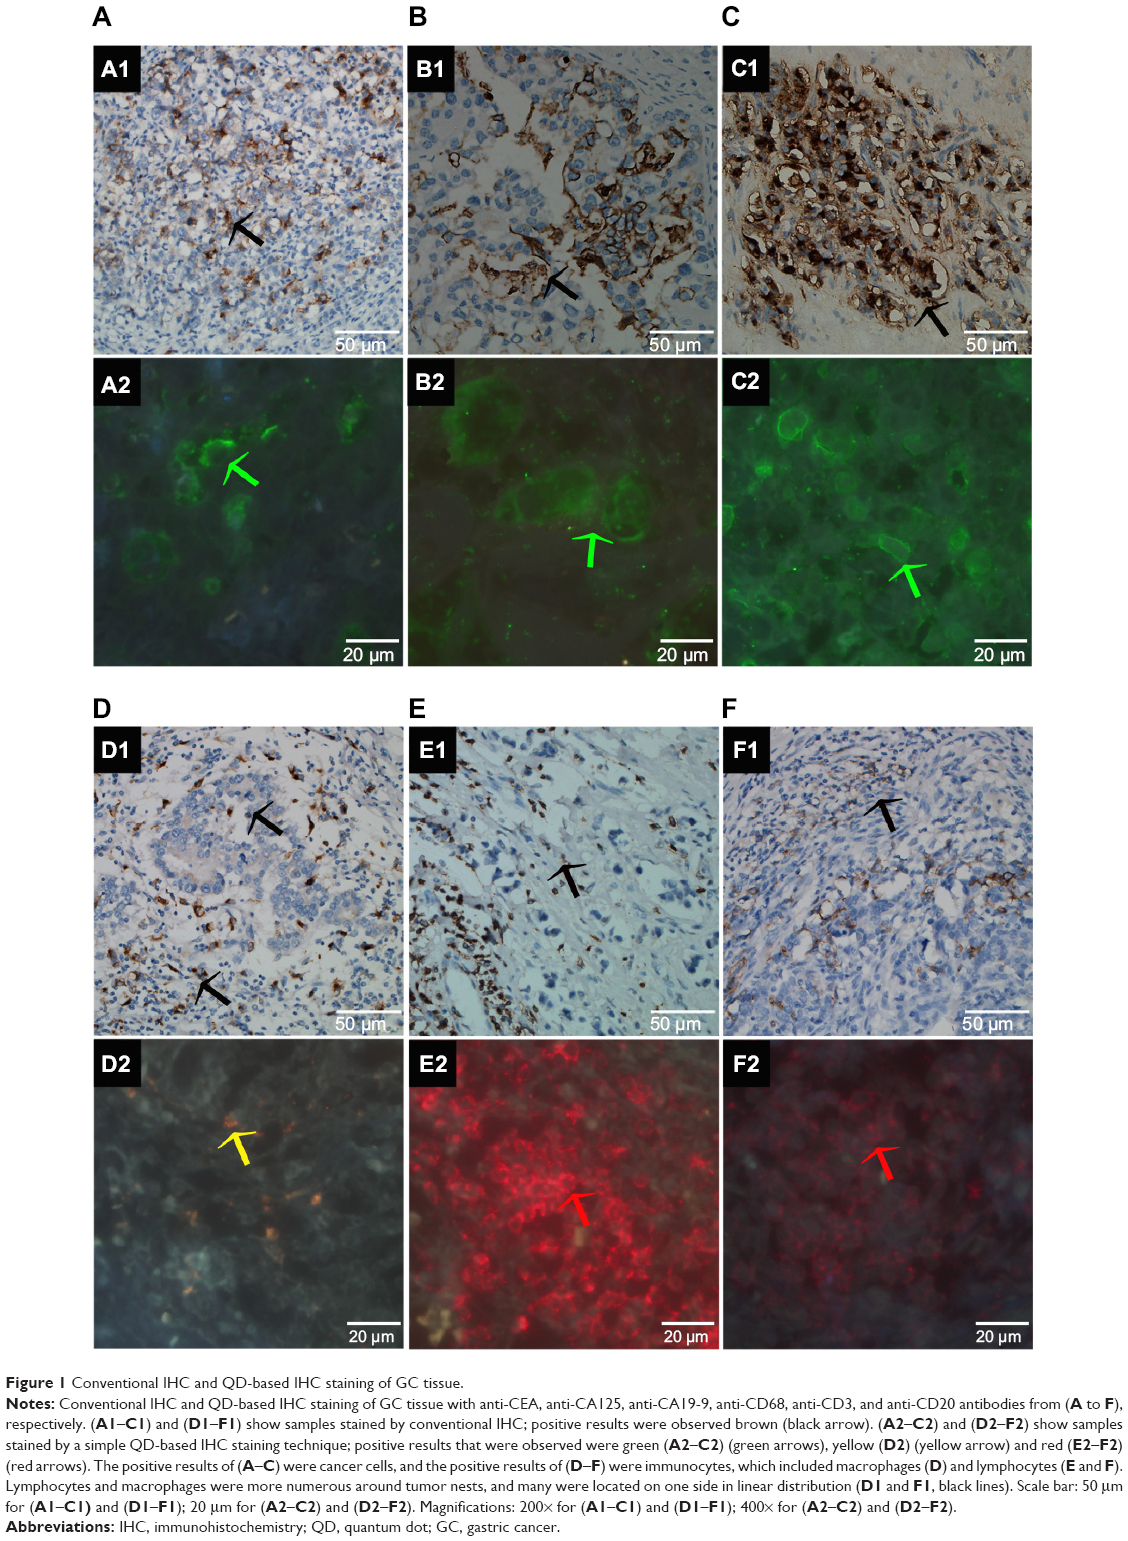 | Figure 1 Conventional IHC and QD-based IHC staining of GC tissue. |
Then, a QD-based multiplexed imaging technique was developed to simultaneously reveal the presence of GC cells, macrophages, and lymphocytes in the tumor microenvironment (Figure 2). It was found that macrophages and lymphocytes tended to present lineal distribution synchronously.
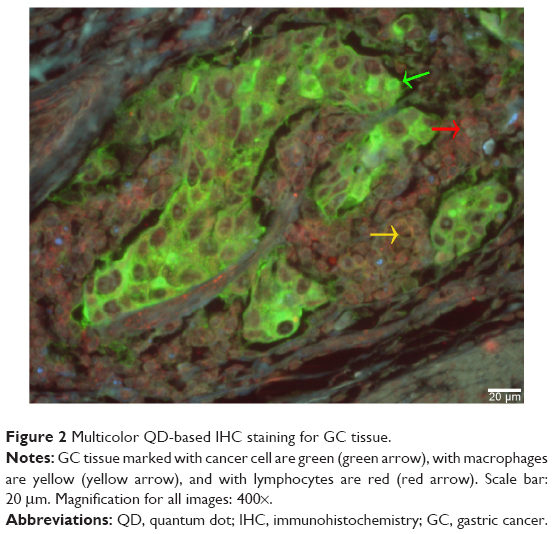 | Figure 2 Multicolor QD-based IHC staining for GC tissue. |
Interactions between cancer cells and immunocytes in MA
By using this QD-based multiplexed imaging technology of GC tissue as a basis, we have established an optimized protocol for QD-based multiplexed imaging of cancer cells and immunocytes in MA. This technology revealed four types of interactions between cancer cells and immunocytes in the MA (Figure 3): 1) a few cancer cells were surrounded by numerous lymphocytes (Figures 3A1 and 3A2); this finding suggests enhanced host immune reactions against cancer cells in MA; 2) cancer cells were approached but could not be surrounded by macrophages (Figures 3B1 and 3B2); this finding suggests the reduced ability of the host’s immune system to limit cancer cells; 3) numerous cancer cells surrounded the macrophages (Figures 3C1 and 3C2); this finding indicates significantly compromised host immune reactions against cancer cells; and 4) cancer cells and immunocytes were unrelated (Figures 3D1 and 3D2); this finding suggests possible host immune tolerance for cancer cells.
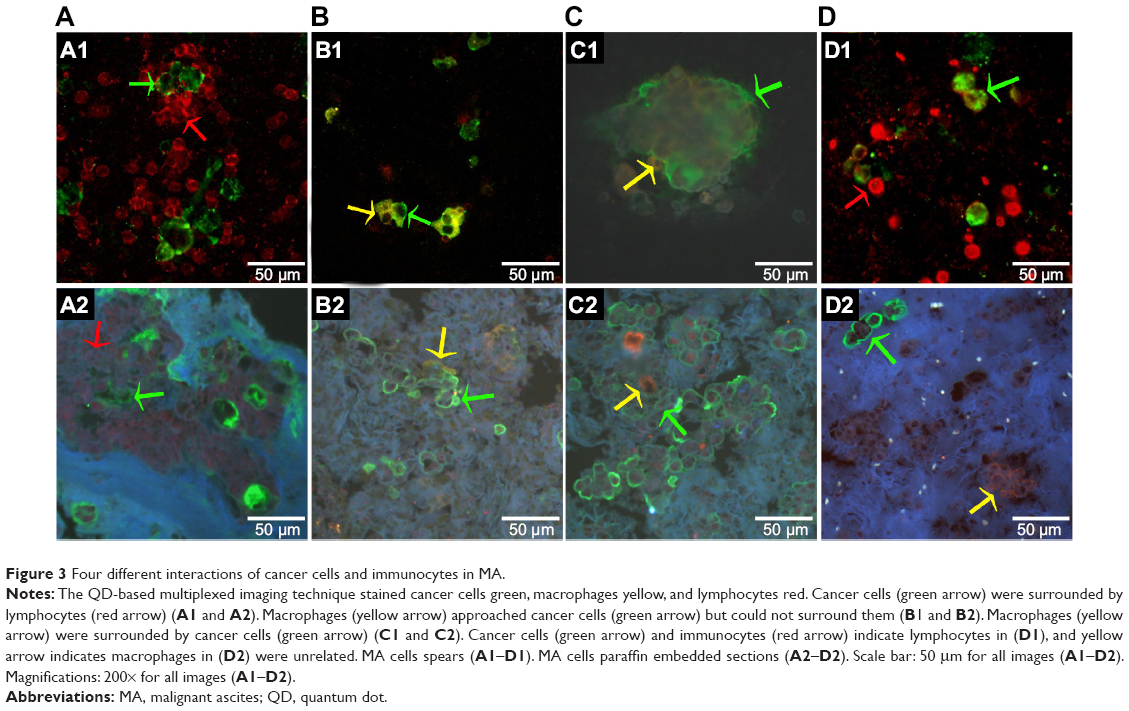 | Figure 3 Four different interactions of cancer cells and immunocytes in MA. |
Quantitative evaluation between cancer cells and immunocytes
To further investigate the relationship between cancer cells and immunocytes in MA, we calculated the ratio of cancer cells to immunocytes, and such quantitative analysis revealed four types of quantitative relations between cancer cells and immunocytes (Figure 4): 1) numerous cancer cells and immunocytes coexisted in the same slide (Figures 4A1–4A5); this finding suggests that there were strong immune reactions to highly proliferating cancer cells in MA; 2) numerous cancer cells and almost no immunocytes existed in the slide (Figures 4B1–4B5); this finding suggests that immune reactions against cancer cells and highly proliferating cancer cells in MA were destroyed; 3) a few cancer cells were immersed in numerous immunocytes (Figure 4C1–4C5); this finding suggests that the effect of boosting host immunity against cancer cells in MA and the cancer cells proliferation was limited; and 4) a few cancer cells and immunocytes coexisted in the slide (Figure 4D1–4D5); this finding indicates fewer immune reactions against less active cancer cells in MA.
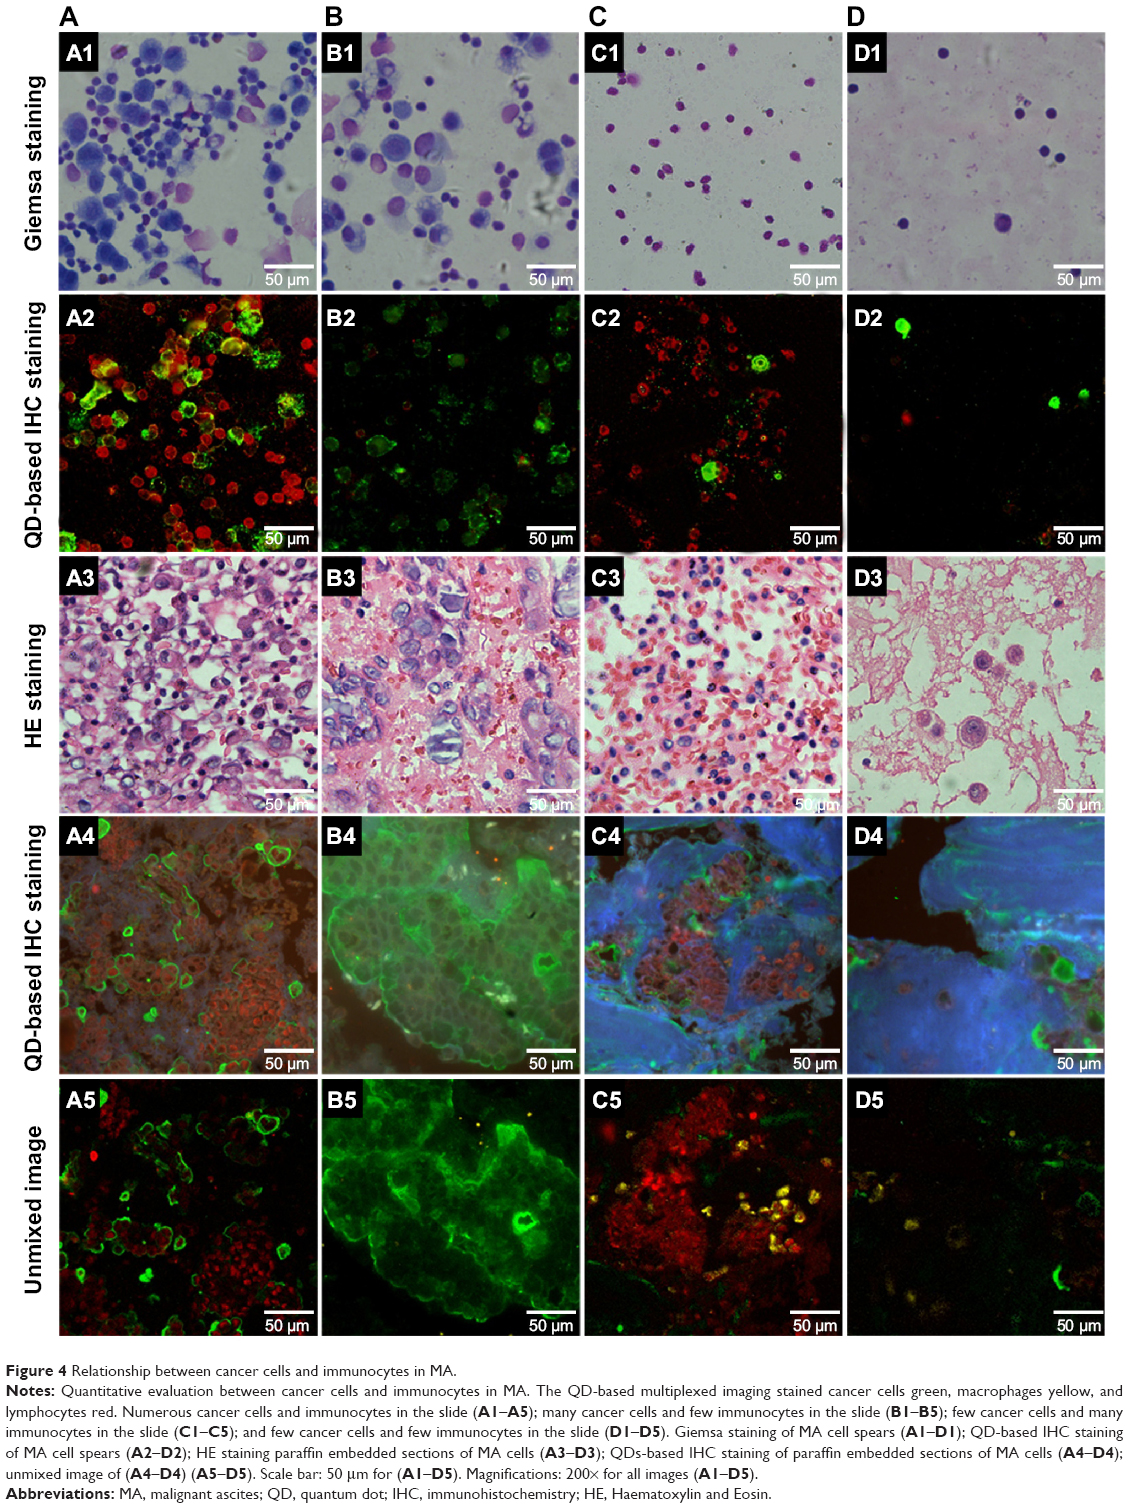 | Figure 4 Relationship between cancer cells and immunocytes in MA. |
MA classification
On the basis of the interactions and quantitative relations of cancer cells and immunocytes and on the basis of the different immune reactive states, MA can be divided into four categories: 1) immunocyte-dominant type; 2) immunocyte-reactive type; 3) cancer cell-dominant type; and 4) cell-deletion type (Table 2).
 | Table 2 MA classification based on interactions and quantitative relations of cancer cells and immunocytes |
To quantitatively investigate the relationships between cancer cells and immune cells, we calculated the ratio of cancer cells to immunocytes for each MA (Table 3, Figure 5). The mean ratios for the four categories of MA were 0.50, 1.43, 6.67, and 0.74 (P<0.01), respectively, for immunocytes-dominant type, immunocytes-reactive type, cancer cells-dominant type, and cell-deletion type; this finding indicates the different immunological statuses of the patients and cancer cell activity (Table 3, Figure 5A). The ratios of cancer cells to immunocytes in MA from different primary tumors were also different. The mean ratios of MA from GC, colorectal cancer and ovarian/endometrial cancer were 1.70, 0.67 and 2.36, respectively (Table 3, Figure 5B). Although such differences were not statistically significant (P=0.530), they do reflect the clinical reality that MA from colorectal cancer has a relatively slower progression than MA from either GC or gynecological malignancies.
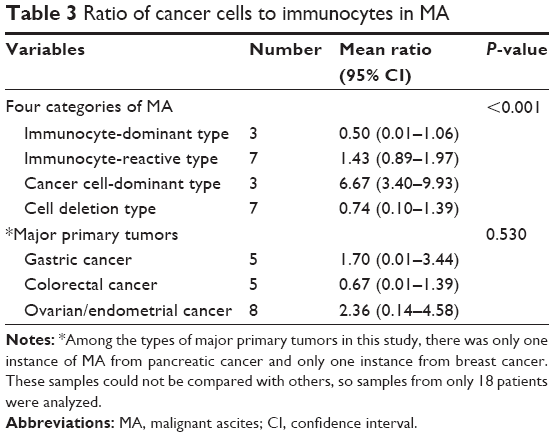 | Table 3 Ratio of cancer cells to immunocytes in MA |
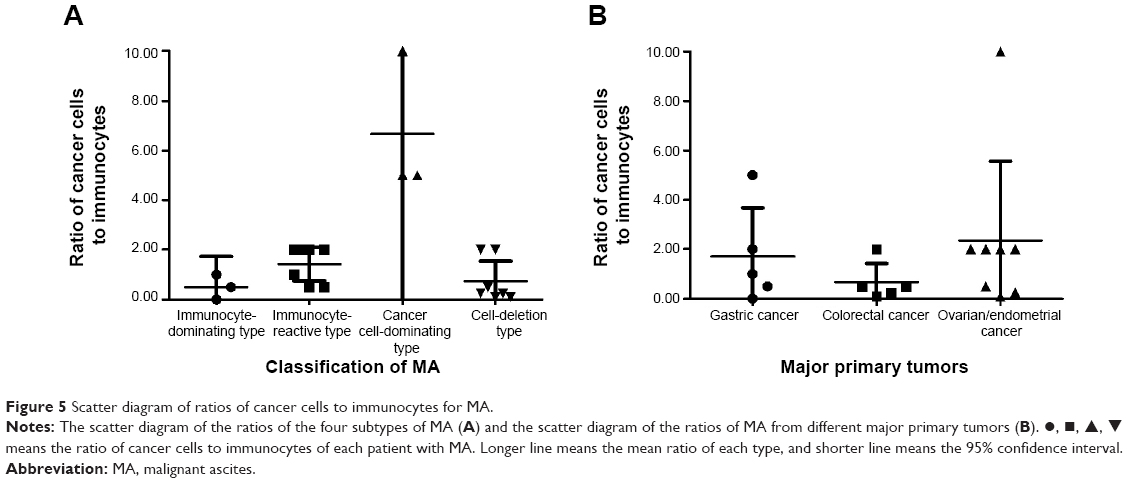 | Figure 5 Scatter diagram of ratios of cancer cells to immunocytes for MA. |
Discussion
The major components of the tumor microenvironment are stromal cells, collagens, matrix metalloproteinases, infiltrating inflammatory cells, and tumor neovessels. The tumor microenvironment is becoming more widely recognized as playing an important role in tumor growth, progression, and metastasis.7,8,12 Tumor-infiltrating immunocytes have strong influence on tumor growth, progression, and metastasis, and they are independent of the TNM stage.13,14 Tumor-infiltrating macrophages are also involved in tumor development and are associated with a poor clinical prognosis.15–17 Tumor-infiltrating lymphocytes are associated with effective therapeutic responses and favorable clinical outcomes.18,19 However, current research about tumor microenvironments has been mainly focused on primary cancers, and to our knowledge, seldom has attention been paid to the microenvironment of malignant ascites,20,21 particularly the complex interactions between cancer cells and immunocytes. Until now, the pathological characteristics of MA microenvironment have been unclear.
In this work, in order to gain direct insight into the MA microenvironment, we developed a new QD-based multiplexed imaging method for studying the interaction and the quantitative relations of cells in MA.
To improve diagnostic accuracy, researchers explored many methods in addition to cytology. From previous studies, methods such as relative lymphocyte count, MA tumor markers, and telomerase activity were examined.22–26 All of these new methods have their own advantages; however, cytology is still the recognized gold standard in clinical practice. Cytology provides direct insight into the cell components of MA. Although cytology has long been used to detect malignant cells, it has rarely been used in studying the tumor cell microenvironment, except for studying mesothelial cells.27,28 In the study by Matte et al28 mesothelial cells and cancer cells had important interactions, and mesothelial cell proliferation was stimulated by cancer cells. However, this study did not directly observe the cancer cells and mesothelial cells in MA. In this work, we combined the synchronous multiplexed staining properties of QDs with MA cytology to develop the QD-based multiplexed imaging technique, which provided a new method to synchronously observe cancer cells, macrophages, and lymphocytes in MA. With this method, the complex components of the tumor microenvironment could be observed directly, an ability that will be helpful in the studies focusing on the relationship between cancer cells and tumor microenvironments.
Moreover, we synchronously labeled cancer cells with anti-CEA, anti-CA125, and anti-CA19-9 antibodies to improve the diagnostic accuracy.
The research on MA is mainly for improving therapeutic efficacy. In this regard, previous studies were mostly focused on searching for the optimal chemotherapy regimens against MA, including the paclitaxel with tegafur regimen, the combined intraperitoneal recombinant human endostatin and chemotherapy regimen, the catumaxomab regimen, the cediranib regimen, immunotherapy, and others.29–36 However, the rate of complete remission with these regimens remains less than 30%.
Fundamentally, all of these studies have been focused on finding the best regimen to cure all MA. The fact that tumors are highly heterogeneous can not be ignored,12,37–40 and one regimen to treat all MA is impossible. It is imperative to gain further insight into the biological features of MA, to understand the microenvironment of MA, and to classify MA. In our study, by using QD-based multiplexed imaging, we could observe different interactions and quantitative relations among the cancer cells and immunocytes. On the basis of such information, MA can be divided into four categories: 1) immunocyte-dominating type; 2) immunocyte-reactive type; (3) cancer cell-dominating type; and (4) cell-deletion type. The ratio of cancer cells to immunocytes for these four categories had statistical significance. This finding further reveals the differences among immunologic statuses in MA. On the basis of the different immune reactive states of MA, therapies should be individualized. For MA in hosts with a better immune reactive state, the therapy regimen should focus on killing cancer cells, and for MA in hosts with a worse immune reactive state, the therapy regimen should focus on boosting immunotherapy. Thus, therapeutic efficacy of MA may be improved on the basis of this new classification.
Due to the insufficient number of MA samples, the specific ratios of different categories of MA were not defined. In our future work, we will increase the number of MA samples and achieve longer follow-up. On the basis of the overall survival of these patients with MA and on the basis of the ratios of cancer cells to immunocytes, we defined the specific ratios of different categories of MA.
Conclusion
In this work, we developed a new QD-based multiplexed imaging method to directly reveal cancer cells, lymphocytes, and macrophages in the MA microenvironment. On the basis of this new method, we were able to classify MA by different interactions and quantitative relations of cancer cells and immunocytes, and we were able to further predict prognosis and improve therapeutic efficacy.
Acknowledgments
This work was supported by the Science Fund for Doctorate Mentors by China’s Ministry of Education (Number 20120141110042).
Disclosure
The authors report no conflicts of interest in this work.
References
Sangisetty SL, Miner TJ. Malignant ascites: A review of prognostic factors, pathophysiology and therapeutic measures. World J Gastrointest Surg. 2012;4(4):87–95. | ||
Cavazzoni E, Bugiantella W, Graziosi L, Franceschini MS, Donini A. Malignant ascites: pathophysiology and treatment. Int J Clin Oncol. 2013;18(1):1–9. | ||
Ba MC, Cui SZ, Lin SQ, et al. Chemotherapy with laparoscope-assisted continuous circulatory hyperthermic intraperitoneal perfusion for malignant ascites. World J Gastroenterol. 2010;16(15):1901–1907. | ||
Sebastian M. Review of catumaxomab in the treatment of malignant ascites. Cancer Manag Res. 2010;2:283–286. | ||
Ling A, Edin S, Wikberg ML, Öberg Å, Palmqvist R. The intratumoural subsite and relation of CD8(+) and FOXP3(+) T lymphocytes in colorectal cancer provide important prognostic clues. Br J Cancer. 2014;110(10):2551–2559. | ||
Protti MP, Monte LD, Lullo GD. Tumor antigen-specific CD4(+) T-cells in cancer immunity: from antigen identification to tumor prognosis and development of therapeutic strategies. Tissue Antigens. 2014;83(4):237–246. | ||
Peng CW, Liu XL, Liu X, Li Y. Co-evolution of cancer microenvironment reveals distinctive patterns of gastric cancer invasion: laboratory evidence and clinical significance. J Transl Med. 2010;8:101. | ||
Hu WQ, Fang M, Zhao HL, et al. Tumor invasion unit in gastric cancer revealed by QDs-based in situ molecular imaging and multispectral analysis. Biomaterials. 2014;35(13):4125–4132. | ||
Chen C, Peng J, Sun SR, Peng CW, Li Y, Pang DW. Tapping the potential of quantum dots for personalized oncology: current status and future perspectives. Nanomedicine (Lond). 2012;7(3):411–428. | ||
Resch-Genger U, Grabolle M, Cavaliere-Jaricot S, Nitschke R, Nann T. Quantum dots versus organic dyes as fluorescent labels. Nat Methods. 2008;5(9):763–775. | ||
Pelley JL, Daar AS, Saner MA. State of academic knowledge on toxicity and biological fate of quantum dots. Toxicol Sci. 2009;112(2):276–296. | ||
Peng CW, Liu XL, Chen C, et al. Patterns of cancer invasion revealed by QDs-based quantitative multiplexed imaging of tumor microenvironment. Biomaterials. 2011;32(11):2907–2917. | ||
Galon J, Bindea G, Mlecnik B, et al. [Intratumoral immune microenvironment and survival: the immunoscore]. Med Sci (Paris). 2014;30(4):439–444. French [with English abstract]. | ||
Djaldetti M, Bessler H. Modulators affecting the immune dialogue between human immune and colon cancer cells. World J Gastrointest Oncol. 2014;6(5):129–138. | ||
Fujiwara Y, Takeya M, Komohara Y. A novel strategy for inducing the antitumor effects of triterpenoid compounds: blocking the protumoral functions of tumor-associated macrophages via STAT3 inhibition. Biomed Res Int. 2014;2014:348539. | ||
Yang M, Liu J, Shao J, et al. Cathepsin S-mediated autophagic flux in tumor-associated macrophages accelerate tumor development by promoting M2 polarization. Mol Cancer. 2014;13:43. | ||
Zhu W, Guo L, Zhang B, et al. Combination of osteopontin with peritumoral infiltrating macrophages is associated with poor prognosis of early-stage hepatocellular carcinoma after curative resection. Ann Surg Oncol. 2014;21(4):1304–1313. | ||
Verdonck M, Garaud S, Buisseret L, et al. 57p * characterization of tumor infiltrating lymphocytes in human breast cancer by infrared imaging. Ann Oncol. 2014;25 Suppl 1:i19–i20. | ||
Balermpas P, Rödel F, Weiss C, Rödel C, Fokas E. Tumor-infiltrating lymphocytes favor the response to chemoradiotherapy of head and neck cancer. Oncoimmunology. 2014;3(1):e27403. | ||
Yamaguchi Y, Ohshita A, Kawabuchi Y, et al. Locoregional immunotherapy of malignant ascites from gastric cancer using DTH-oriented doses of the streptococcal preparation OK-432: Treatment of Th1 dysfunction in the ascites microenvironment. Int J Oncol. 2004;24(4):959–966. | ||
Freedman RS, Deavers M, Liu J, Wang E. Peritoneal inflammation – A microenvironment for Epithelial Ovarian Cancer (EOC). J Transl Med. 2004;2(1):23. | ||
Park ES, Lee J, Kang SY, et al. A comparative study of telomerase activity and cytologic diagnosis in malignant ascites. Anal Quant Cytopathol Histopathol. 2013;35(3):146–151. | ||
Kaleta EJ, Tolan NV, Ness KA, O’Kane D, Algeciras-Schimnich A. CEA, AFP and CA 19-9 analysis in peritoneal fluid to differentiate causes of ascites formation. Clin Biochem. 2013;46(9):814–818. | ||
Liu F, Kong X, Dou Q, et al. Evaluation of tumor markers for the differential diagnosis of benign and malignant ascites. Ann Hepatol. 2014;13(3):357–363. | ||
Ströhlein MA, Lefering R, Bulian DR, Heiss MM. Relative lymphocyte count is a prognostic parameter in cancer patients with catumaxomab immunotherapy. Med Hypotheses. 2014;82(3):295–299. | ||
Heiss MM, Ströhlein MA, Bokemeyer C, et al. The role of relative lymphocyte count as a biomarker for the effect of catumaxomab on survival in malignant ascites patients: results from a phase ll/lll study. Clin Cancer Res. 2014;20(12):3348–3357. | ||
Kipps E, Tan DS, Kaye SB. Meeting the challenge of ascites in ovarian cancer: new avenues for therapy and research. Nat Rev Cancer. 2013;13(4):273–282. | ||
Matte I, Lane D, Bachvarov D, Rancourt C, Piché A. Role of malignant ascites on human mesothelial cells and their gene expression profiles. BMC Cancer. 2014;14(1):288. | ||
Mulder SF, Boers-Sonderen MJ, van der Heijden HF, Vissers KC, Punt CJ, van Herpen CM. A phase II study of cediranib as palliative treatment in patients with symptomatic malignant ascites or pleural effusion. Target Oncol. Epub 2014 Jan 21. | ||
Zhao J, Chen X, Zhang A, et al. A pilot study of combination intraperitoneal recombinant human endostatin and chemotherapy for refractory malignant ascites secondary to ovarian cancer. Med Oncol. 2014;31(4):930. | ||
Randle RW, Swett KR, Swords DS, et al. Efficacy of cytoreductive surgery with hyperthermic intraperitoneal chemotherapy in the management of malignant ascites. Ann Surg Oncol. 2014;21(5):1474–1479. | ||
Takahara N, Isayama H, Nakai Y, et al. Intravenous and intraperitoneal paclitaxel with S-1 for refractory pancreatic cancer with malignant ascites: an interim analysis. J Gastrointest Cancer. 2014;45(3):307–311. | ||
Tsikouras P, Tsagias N, Pinidis P, et al. The contribution of catumaxomab in the treatment of malignant ascites in patients with ovarian cancer: a review of the literature. Arch Gynecol Obstet. 2013;288(3):581–585. | ||
Jatoi A, Nieva JJ, Qin R, et al. A pilot study of long-acting octreotide for symptomatic malignant ascites. Oncology. 2012;82(6):315–320. | ||
Ba MC, Long H, Cui SZ, et al. Multivariate comparison of B-ultrasound guided and laparoscopic continuous circulatory hyperthermic intraperitoneal perfusion chemotherapy for malignant ascites. Surg Endosc. 2013;27(8):2735–2743. | ||
Wada I, Matsushita H, Noji S, et al. Intraperitoneal injection of in vitro expanded Vγ9Vδ2 T-cells together with zoledronate for the treatment of malignant ascites due to gastric cancer. Cancer Med. 2014;3(2):362–375. | ||
Tak YK, Naoghare PK, Kim BJ, Kim MJ, Lee ES, Song JM. High-content quantum dot-based subtype diagnosis and classification of breast cancer patients using hypermulticolor quantitative single cell imaging cytometry. Nano Today. 2012;7(4):231–244. | ||
Fang M, Yuan JP, Peng CW, Pang DW, Li Y. Quantum dots-based in situ molecular imaging of dynamic changes of collagen IV during cancer invasion. Biomaterials. 2013;34(34):8708–8717. | ||
Chen C, Yuan JP, Wei W, et al. Subtype classification for prediction of prognosis of breast cancer from a biomarker panel: correlations and indications. Int J Nanomedicine. 2014;9:1039–1048. | ||
Lee HJ, Park IA, Park SY, et al. Two histopathologically different diseases: hormone receptor-positive and hormone receptor-negative tumors in HER2-positive breast cancer. Breast Cancer Res Treat. 2014;145(3):615–623. |
 © 2015 The Author(s). This work is published and licensed by Dove Medical Press Limited. The
full terms of this license are available at https://www.dovepress.com/terms
and incorporate the Creative Commons Attribution
- Non Commercial (unported, 3.0) License.
By accessing the work you hereby accept the Terms. Non-commercial uses of the work are permitted
without any further permission from Dove Medical Press Limited, provided the work is properly
attributed. For permission for commercial use of this work, please see paragraphs 4.2 and 5 of our Terms.
© 2015 The Author(s). This work is published and licensed by Dove Medical Press Limited. The
full terms of this license are available at https://www.dovepress.com/terms
and incorporate the Creative Commons Attribution
- Non Commercial (unported, 3.0) License.
By accessing the work you hereby accept the Terms. Non-commercial uses of the work are permitted
without any further permission from Dove Medical Press Limited, provided the work is properly
attributed. For permission for commercial use of this work, please see paragraphs 4.2 and 5 of our Terms.