Back to Journals » International Journal of Nanomedicine » Volume 11
Quantum dot-based immunofluorescent imaging and quantitative detection of TOP2A and prognostic value in triple-negative breast cancer
Authors Zheng H, Li X, Chen C, Chen J, Sun J, Sun S, Jin L, Li J ![]() , Sun S, Wu X
, Sun S, Wu X
Received 28 April 2016
Accepted for publication 12 July 2016
Published 21 October 2016 Volume 2016:11 Pages 5519—5529
DOI https://doi.org/10.2147/IJN.S111594
Checked for plagiarism Yes
Review by Single anonymous peer review
Peer reviewer comments 4
Editor who approved publication: Professor Lei Yang
Hongmei Zheng,1 Xiang Li,1 Chuang Chen,2 Jian Chen,3 Jinzhong Sun,2 Si Sun,4 Liting Jin,1 Juanjuan Li,2 Shengrong Sun,2 Xinhong Wu1
1Department of Breast Surgery, Hubei Cancer Hospital, 2Department of Breast and Thyroid Surgery, Renmin Hospital of Wuhan University, 3Department of Head and Neck Surgery, Hubei Cancer Hospital, 4Department of Clinical Laboratory, Renmin Hospital of Wuhan University, Wuhan, Hubei, People’s Republic of China
Background: Topoisomerase 2 alpha (TOP2A) is a key enzyme in DNA replication and a target of various cytotoxic agents including anthracyclines. Previous studies evaluating the predictive and prognostic values of TOP2A in breast cancer are contradictory, likely secondary to the use of both different detection methods and different cutoff thresholds for positive status. Our own studies have previously confirmed the advantages of quantum dot-based nanotechnology for quantitative analysis of biomarkers relative to conventional immunohistochemistry (IHC). This study was designed to 1) assess the expression of TOP2A, 2) investigate the relationship between TOP2A expression and major clinical pathological parameters, and 3) evaluate the prognostic value of TOP2A by quantum dot-based immunofluorescent imaging and quantitative analytical system (QD-IIQAS) in triple-negative breast cancer (TNBC).
Patients and methods: TOP2A expression in 145 TNBC specimens was detected using IHC and QD-IIQAS, and a comparative analysis of the two methods was conducted, including an exploration of the relationship between TOP2A expression and major clinical pathological parameters in TNBC. The prognostic value of TOP2A in TNBC was assessed.
Results: A similar antigen localization, a high correlation of staining rates (r=0.79), and a high agreement of measurements (κ=0.763) of TOP2A expression in TNBC were found by QD-IIQAS and conventional IHC (cutoff: 45.0 and 0.45, respectively). TOP2A was significantly higher in larger tumors (P=0.002), higher grade tumors (P=0.005), and lymph node positive patients (P<0.001). The 5-year disease-free survival (5-DFS) of the high and low TOP2A subgroups was significantly different for both QD-IIQAS and IHC (P<0.001, log-rank test for both). TOP2A expression was an independent predictor of survival in TNBC (P=0.001).
Conclusion: QD-IIQAS was an easy and accurate method for detecting and assessing TOP2A. The TOP2A expression was an independent prognostic indicator of 5-DFS in TNBC. Our study provides a good foundation for future studies exploring the relationship between TOP2A expression and response to anthracyclines.
Keywords: triple-negative breast cancer, quantum dot, TOP2A, disease-free survival, prognosis
Introduction
Breast cancer is the leading cause of cancer death among women and accounts for ~30% of all estimated new cancer cases in this population.1 Therapeutic advancements have come in the form of endocrine therapies and HER2-targeting therapies for hormone receptor (HR)-positive and HER2-positive breast cancer.2 However, improvement in survival of patients with triple-negative breast cancer (TNBC), a subtype characterized by tumors that are negative for all three of HER2, estrogen receptor (ER), and progesterone receptor (PR), has currently plateaued.3 TNBC is an important clinical challenge because it does not respond well to endocrine therapy, and there are no readily available, effective, and specific targeted therapies.4 While TNBC is sensitive to chemotherapy, early relapse is more common in patients with TNBC than that in patients with other breast cancer subtypes.5 This is in part likely secondary to the heterogeneity within TNBC patients and the different responses to chemotherapy and targeted agents.6 These particular characteristics of TNBC highlight the urgent need for identification of novel biomarkers for TNBC subtyping, prognosis, and targeted therapy.
Topoisomerase 2 alpha (TOP2A) is a key enzyme in DNA replication and a target of various cytotoxic agents such as anthracyclines. As such it has been widely investigated for potential applications in breast cancer detection and management.7,8 Anthracyclines are one of the most effective cytotoxic agents used in the treatment of breast cancer patients and inhibit TOP2A by trapping the DNA strand intermediates, leading to persistent DNA cleavage.8 However, data supporting a potential predictive role for TOP2A status and its sensitivity are mixed. This is in part due to the use of different detection methods (ie, immunohistochemistry [IHC], fluorescent in situ hybridization [FISH], and other molecular biology methods) and different cutoff thresholds for positive status, making comparisons between studies difficult.9–12 Numerous retrospective studies have previously investigated the predictive value of TOP2A using different methods. Some of these approaches have focused on quantifying TOP2A expression,13,14 whereas others have assessed TOP2A copy number.9,15 Perhaps not surprising given the mixture of methods and end points, the results of these studies are inconsistent and occasionally contradictory. As a result, it remains unclear whether TOP2A can provide clinically relevant information.
Quantum dots (QDs) are semiconductor nanocrystals associated with unique photophysical properties including size-tunable symmetric emission bands, superior light absorbance, high fluorescent intensity, and strong photostability.16 Their optical properties have led to increased use of QD-based nanotechnology in a wide variety of biomedical applications, such as cancer diagnosis, monitoring, treatment, and molecular pathology.17,18 QD-based nanotechnology has the potential for wider application, particularly in the field of in vitro cancer molecule imaging and quantitative detection.19–21 Our previous studies using QD-based molecular pathology for molecular targeted imaging and quantitative detection of cancer cells and molecules were associated with a number of potential advantages over conventional IHC methods, such as superior fluorescent efficiency over organic fluorescent dyes, better signal clarity, higher sensitivity, and more accurate quantitative analyses.21–24 However, the use of QD technology for quantifying TOP2A protein expression in TNBC has not yet been investigated.
This study was designed to assess TOP2A expression using QD-based immunofluorescent imaging and quantitative analytical system (QD-IIQAS), relative to traditional IHC techniques. We also investigated the relationship between TOP2A expression and major clinical pathological parameters. Additionally, we explored the prognostic value of TOP2A in TNBC.
Patients and methods
Patients and specimens
Formalin-fixed, paraffin-embedded specimens from 145 patients with TNBC aged 25–79 years (median 52 years) were collected from January 2007 to September 2009 from the Hubei Cancer Hospital, People’s Republic of China. All patients with stages I–III breast cancer who had undergone six to eight cycles of anthracycline- and docetaxel-based chemotherapy after breast cancer surgery were eligible. Patients with more than three metastatic lymph nodes received radiotherapy after chemotherapy. Pathological parameters were collected, including tumor size, location, and number; lymph node status and histological grade were determined by conventional IHC. Treatment information, including types of surgery and adjuvant treatments (chemotherapy and radiotherapy), was obtained from the medical records of all eligible patients. All patients were followed up in accordance to a regular follow-up schedule. Written informed consent was obtained from all patients, and the study protocol was approved by the ethics committee of Hubei Cancer Hospital. The major pathological parameters for these patients are summarized in Table 1 and have been reported in our previous study.24 The whole study process is outlined in Figure 1.
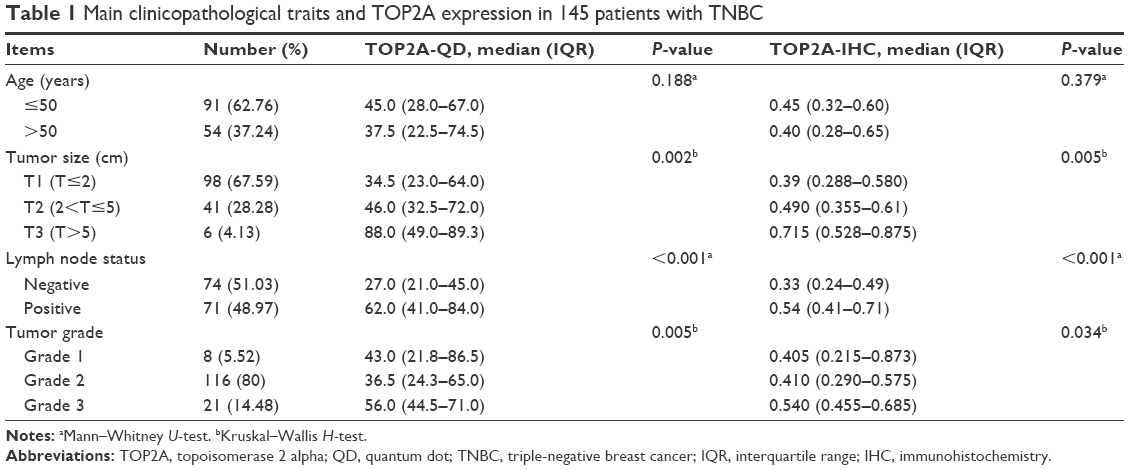 | Table 1 Main clinicopathological traits and TOP2A expression in 145 patients with TNBC |
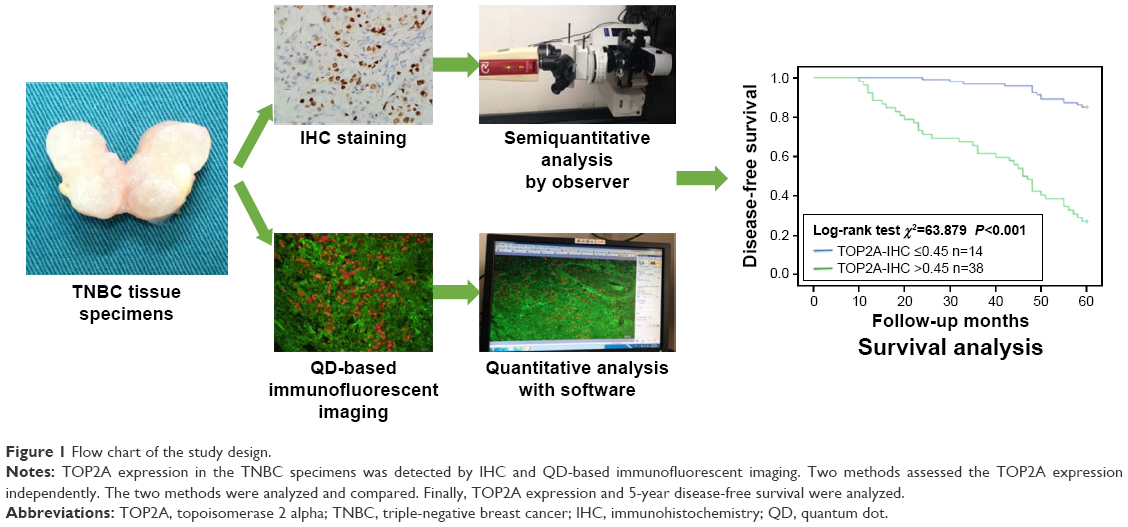 | Figure 1 Flow chart of the study design. |
The primary end point was 5-year disease-free survival (5-DFS), defined as the interval from breast cancer surgery to the first evidence of disease recurrence (local, regional, or distant). If there was no recurrence, patients were censored at the last follow-up date. In this study, we selected only the 5-year data for analysis.
TOP2A detection by IHC
TOP2A (purified mouse anti-human TOP2A monoclonal antibody; clone EP11; 1:100 dilution; ZSGB-BIO, Beijing, People’s Republic of China) was determined using conventional IHC. The major steps in this process included, in order: deparaffinizing, antigen retrieval, blocking, incubation with primary antibody (phosphate-buffered saline for control group), washing, blocking, incubation with biotinylated secondary antibody, washing, blocking, DAB, washing, mounting, and observation. Images of TOP2A expression on IHC were captured and evaluated using an Olympus BX51 fluorescence microscope equipped with an Olympus DP72 camera (Olympus Corporation, Tokyo, Japan, Figure 2A–C, and G).
 | Figure 2 TOP2A expression with IHC and QD-based immunofluorescent imaging. |
TOP2A detection by QD-based immunofluorescent imaging
QD-based immunofluorescent imaging was similar to conventional IHC. The QD-conjugated streptavidin (QD-SA) probe (1:200; QDs-605–goat F(ab)2 anti-mouse immunoglobulin G conjugate; Wuhan Jiayuan Quantum Dots Co. Ltd.) was used as the secondary antibody in the QD-based immunofluorescent imaging. Briefly, the sequence of the procedure was as follows: deparaffinizing, antigen retrieval, blocking (2% bovine serum albumin, 37°C for 30 minutes), incubation with primary antibody (dilution 1/100, 37°C for 2 hours), washing, blocking, incubation with biotinylated secondary antibody (dilution 1/300, 37°C for 30 minutes), washing, blocking, application of QD-SA 605 probes (dilution 1/200, 37°C for 30 minutes, emitting red light), washing, mounting, and observation (Olympus BX51 fluorescence microscope; Olympus Corporation) with a blue light (wavelength of 450–490 nm) excitation. This procedure has previously been described in more detail in our previous study.24
For the QD-based immunofluorescent imaging, the slides were examined under an Olympus BX51 fluorescence microscope equipped with an Olympus DP72 camera (Olympus Corporation) and a Nuance multispectral imaging system (Cambridge Research & Instrumentation Inc., Woburn, MA, USA). QD-605 was excited using blue light (wavelength of 450–490 nm).
The QD images were captured by the Olympus DP72 camera. Spectral images for each slide containing complete spectral information at 10 nm wavelength intervals from 420 nm to 720 nm were captured by the Nuance system (Figure 2D–F and H). All slides were captured under the same conditions at medium magnification (200×), rendering it more accurate and representative of the tumor marker tissue.
TOP2A spectral unmixing and quantitative analysis
QD fluorescence signaling formation for all slides was analyzed using the Nuance system analysis software package (Nuance Version 2.8; Cambridge Research & Instrumentation Inc., Woburn, MA, USA). TOP2A fluorescence signals and distribution areas in the tumor were calculated numerically based on spectral unmixing using the following protocol: 1) selection of targets with different spectra: TOP2A and tissue autofluorescence were selected as red (605 nm) and green signals (automatically set by the software); 2) image unmixing and elimination of background noise: the target images with different spectra were then automatically unmixed by the software based on specific spectrum into two separate images, ie, TOP2A image with red signal and green background, which was deleted at the last step of quantification; and 3) target spectrum quantification: TOP2A spectral signals were automatically quantified by CRi Nuance system.
On each slide, five view fields were selected under the same conditions at medium magnification (200×). The average TOP2A area of the five view fields was then calculated and derived as the final TOP2A area. The final acquired average fluorescence areas of TOP2A were defined as the average of two tissue slides (each specimen was divided into two tissue slides).
Statistical analysis
The relationship between the TOP2A and major clinical pathological parameters (such as age, tumor size, tumor grade, and lymph node status) was assessed using the Mann–Whitney U-test or Kruskal–Wallis H-test. A Pearson correlation coefficient was used to compare staining rates between QD-based immunofluorescent imaging and conventional IHC. The kappa consistency (κ) check was used to quantify the level of measurement agreement between these two methods. Receiver operating characteristic (ROC) curve analysis was used to evaluate the optimal cutoff value of TOP2A for 5-DFS. The optimal point with the highest sum value of sensitivity and specificity was defined as the cutoff. The Kaplan–Meier method was used to assess differences in 5-DFS. A multivariable Cox regression model was used to identify independent predictors of 5-DFS. Statistical analyses were performed using SPSS 17.0 (SPSS Inc., Chicago, IL, USA). For all analyses, a two-tailed P<0.05 was considered statistically significant.
Results
Comparison of TOP2A detection by IHC and QD-IIQAS
In the feasibility study, the detection of TOP2A was measured by IHC (Figure 2A–C and G) and QD-IIQAS (Figure 2D–F and H). On imaging, the QD-IIQAS exhibited a clear fluorescence signal, which was strong, discernible, and easy for observers to quantify. Mean TOP2A expression using IHC was assessed by two observers, which was macroscopic, subjective, and semiquantitative. The TOP2A area using QD-IIQAS was objectively calculated without the disturbance of background using computer-aided spectral unmixing and automated quantitative detection software. Pearson correlation analysis suggested a moderate to strong positive correlation in staining rates between TOP2A expression measured under the two methods (r=0.79). The number of identified cases using different TOP2A cutoffs also showed good consistency between the QD-IIQAS and IHC methods. For example, under the 45.0 and 0.45 cutoffs (QD and IHC, respectively), 64 and 65 cases were flagged as positive by two methods (κ=0.763, Kappa consistency check), respectively.
TOP2A determination, spectral unmixing, and quantitative analysis
Figure 3 provides an example of TOP2A imaging on the cellular nucleus using QD-F(ab)2 probe excited by blue light (wavelength of 450–490 nm). In highly differentiated TNBC tissues, the red TOP2A signal was weak and the distribution sparse (Figure 3A–C). By contrast, the signal in moderately differentiated TNBC tissues was strong and the distribution dense (Figure 3D–F). The signal in poorly differentiated TNBC tissues was strongest, with the densest distribution (Figure 3G–I). The unmixed images were also clear (Figure 4). The original computer-captured images (Figure 4A, C, and E) were then unmixed by multispectral analysis software (Figure 4G) to remove the signal noise and set the spectral images of TOP2A for subsequent analysis. While high TOP2A expression was observed in poorly differentiated TNBC tissues (Figure 4F) comparatively low TOP2A expression was observed in the moderately differentiated TNBC tissues (Figure 4D). Similarly, expression was the lowest in the highly differentiated TNBC tissues (Figure 4B). The quantitative detection of TOP2A was calculated by computer-aided quantitative analytical system, and the TOP2A area was 45.31, 54.12, and 67.31 in samples A, B, and C, respectively, which stand for highly, moderately, and poorly differentiated TNBC tissues, respectively (Figure 4H). The mean TOP2A area was 53.73.
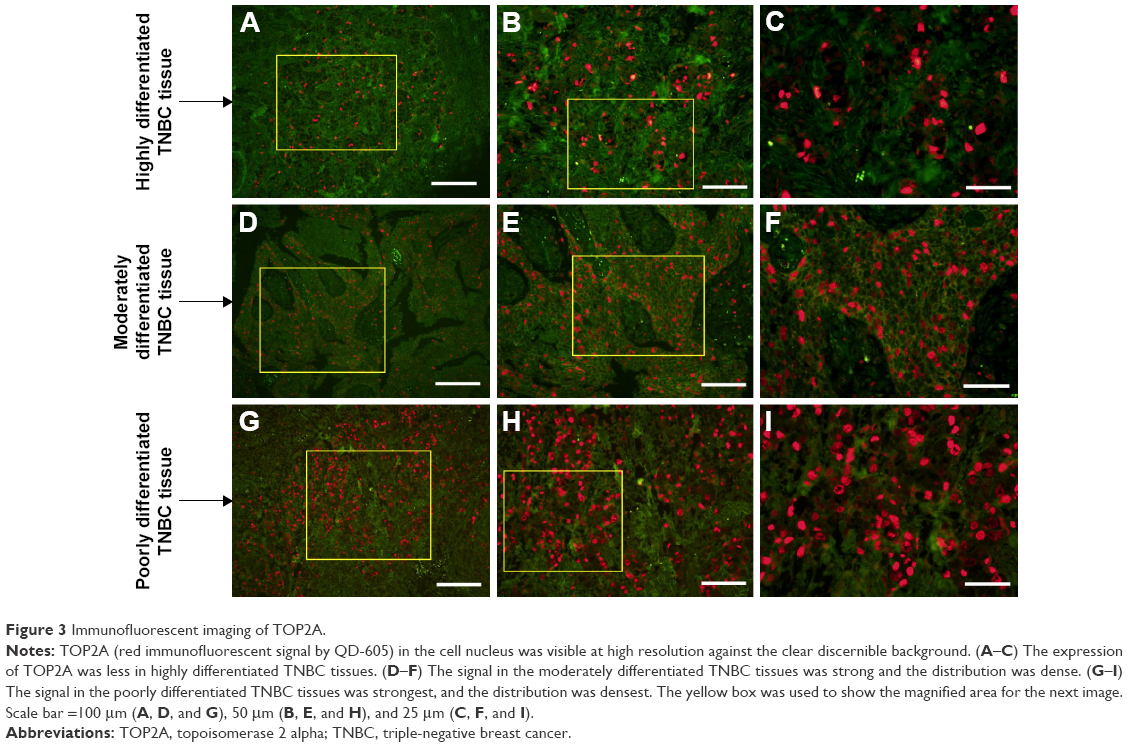 | Figure 3 Immunofluorescent imaging of TOP2A. |
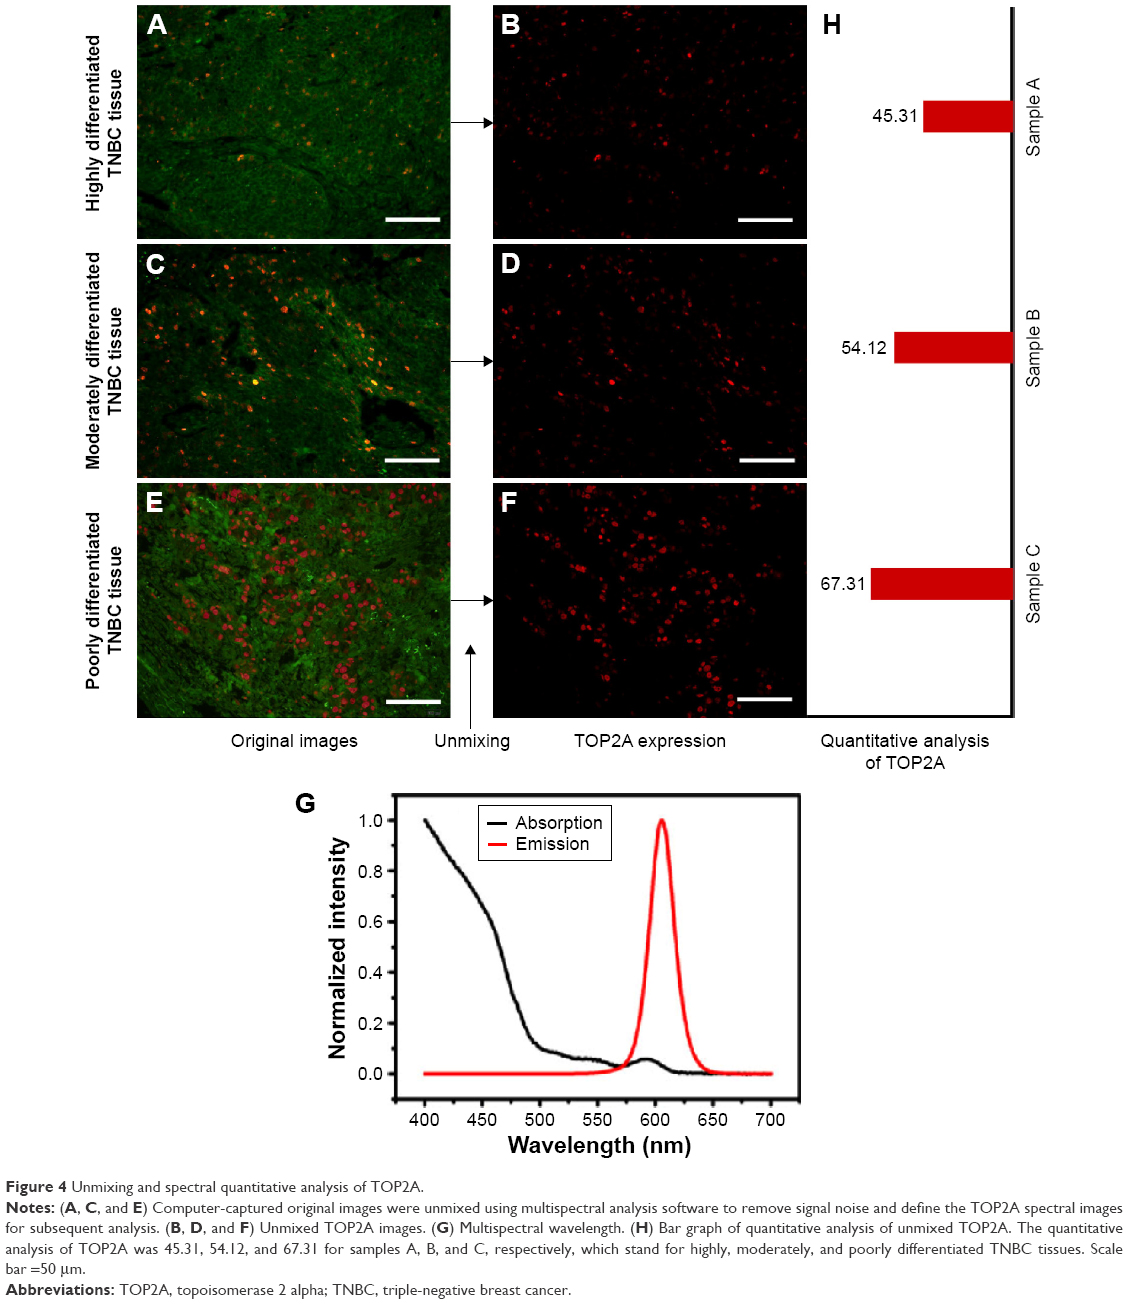 | Figure 4 Unmixing and spectral quantitative analysis of TOP2A. |
Relationship between TOP2A and clinical pathological parameters
Nonparametric testing (Mann–Whitney U-test and Kruskal–Wallis H-test) suggested that TOP2A was significantly higher in larger tumors and higher grade tumors. Median TOP2A was also significantly higher in lymph node-positive patients. No difference was observed between TOP2A expression and age (Table 1).
ROC analysis of TOP2A expression according to 5-DFS
ROC analysis of the TOP2A expression according to 5-DFS indicated that it could predict 5-DFS (Figure 5). Optimal sensitivity and specificity of the ROC curve based on 5-DFS status corresponded with cutoffs of 45.0 and 0.45 for the TOP2A-QD and TOP2A-IHC, respectively. At these cutoffs, TOP2A-QD had 92.3% sensitivity and 81.7% specificity, and the TOP2A-IHC had 88.5% sensitivity and 71.0% specificity. The TOP2A-QD had higher specificity and sensitivity and a larger area under the curve than TOP2A-IHC did, suggesting that the TOP2A-QD was associated with a better prognostic value for 5-DFS relative to TOP2A-IHC.
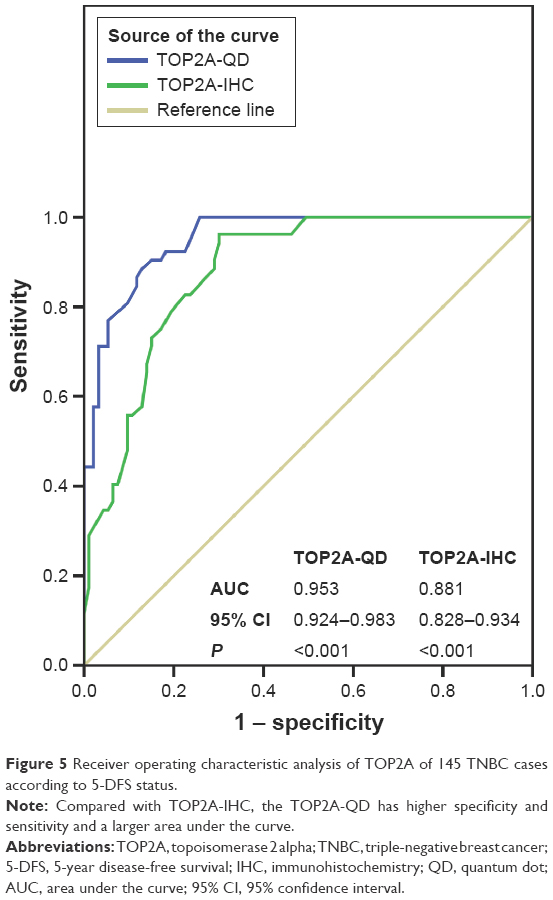 | Figure 5 Receiver operating characteristic analysis of TOP2A of 145 TNBC cases according to 5-DFS status. |
TOP2A expression and 5-DFS
In this study, the 5-DFS rate was 64.1% (93/145), with 19 local recurrences and 33 distant recurrences. We classified the patients into high and low TOP2A-IHC subgroups based on the TOP2A-IHC cutoff value of 0.45. The 5-DFS rate was 84.9% in the low subgroup (n=93) and 26.9% in the high (n=52), and the difference was significant (P<0.001, log-rank test, Figure 6A). Based on the TOP2A-QD cutoff value of 45.0, the 145 patients with TNBC were classified into high and low TOP2A-QD sub. The 5-DFS rate was 85.4% in the patients with low TOP2A-QD (n=103), compared with 11.9% in the patients with high TOP2A-QD (n=42), and this represented a significant difference (P<0.001, log-rank test, Figure 6B).
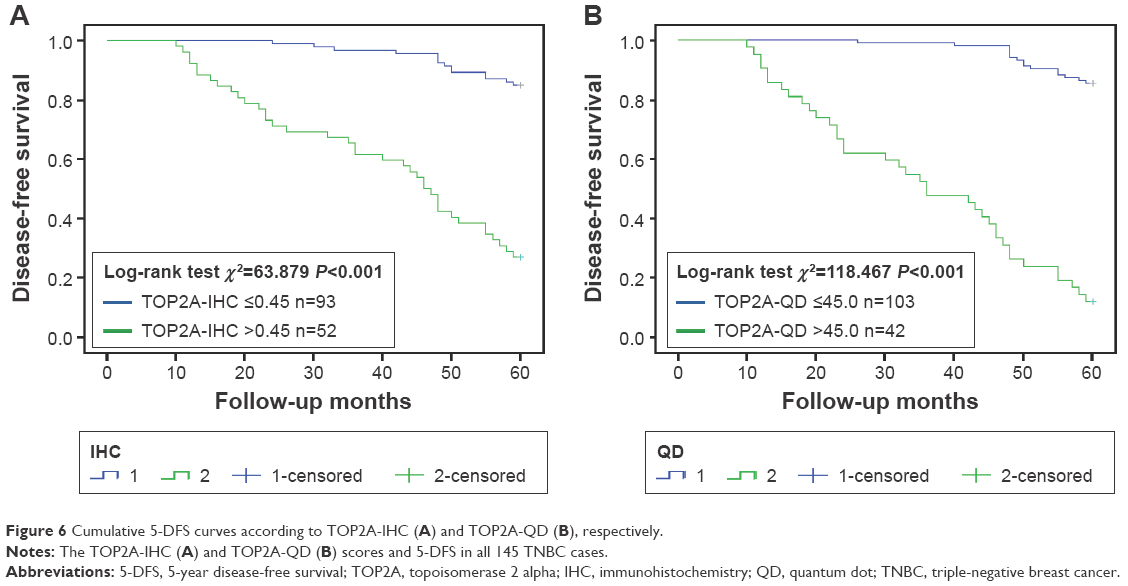 | Figure 6 Cumulative 5-DFS curves according to TOP2A-IHC (A) and TOP2A-QD (B), respectively. |
Multivariable Cox regression model analyses (Table 2) revealed that the TOP2A-QD (cutoff at 45.0) was associated with three times the rate of 5-DFS in TNBC (P=0.001) relative to a TOP2A-QD level above this cutoff.
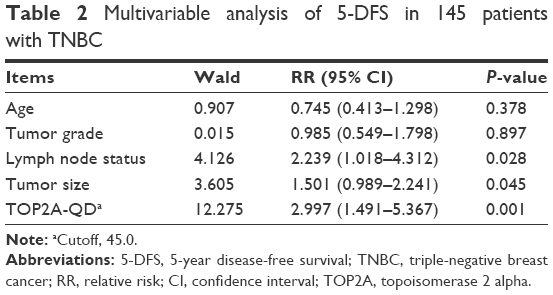 | Table 2 Multivariable analysis of 5-DFS in 145 patients with TNBC |
Discussion
It is well accepted that breast cancer is not a single disease but rather a heterogeneous collection of different molecular subtypes. As such, patients with similar pathological traits may have variable prognoses. Prognostic factors should always be tested at the level of each specific breast cancer molecular subtype. TOP2A expression varies significantly among breast cancer molecular subtypes. More specifically, highly proliferative subtypes such as triple negative, luminal B, and HER2-enriched expressed higher levels of the enzyme and are associated with poorer prognosis relative to less proliferative subtypes.12,25 In this study, we focused on TNBC only, which excluded the heterogeneity of breast cancer.
While TOP2A has been extensively studied in tumor samples, such as breast cancer, prostate cancer, gastric cancer, and ovarian cancer,25–28 its role in carcinogenesis and tumor progression has not been well established. Most studies exploring the potential relationship between TOP2A expression and breast cancer typically focus on the following four aspects:12,25,29–32 1) predictive role of anthracycline sensitivity, 2) different detection methods, 3) prognostic value in different subtypes of breast cancer, and 4) correlation with HER2 and chromosome 17 centromere (CEP17). Our study focused on the second and third aspects.
There are a range of different approaches for detecting TOP2A,12,30 including 1) TOP2A gene detection such as FISH and quantitative polymerase chain reaction, 2) TOP2A mRNA detection such as reverse transcription polymerase chain reaction and microarray, and 3) TOP2A protein detection such as IHC, IHC and FISH being the two methods most widely used. However, it has been reported that the results derived from IHC and FISH did not correlate strongly.12,15,33,34 Furthermore, the TOP2A gene level has previously been reported to be nonpredictive of the subsequent gene-product protein level.25 IHC is currently the most popular detection method in clinical practice to detect the TOP2A protein. This method is however limited, being both subjective and semiquantitative. In this study, we investigated the expression of TOP2A protein in TNBC tissues using QD-based immunofluorescent imaging and quantitative analytical system (QD-IIQAS). Relative to traditional IHC, we observed that QD-IIQAS exhibited good correlation and consistency with conventional IHC, with better image quality and accuracy, which was inferred from the greater area under the ROC curve. This is consistent with previous reports studying other biomarkers using the QD-based nanotechnology.21,22,24,35,36 Most importantly, the image gained by QD-IIQAS can be spectrally unmixed without the disturbance of background and quantitatively analyzed by computer software to eliminate the bias that may be caused by manual counting in conventional IHC. Given these advantages over conventional methods, QD-IIQAS has the potential for broad clinical application in the future. As the function and features of TOP2A become better characterized and the standardization of QD-IIQAS across laboratories occurs, this new detection method is likely to be further refined and has great potential for application in clinical practice.
So far, consensus has yet to be established for a threshold value for TOP2A expression that could define subgroups associated with treatment response.29 Furthermore, with regard to the precise prognostic value of TOP2A expression, the existing evidence base is mixed with numerous conflicting results.7,25,29,34,37,38 Qiao et al25 reported a subgroup analysis, which demonstrated no significant differences in overall survival or DFS between TOP2A-positive and TOP2A-negative groups in patients with breast cancer. However, Brase et al34 reported that TOP2A expression was significantly associated with the metastasis-free interval and complete remission in patients with breast cancer. Rody et al7 found that a worse prognosis of high TOP2A expressing tumors was observed in the subgroup of HER2-negative breast tumors. In our study, based on the principle of optimizing observed sensitivity and specificity, 45.0 and 0.45 were identified as cutoffs for TOP2A-QD and TOP2A-IHC, respectively; patients with higher TOP2A expression had worse DFS, vice versa. In addition, we also evaluated the prognostic significance of the TOP2A expression with the new QD-IIQAS method. The 5-DFS multivariable Cox regression model analyses supported the view that the TOP2A, determined by QD-IIQAS, was an independent predictor of survival. Identifying patients with or without response via individual treatment biomarkers is vital for a more personalized treatment approach. Therefore, this parameter (TOP2A) may be considered when we select the optimal therapeutics for patients with TNBC.
The most significant finding in our study was the identification of correlation of TOP2A-positive rate with large tumor size, high tumor grade, and positive lymph nodes status, which are all negative predictive factors for breast cancer. This is consistent with other studies.7,12,34 Romero et al12 reported that TOP2A expression in breast cancer was associated with high proliferation and aggressive tumor subtypes. Rody et al7 found that TOP2A expression showed a strong correlation with tumor size, grading, HER2, and Ki67 expression as well as nodal status. Interestingly, we found that the study concentrated mainly on T1 (67.6%) and grade 2 (80%) subgroups, which suggested that most early-stage TNBC patients were included in this study. This factor alone can influence the proportion of TOP2A-positive and -negative cases. Therefore, multicenter studies with a larger sample size are required to further corroborate our observations.
It has been previously suggested that TOP2A protein is upregulated in proliferating cancer cells, given its role in the cell duplication process.39 Our study supports this suggestion, through our observation also that TOP2A protein expression in normal breast tissue is significantly lower than TNBC tissues and the expression in poorly differentiated TNBC tissues was higher when compared with highly differentiated tissue. This suggests that TOP2A may be a good candidate surrogate marker of cell proliferation.
The recently published breast cancer National Comprehensive Cancer Network (NCCN) guidelines have removed the chemotherapy regimen FEC/FAC (F: fluorouracil, E: epirubicin, A: doxorubicin, and C: cyclophosphamide) from the adjuvant/neoadjuvant treatment choice of invasive breast cancer.40 In addition, a recent analysis of the 10-year follow-up data from the BCIRG006 study suggested that anthracycline may not be essential treatment for specific breast cancer.38 The chemotherapy regimen TCH (T: docetaxel, C: carboplatin, and H: trastuzumab) was associated with similar efficacy and less cardiac toxicity relative to AC (A: doxorubicin and C: cyclophosphamide) following TH (T: paclitaxel and H: trastuzumab) treatment regimen. This further challenges the current role of anthracycline in the treatment for invasive breast carcinomas.41 Therefore, precise detection and quantification of TOP2A (target of anthracycline) play an extremely important role in clinical practice. In this context, we explored a new method for detecting TOP2A, which could help clinicians better quantify TOP2A expression and select chemotherapy regimens appropriate for the molecular subtype of a cancer. For example, clinicians may opt to avoid the toxicity potentially associated with anthracyclines in some patients who do not express TOP2A or express TOP2A lowly.
This study has several limitations. First, this was a retrospective study using a nonrandomized patient cohort. Second, some of the sample slides were too old for QD-IIQAS to be performed accurately and were thus excluded from statistical error analysis. Third, we did not compare the expression of TOP2A between different subtypes of breast cancer. Fourth, the QD-IIQAS technology has not been popular, especially in basic hospitals, so the popularity of QD-IIQAS still needs more time to realization. Nevertheless, QD-based nanotechnology provides a new insight into reliable biomarker detection. This study successfully conducted in situ immunofluorescent imaging and quantitative detection of TOP2A, observing a strong correlation between high TOP2A expression and large tumor size, low histological differentiation and positive lymph nodes status and indicating that TOP2A was an independent prognosticator in TNBC patients. This sets a solid basis for the subsequent studies to further characterize the relationship between TOP2A expression and response to anthracyclines.
Acknowledgments
This work was supported by the grants from the National Science Foundation of China (grant numbers 81201196, 81471781, 81302314, and 81230031), the National Key Scientific Instrument and Equipment Development Project (grant number 20133655893), the Key Scientific Research Project of Hubei Provincial Department of Education (grant number D20126102), the Natural Science Foundation of Hubei Province, People’s Republic of China (grant numbers 301130851 and 2011CBD489), the Research Foundation of Public Health Bureau of Hubei Province (grant numbers JS-2011018, JX4B19, and JX3A14), and the Key Project of Health and Family Planning Commission of Hubei Province (grant number WJ2015MA016).
Disclosure
The authors report no conflicts of interest in this work.
References
Torre LA, Bray F, Siegel RL, Ferlay J, Lortet-Tieulent J, Jemal A. Global cancer statistics, 2012. CA Cancer J Clin. 2015;65(2):87–108. | ||
Thike AA, Iqbal J, Cheok PY, et al. Triple negative breast cancer: outcome correlation with immunohistochemical detection of basal markers. Am J Surg Pathol. 2010;34(7):956–964. | ||
Palma G, Frasci G, Chirico A, et al. Triple negative breast cancer: looking for the missing link between biology and treatments. Oncotarget. 2015;6(29):26560–26574. | ||
Ismail-Khan R, Bui MM. A review of triple-negative breast cancer. Cancer Control. 2010;17(3):173–176. | ||
Prat A, Adamo B, Cheang MC, Anders CK, Carey LA, Perou CM. Molecular characterization of basal-like and non-basal-like triple-negative breast cancer. Oncologist. 2013;18(2):123–133. | ||
Zhou L, Li K, Luo Y, et al. Novel prognostic markers for patients with triple-negative breast cancer. Hum Pathol. 2013;44(10):2180–2187. | ||
Rody A, Karn T, Ruckhäberle E, et al. Gene expression of topoisomerase II alpha (TOP2A) by microarray analysis is highly prognostic in estrogen receptor (ER) positive breast cancer. Breast Cancer Res Treat. 2009;113(3):457–466. | ||
Tewey KM, Rowe TC, Yang L, Halligan BD, Liu LF. Adriamycin-induced DNA damage mediated by mammalian DNA topoisomerase II. Science. 1984;226(4673):466–468. | ||
Harris LN, Broadwater G, Abu-Khalaf M, et al. Topoisomerase II{alpha} amplification does not predict benefit from dose-intense cyclophosphamide, doxorubicin, and fluorouracil therapy in HER2-amplified early breast cancer: results of CALGB 8541/150013. J Clin Oncol. 2009;27(21):3430–3436. | ||
Mano MS, Rosa DD, De Azambuja E, Ismael GF, Durbecq V. The 17q12-q21 amplicon: her2 and topoisomerase-IIalpha and their importance to the biology of solid tumours. Cancer Treat Rev. 2007;33(1):64–77. | ||
Olszewski W, Pieńkowski T, Olszewski W, et al. Topoisomerase 2α status in invasive breast carcinoma – comparison of its clinical value according to immunohistochemical and fluorescence in situ hybridization methods of evaluation. Pol J Pathol. 2014;65(4):283–290. | ||
Romero A, Martín M, Cheang MC, et al. Assessment of Topoisomerase II |á status in breast cancer by quantitative PCR, gene expression microarrays, immunohistochemistry, and fluorescence in situ hybridization. Am J Pathol. 2011;178(4):1453–1460. | ||
Sparano JA, Goldstein LJ, Childs BH, et al. Relationship between topoisomerase 2A RNA expression and recurrence after adjuvant chemotherapy for breast cancer. Clin Cancer Res. 2009;15(24):7693–7700. | ||
Di LA, Desmedt C, Bartlett JM, et al. HER2 and TOP2A as predictive markers for anthracycline-containing chemotherapy regimens as adjuvant treatment of breast cancer: a meta-analysis of individual patient data. Lancet Oncol. 2011;12(12):1134–1142. | ||
O’Malley FP, Chia S, Tu D, et al. Topoisomerase II alpha and responsiveness of breast cancer to adjuvant chemotherapy. J Natl Cancer Inst. 2009;101(9):644–650. | ||
Michalet X, Pinaud FF, Bentolila LA, et al. Quantum dots for live cells, in vivo imaging, and diagnostics. Science. 2005;307(5709):538–544. | ||
Wang Y, Chen L. Quantum dots, lighting up the research and development of nanomedicine. Nanomedicine. 2011;7(4):385–402. | ||
Wang X, Yang L, Chen ZG, Shin DM. Application of nanotechnology in cancer therapy and imaging. CA Cancer J Clin. 2008;58(2):97–110. | ||
Chen C, Peng J, Sun SR, Peng CW, Li Y, Pang DW. Tapping the potential of quantum dots for personalized oncology: current status and future perspectives. Nanomedicine (Lond). 2012;7(3):411–428. | ||
Wang LW, Peng CW, Chen C, Li Y. Quantum dots-based tissue and in vivo imaging in breast cancer researches: current status and future perspectives. Breast Cancer Res Treat. 2015;151(1):7–17. | ||
Yuan JP, Wang LW, Qu AP, et al. Quantum dots-based quantitative and in situ multiple imaging on ki67 and cytokeratin to improve ki67 assessment in breast cancer. PLoS One. 2015;10(4):e0122734. | ||
Sun JZ, Chen C, Jiang G, Tian WQ, Li Y, Sun SR. Quantum dot-based immunofluorescent imaging of Ki67 and identification of prognostic value in HER2-positive (non-luminal) breast cancer. Int J Nanomedicine. 2014;9:1339–1346. | ||
Chen C, Yuan JP, Wei W, et al. Subtype classification for prediction of prognosis of breast cancer from a biomarker panel: correlations and indications. Int J Nanomedicine. 2014;9:1039–1048. | ||
Zheng HM, Chen C, Wu XH, et al. Quantum dot-based in situ simultaneous molecular imaging and quantitative analysis of EGFR and collagen IV and identification of their prognostic value in triple-negative breast cancer. Tumour Biol. 2016;37(2):2509–2518. | ||
Qiao JH, Jiao DC, Lu ZD, Yang S, Liu ZZ. Clinical significance of topoisomerase 2A expression and gene change in operable invasive breast cancer. Tumour Biol. 2015;36(9):6833–6838. | ||
Karnes RJ, Cheville JC, Ida CM, et al. The ability of biomarkers to predict systemic progression in men with high-risk prostate cancer treated surgically is dependent on ERG status. Cancer Res. 2010;70(22):8994–9002. | ||
Moiseyenko VM, Volkov NM, Suspistin EN, et al. Evidence for predictive role of BRCA1 and bTUBIII in gastric cancer. Med Oncol. 2013;30(2):545. | ||
Sherman-Baust CA, Kuhn E, Valle BL, et al. A genetically engineered ovarian cancer mouse model based on fallopian tube transformation mimics human high-grade serous carcinoma development. J Pathol. 2014;233(3):228–237. | ||
Romero A, Caldés T, Díaz-Rubio E, Martín M. Topoisomerase 2 alpha: a real predictor of anthracycline efficacy. Clin Transl Oncol. 2012;14(3):163–168. | ||
García-Caballero T, Prieto O, Vázquez-Boquete A, et al. Dual-colour CISH is a reliable alternative to FISH for assessment of topoisomerase 2-alpha amplification in breast carcinomas. Breast Cancer Res Treat. 2014;143(1):81–89. | ||
Jacot W, Fiche M, Zaman K, Wolfer A, Lamy PJ. The HER2 amplicon in breast cancer: topoisomerase IIA and beyond. Biochim Biophys Acta. 2013;1836(1):146–157. | ||
Reinholz MM, Bruzek AK, Visscher DW, et al. Breast cancer and aneusomy 17: implications for carcinogenesis and therapeutic response. Lancet Oncol. 2009;10(3):267–277. | ||
Fountzilas G, Valavanis C, Kotoula V, et al. HER2 and TOP2A in high-risk early breast cancer patients treated with adjuvant epirubicin-based dose-dense sequential chemotherapy. J Transl Med. 2012;10:10. | ||
Brase JC, Schmidt M, Fischbach T, et al. ERBB2 and TOP2A in breast cancer: a comprehensive analysis of gene amplification, RNA levels, and protein expression and their influence on prognosis and prediction. Clin Cancer Res. 2010;16(8):2391–2401. | ||
Chen C, Peng J, Xia H, et al. Quantum-dot-based immunofluorescent imaging of HER2 and ER provides new insights into breast cancer heterogeneity. Nanotechnology. 2010;21(9):095101. | ||
Chen C, Peng J, Xia HS, et al. Quantum dots-based immunofluorescence technology for the quantitative determination of HER2 expression in breast cancer. Biomaterials. 2009;30(15):2912–2918. | ||
Fountzilas G, Christodoulou C, Bobos M, et al. Topoisomerase II alpha gene amplification is a favorable prognostic factor in patients with HER2-positive metastatic breast cancer treated with trastuzumab. J Transl Med. 2012;10:212. | ||
Press MF, Sauter G, Buyse M, et al. Alteration of topoisomerase II-alpha gene in human breast cancer: association with responsiveness to anthracycline-based chemotherapy. J Clin Oncol. 2011;29(7):859–867. | ||
Turley H, Comley M, Houlbrook S, et al. The distribution and expression of the two isoforms of DNA topoisomerase II in normal and neoplastic human tissues. Br J Cancer. 1997;75(9):1340–1346. | ||
Gradishar WJ, Anderson BO, Balassanian R, et al. Breast cancer, version 1. 2016. J Natl Compr Canc Netw. 2015;13(12):1475–1485. | ||
Slamon D, Eiermann W, Robert N, et al. Adjuvant trastuzumab in HER2-positive breast cancer. N Engl J Med. 2011;365(14):1273–1283. |
 © 2016 The Author(s). This work is published and licensed by Dove Medical Press Limited. The
full terms of this license are available at https://www.dovepress.com/terms
and incorporate the Creative Commons Attribution
- Non Commercial (unported, 3.0) License.
By accessing the work you hereby accept the Terms. Non-commercial uses of the work are permitted
without any further permission from Dove Medical Press Limited, provided the work is properly
attributed. For permission for commercial use of this work, please see paragraphs 4.2 and 5 of our Terms.
© 2016 The Author(s). This work is published and licensed by Dove Medical Press Limited. The
full terms of this license are available at https://www.dovepress.com/terms
and incorporate the Creative Commons Attribution
- Non Commercial (unported, 3.0) License.
By accessing the work you hereby accept the Terms. Non-commercial uses of the work are permitted
without any further permission from Dove Medical Press Limited, provided the work is properly
attributed. For permission for commercial use of this work, please see paragraphs 4.2 and 5 of our Terms.