Back to Journals » Clinical Ophthalmology » Volume 17
Quantitative Wide-Field Swept-Source Optical Coherence Tomography Angiography and Visual Outcomes in RAO
Authors Lu Y, Cui Y, Zhu Y, Lu ES, Zeng R, Garg I ![]() , Katz R
, Katz R ![]() , Le R, Wang JC, Vavvas DG, Husain D
, Le R, Wang JC, Vavvas DG, Husain D ![]() , Miller JW, Wu D, Miller JB
, Miller JW, Wu D, Miller JB ![]()
Received 9 May 2023
Accepted for publication 1 August 2023
Published 22 August 2023 Volume 2023:17 Pages 2505—2513
DOI https://doi.org/10.2147/OPTH.S418370
Checked for plagiarism Yes
Review by Single anonymous peer review
Peer reviewer comments 2
Editor who approved publication: Dr Scott Fraser
Yifan Lu,1,2,* Ying Cui,1,3,* Ying Zhu,1,4,* Edward S Lu,1 Rebecca Zeng,1 Itika Garg,1 Raviv Katz,1 Rongrong Le,1,5 Jay C Wang,1 Demetrios G Vavvas,1,2 Deeba Husain,1,2 Joan W Miller,1,2 David Wu,1,2 John B Miller1,2
1Harvard Retinal Imaging Lab, Massachusetts Eye and Ear, Boston, MA, USA; 2Department of Ophthalmology, Harvard Medical School, Boston, MA, USA; 3Guangdong Eye Institute, Department of Ophthalmology, Guangdong Provincial People’s Hospital, Guangdong Academy of Medical Sciences, Guangzhou, People’s Republic of China; 4Eye Center of Xiangya Hospital, Central South University, Changsha, Hunan, People’s Republic of China; 5Wenzhou Medical University Affiliated Eye Hospital, Wenzhou Medical University, Wenzhou, Zhejiang, People’s Republic of China
*These authors contributed equally to this work
Correspondence: John B Miller, Retina Service, Mass, Eye and Ear Infirmary, Harvard Medical School, 243 Charles St, Boston, MA, 02114, USA, Tel +1 (617) 573-3750, Fax +1 (617) 573-3698, Email [email protected]
Purpose: Retinal artery occlusion (RAO) is an ophthalmic emergency that can lead to poor visual outcomes and is associated with an increased risk of stroke and cardiovascular events. Wide-field swept-source OCT-A (WF SS-OCTA) can provide quick and non-invasive angiographic information with a wide field of view. Here, we looked for associations between OCT-A vascular imaging metrics and vision in RAO patients.
Methods: Patients with diagnoses of central (CRAO) or branched retinal artery occlusion (BRAO) were included. 6mm × 6mm Angio and 15mm × 15mm AngioPlex Montage OCT-A images were obtained for both eyes in each patient using Zeiss Plex Elite 9000 WF SS-OCTA device. Each 6mm × 6mm image was divided into nine Early Treatment Diabetic Retinopathy Study (ETDRS) subfields. Non-perfusion area (NPA) was manually measured using 15mm × 15mm images. A linear regression model was utilized to identify correlation between imaging metrics and vision. P-values less than 0.05 were considered as statistically significant.
Results: Twenty-five subjects were included. For RAO eyes, there was a statistically significant inverse correlation between retinal thickness as well as superficial capillary plexus (SCP) vessel density (VD) and vision. An inverse correlation was found between deep capillary plexus (DCP) VD and vision without statistical significance. There was a positive correlation between choroidal thickness as well as choroidal volume and vision without statistical significance. No significant correlation was found between the metrics and vision in contralateral eyes. For NPA and vision, no significant correlation was identified.
Conclusion: This is the first study to investigate the utility of WF SS-OCTA in RAO and to demonstrate correlations between retinal vascular imaging metrics and visual outcomes. The results of this study provide a basis to understand the structural changes involved in vision in RAO and may guide management of RAO and prevention of cerebral stroke and cardiovascular accidents.
Keywords: WF SS-OCTA, RAO, BRAO, CRAO, ETDRS, ARI network
Introduction
Retinal artery occlusion (RAO) is an ophthalmic emergency, characterized by a sudden, painless loss of vision due to complete or partial obstruction of the retinal artery. Three-quarters of patients with CRAO experience a visual acuity of 20/400 or worse. This event is also associated with an increased risk of cerebral stroke and cardiovascular events.1,2 Currently, there is a lack of evidence-based therapy in contrast to the well-accepted treatment protocols for ischemic cerebral stroke.1,3 Thus, any biomarkers of RAO that portend poor visual prognosis or cardiovascular risk would be beneficial to guide management of this disease.
Aside from a thorough history and physical exam, RAO is traditionally evaluated using fluorescein angiography (FA). Optical coherence tomography angiography (OCT-A) is an emerging technology that provides quick and non-invasive angiographic information including detailed visualization of collateral microcirculation and assess global nonperfusion status.4–10 Most literature regarding use of OCT-A in RAO consists of case reports, with scarce quantitative studies. In these studies, OCT-A has been used to demonstrate decreased vessel density (VD) of the superficial capillary plexus (SCP) and deep capillary plexus (DCP) in RAO patients.11–15 To date, most quantitative retinal vascular studies examine a limited view of the retina with the 6mm × 6mm and 3mm × 3mm scan. Additionally, many lack adequate power to provide substantial conclusions about RAO.
Compared to other OCTs, wide-field swept-source OCT-A (WF SS-OCTA) uses faster scanning speeds, allowing for a more detailed and wider view of the retinal vasculature.7–10,16 WF SS-OCTA imaging now allows for a significantly wider field of view from 50 degrees to 80 degrees, allowing for evaluation of the vitreous, retinal microstructures and microvasculature in the posterior pole and parts of the midperiphery. In this study, we analyzed parameters in patients with prior diagnosis of RAO including VD of the SCP and DCP, retinal thickness, choroidal thickness, choroidal volume, and non-perfusion area (NPA) using WF SS-OCTA. We subsequently studied the correlation between these OCT-A vascular metrics and visual acuity.
Methods
This is a cross-sectional, observational study that was approved and carried out in accordance with the Institutional Review Board (IRB) guidelines of Massachusetts Eye and Ear (MEE). All procedures adhered to the tenets of the Declaration of Helsinki and health Insurance Portability and Accountability Act regulations.
Study Participants
Study participants were recruited from the MEE Retina Service from December 2018 to March 2020, and an informed consent was obtained from all study subjects prior to enrollment. Patients with prior diagnoses of central retinal artery occlusion (CRAO) or branched retinal artery occlusion (BRAO) were included in the study. Exclusion criteria included concomitant chorioretinal diseases, prior diagnosis of glaucoma, or severe media opacities that could interfere with visual acuity and image acquisition. Eyes with imaging signal strength index less than seven using the default setting of the instrument, low imaging quality that prevents automatic montage image generation by the machine, or images with severe artifacts that prevent accurate imaging classification were also excluded from the study.
Study Protocol and Imaging
Participants would undergo a full ophthalmic workup including Snellen best-corrected visual acuity (BCVA) assessment, slit-lamp examination, and dilated fundus examination during their regular clinic visits. OCT-A images were obtained using the Zeiss Plex Elite 9000 WF SS-OCTA device (Carl Zeiss Meditec, Inc) after pupillary dilation. A 6mm × 6mm Angio scan centered on the fovea and a 15mm × 15mm AngioPlex Montage scan were performed for both diseased eye and contralateral eye for each patient. SCP, DCP and choroid images were generated for each eye using default layer segmentation software.
Image Analysis
VD of the SCP and DCP, choroidal thickness, choroidal volume, as well as the retinal thickness of the 6mm × 6mm images were calculated by the Advanced Retina Imaging (ARI) Network (Zeiss Portal v5.4–1206) using its preset algorithms. VD was defined as the proportion of the image area occupied by blood vessels. The retinal thickness was the distance between the internal limiting membrane (ILM) and the central line of the retinal pigment epithelium (RPE). Choroidal thickness was the distance from the posterior edge of the RPE to the choroid/sclera junction.
Each 6mm × 6mm image was divided into nine Early Treatment Diabetic Retinopathy Study (ETDRS) subfields (Figure 1). The inner and outer ring each was consisted of four subfields – the superior, inferior, nasal and temporal subfields. For each study parameter, the average measurement of the central foveal subfield, inner ring, and outer ring was calculated. Choroidal volume of each subfield was calculated using the choroidal volume map and three-dimensional topography automatically generated by the device.
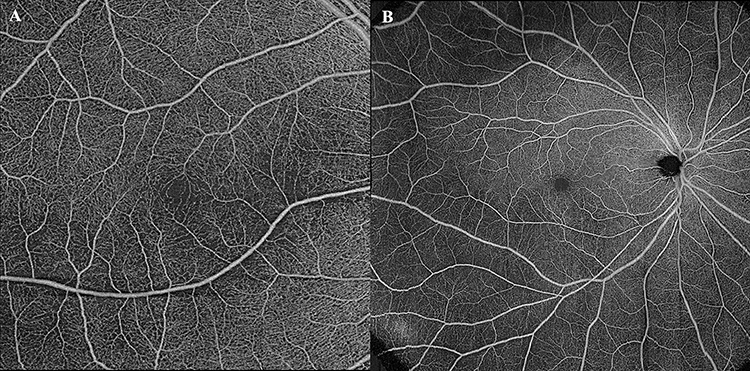 |
Figure 1 (A) The 6mm × 6mm Angio en face OCT-A image centered on fovea. (B) The 15mm × 15mm Montage en face OCT-A whole retina image. |
The whole retina layer of the OCT-A scans was used to calculate the NPA of a 15mm × 15mm Montage image (Figure 2). NPA was the area of retina in mm2 without tissue perfusion that was caused by vascular occlusion. Two investigators (YL, ESL) separately and independently measured the NPA using the Fiji image processing software (National Institutes of Health, Maryland, USA). NPA measured in square pixels was converted to square millimeters using the formula: NPA (mm2) = NPA (pixel2) / total surface area (pixel2) * total surface area (mm2). The mean value of each NPA measurement between the two graders was then calculated for data analysis.
 |
Figure 2 The 6mm × 6mm OCT-A image of a BRAO patient is divided into 9 ETDRS subfields. (A) Superficial vessel heat map. (B) Deep vessel heat map. (C) Macular thickness map. (D) Choroidal thickness map. |
Statistical Analysis
Statistical analysis was performed using the JASP software (University of Amsterdam, Amsterdam, Noord-Holland). A linear regression model was utilized to identify a correlation between the primary outcomes (VD, retinal thickness, choroidal thickness, choroidal volume, NPA) and the secondary outcome (visual acuity). A P-value less than 0.05 was considered to be statistically significant.
Results
A total of twenty-five subjects were included in the study (Table 1). Of the twenty-five subjects, eleven patients had diagnosis of BRAO (44%) and fourteen had diagnosis of CRAO (56%). About 68% of the participants were male and 32% were female, while the age distribution was 61 + 11 years old.
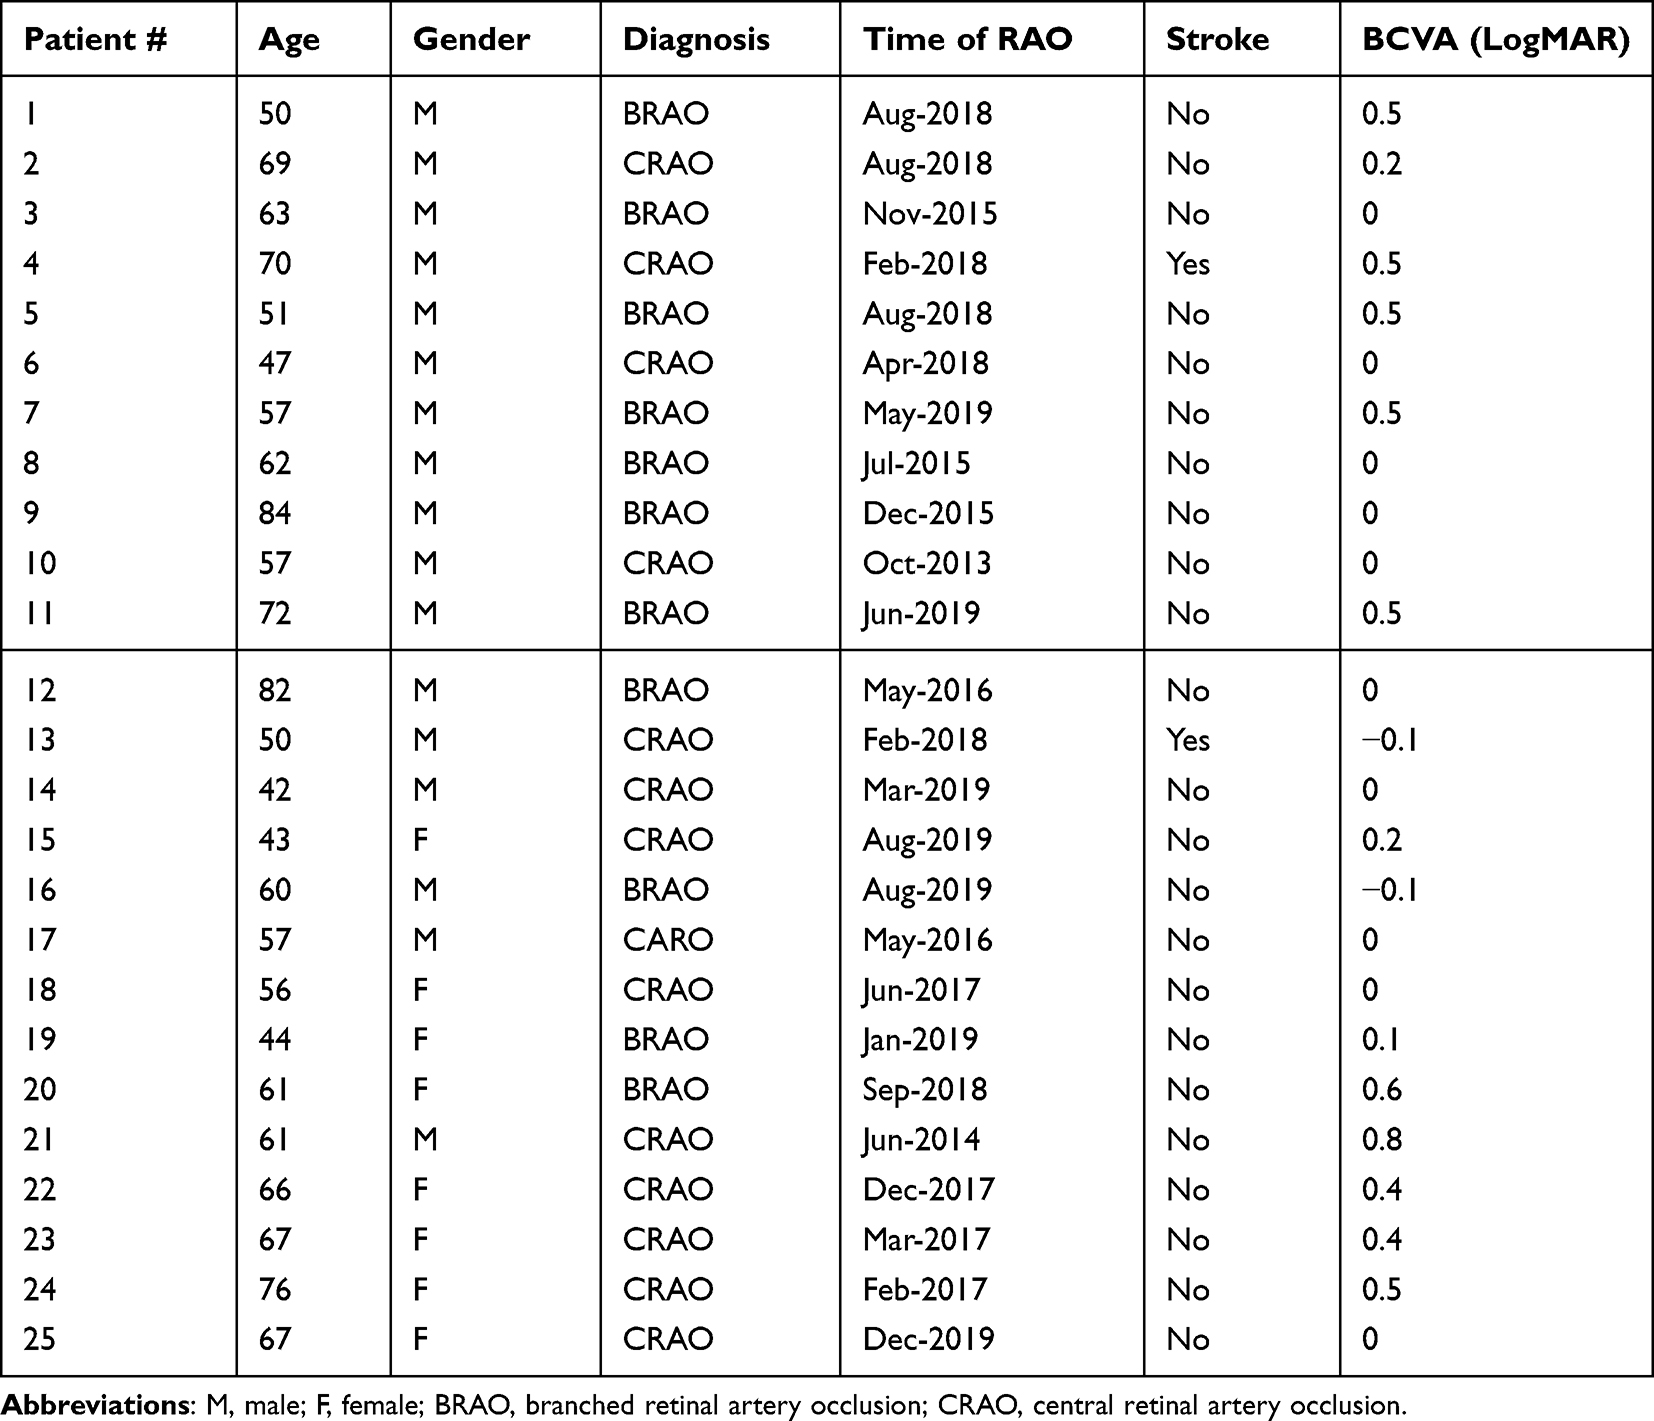 |
Table 1 Patient Demographic Information |
Retinal Thickness vs Vision
For RAO eyes, the average retinal thickness was measured to be 257 + 38 µm for central foveal subfield, 282 + 49 µm for inner ring, 249 + 35 µm for outer ring, and 264 + 40 µm for the entire image. A statistically significant inverse correlation was found between retinal thickness and vision in all subfields (Table 2).
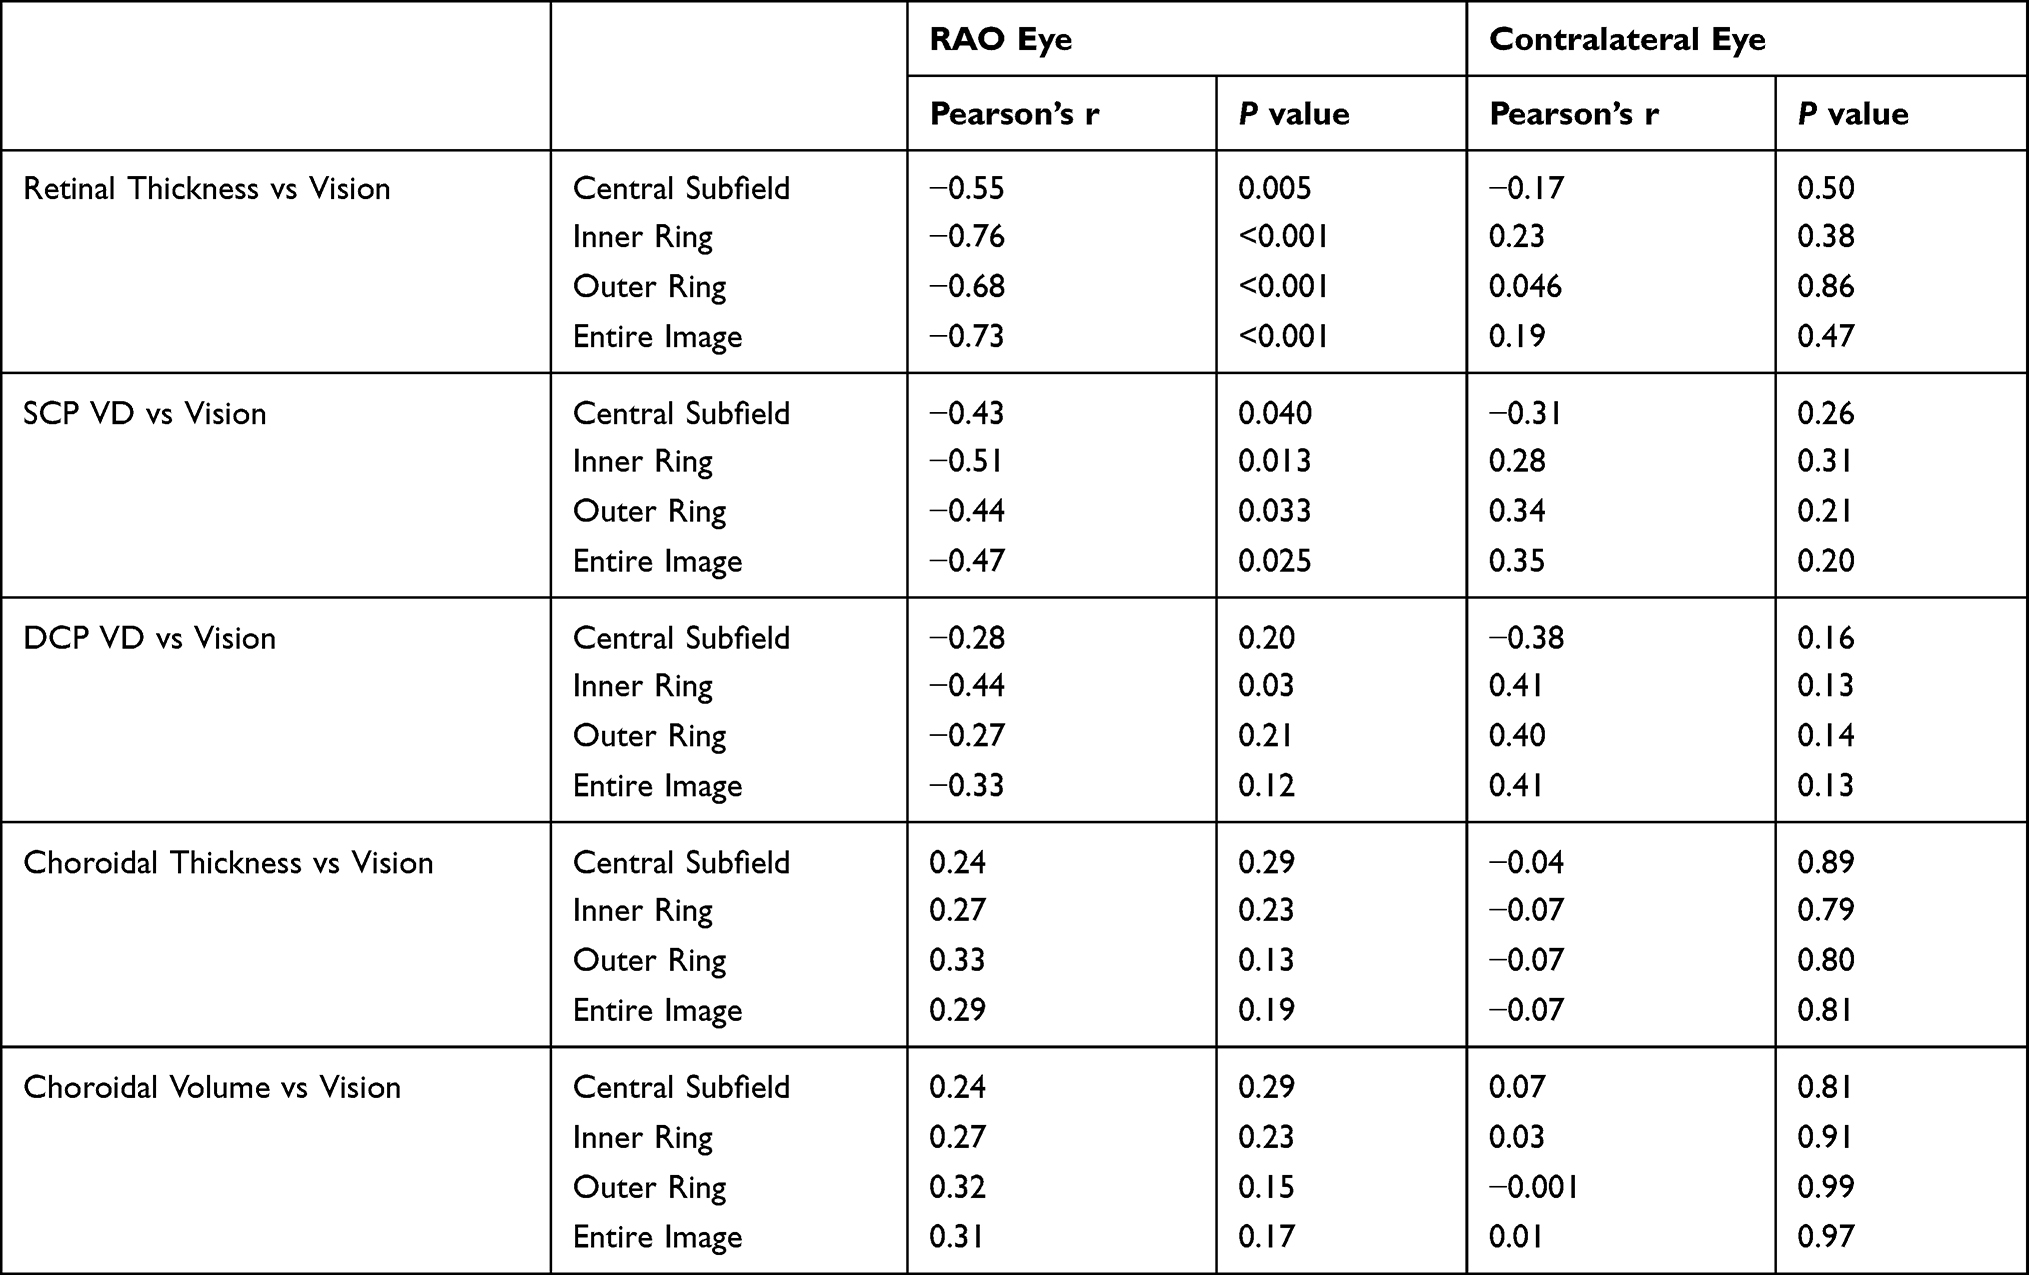 |
Table 2 Correlation Between Retinal Thickness, SCP VD, DCP VD, Choroidal Thickness, Choroidal Volume vs Vision in RAO Eyes and Contralateral Eyes |
For contralateral eyes, the average retinal thickness was measured to be 272 + 38 µm for central foveal subfield, 326 + 30 µm for inner ring, 284 + 15 µm for outer ring, and 301 + 22 µm for the entire image. No correlation was found between retinal thickness in contralateral eyes and vision in all subfields.
SCP VD vs Vision
For RAO eyes, the average SCP VD was measured to be 0.36 + 0.087 for central foveal subfield, 0.36 + 0.091 for inner ring, 0.36 + 0.090 for outer ring, and 0.35 + 0.084 for the entire image. A statistically significant inverse correlation was found between SCP VD and vision in all subfields.
For contralateral eyes, the average SCP VD was measured to be 0.41 + 0.044 for central foveal subfield, 0.40 + 0.052 for inner ring, 0.42 + 0.045 for outer ring, and 0.39 + 0.046 for the entire image. No correlation was found between SCP VD in contralateral eyes and vision in all subfields.
DCP VD vs Vision
For RAO eyes, the average DCP VD was measured to be 0.17 + 0.089 for central foveal subfield, 0.16 + 0.098 for inner ring, 0.18 + 0.093 for outer ring, and 0.16 + 0.084 for the entire image. An inverse correlation was found between DCP VD and vision in all subfields without statistical significance.
For contralateral eyes, the average DCP VD was measured to be 0.25 + 0.079 for central foveal subfield, 0.25 + 0.082 for inner ring, 0.26 + 0.084 for outer ring, and 0.24 + 0.075 for the entire image. No correlation was found between DCP VD in contralateral eyes and vision in all subfields.
Choroidal Thickness vs Vision
For RAO eyes, the average choroidal thickness was measured to be 278 + 102 µm for central foveal subfield, 269 + 93 µm for inner ring, 247 + 73 µm for outer ring, and 260 + 84 µm for the entire image. A positive correlation was found between choroidal thickness and vision in all subfields without statistical significance.
For contralateral eyes, the average choroidal thickness was measured to be 281 + 95 µm for central foveal subfield, 275 + 92 µm for inner ring, 248 + 71 µm for outer ring, and 264 + 82 µm for the entire image. An inverse correlation was found between choroidal thickness in contralateral eyes and vision in all subfields without statistical significance.
Choroidal Volume vs Vision
For RAO eyes, the average choroidal volume was measured to be 0.22 + 0.080 mm3 for central foveal subfield, 0.43 + 0.15 mm3 for inner ring, 1.29 + 0.39 mm3 for outer ring, and 0.79 + 0.24 mm3 for the entire image. A positive correlation was found between choroidal volume and vision in all subfields without statistical significance.
For contralateral eyes, the average choroidal volume was measured to be 0.21 + 0.065 mm3 for central foveal subfield, 0.41 + 0.13 mm3 for inner ring, 1.26 + 0.36 mm3 for outer ring, and 0.77 + 0.22 mm3 for the entire image. No correlation was found between choroidal volume in contralateral eyes and vision in all subfields.
NPA vs Vision
Eleven subjects had high-quality 15mm × 15mm Montage OCT-A images and were included for NPA measurements. The average NPA was measured to be 24.74 + 12.86 mm2. A correlation was found between decreased NPA and decreased vision without statistical significance (Pearson’s r = −0.080, p = 0.81).
Discussion
To our knowledge, this is the first study investigating the utility of WF SS-OCTA in RAO. We found significant correlation between BCVA vs retinal thickness, as well as BCVA vs superficial VD. Additionally, while there were no significant correlations between BCVA and deep VD, choroidal thickness and volume, a trend of decreased P-value was seen in the RAO eyes compared to the contralateral eyes, indicating the likelihood of finding significant correlation if a larger sample size was included. No significant correlation between NPA and vision was found.
In a retrospective observational series of 35 patients, Yu et al described SD OCT findings of acute RAO to include three patterns according to the involvement of retinal layers.15 For example, superficial capillary plexus ischemia corresponded to thickening and hyperreflectivity of the inner retinal layers. Secondly, intermediate and deep capillary plexus ischemia were represented by a paracentral acute middle maculopathy, shown by a hyperreflective band at the inner nuclear layer. Lastly, involvement of all three layers (superficial, intermediate and deep) was indicated by the presence of diffuse thickening and hyperreflectivity of both the inner and middle retinal layers. However, as the acute RAO lesions progressed to chronic lesions, they found resultant thinning and atrophy of the same layers affected in the acute phase. Yang et al examined the 3 mm × 3 mm macular area in 19 eyes of 19 patients with RAO, and found that the central macular thickness (CMT), parafoveal thickness as well as the overall thickness of the 3 mm × 3 mm cube were significantly elevated in patients with RAO. In a case report of bilateral RAO, retinal atrophy progressed over several months while loss of the retinal microvasculature in the superficial and deep capillary plexus was acute and permanent. Our study used a wider field of view of 6 mm × 6 mm and showed an inverse correlation between overall retinal thickness, retinal thickness of the inner and outer rings according to the ETDRS grid, and BCVA. Additionally, we found an inverse correlation of superficial VD and deep VD with BCVA. Taken together, our findings are consistent with previous literature which details involvement of the SCP and DCP. Additionally, we demonstrated the correlation between these findings, as well as the resultant retinal atrophy and thinning after RAO, with visual function.
This study found that increasing choroidal volume and choroidal thickness may be correlated with better BCVA in RAO, although this finding did not reach statistical significance. However, given that the P-values of the affected eye are significantly less than that of the unaffected eye, it is likely that these correlations would reach statistical significance given a larger sample size. Choroidal thickness correlates with choroidal blood flow, as an increase in blood flow is associated with an increased choroidal thickness.17 According to Schmidt et al,18 CRAO can be classified as incomplete, subtotal and total CRAO according to the severity of vision loss, retinal edema, and retinal artery filling. The preservation of choroidal blood flow during ischemia of the superficial and deep plexus is thought to be the basis for the appearance of the “cherry-red spot” in incomplete and subtotal CRAO. On the contrary, in a study of 134 eyes with acute CRAO, Ahn et al19 found that choroidal hypoperfusion is key to distinguishing total CRAO, which is associated with subfoveal choroidal thinning, in addition to marked macular edema. However, they also did not find any significant correlation of baseline choroidal thickness with BCVA.
Lastly, to our knowledge, this is the first study that examines non-perfusion area in isolated RAO with WF SS-OCTA. Sotelo et al20 presented one case of combined CRVO and CRAO and used WF SS-OCTA to illustrate severe nonperfusion of SCP and DCP at the macula and entire retina at 360 degrees. While visualization of the peripheral retina was limited due to the patient’s poor fixation at the 3-month follow-up, WF SS-OCTA still demonstrated more information about the posterior pole nonperfusion status than FA. At the 6-month follow-up, WF SS-OCTA was able to demonstrate a similar or wider view of the retina than FA. In another case report, Bonnin et al21 described observation of a non-perfusion area on SD-OCTA in a patient with BRAO, although slow perfusion was still detected on FA. This NPA resolved within 6 hours of the initial occlusive event. While we did not find any statistically significant correlation between NPAs and visual acuity in this study, only eleven patients had high-quality montages to be included in the analysis. Future studies with larger numbers of Montage OCT-A images may be needed to elucidate the effect of NPA on visual acuity in RAO.
Our study has a few limitations. First, a relatively small number of patients were included in this study with limited follow-up visits to provide longitudinal data to look for imaging biomarkers in patients with RAO who subsequently develop stroke. Also, this study did not include visual field as a second metric to evaluate visual function apart from BCVA. Lastly, the comparisons in this study were made with the fellow eye of each patient, rather than age-matched healthy eyes.
In conclusion, WF SS-OCTA was useful to examine the correlation between various vascular and structural metrics of the retina and visual outcomes in RAO. Multi-centered studies with larger sample size, and stratification by time after RAO and classification of CRAO and BRAO are needed to confirm these findings. Inclusion of age-matched healthy patients as control subjects for comparison may also provide additional information of how the data of RAO patients differs from that of similar population. Further investigation should also explore the association between these imaging findings and cardiovascular risk, given that RAO patients are at elevated risk for symptomatic stroke.22 Furthermore, there is currently a lack of strong evidence-based treatment for RAO; management ranges from ocular massage to surgical embolus removal to intravenous and intra-arterial thrombolysis.18,23 The results of this study provide a basis to understand the structural changes involved in visual outcomes in RAO and may guide management of RAO and prevention of cerebral stroke and cardiovascular accidents.
Acknowledgments
The abstract of this paper was presented at the ARVO Annual Meeting 2022 as a poster presentation with interim findings. The poster’s abstract was published in “ARVO Annual Meeting Abstract” in IOVS, June 2022, Vol.63, 2925 – F0078.
Funding
Lions International Fund (Grant 530125 and 530869). The funding organization had no role in design or conduct of this research.
Disclosure
J.B.M. is a consultant for Alcon, Allergan, Carl Zeiss, Sunovion, Topcon, and Genentech. J.C.Wang reports personal fees from Zeiss and Genentech, outside the submitted work. J.W.M reports personal fees and royalties paid to Mass Eye and Ear and distributed according to institutional policy from Valeant Pharmaceuticals; personal fees from, Scientific Advisory Board to; stock options from; licensed Patent (not yet commercialized) to ONL Therapeutics; personal fees, Board of Directors of and Stock Options from Aptinyx, Inc.; personal fees for consultancy from Sunovion, personal fees from and Scientific Advisory Board for KalVista Pharmaceuticals, personal fees for consultancy from Heidelberg Engineering, equity in company related to vaccine development from Ciendias Bio, grants from Lowy Medical Research Institute for Mactel Study (no PI salary), outside the submitted work; In addition, J.W.M has patents US 7,811,832, US 5,798,349; US 6,225,303; US 6,610,679; CA 2,185,644; CA 2,536,069 licensed to ONL Therapeutics. The authors report no other conflicts of interest in this work.
References
1. Varma DD, Cugati S, Lee AW, Chen CS. A review of central retinal artery occlusion: clinical presentation and management. Eye. 2013;27(6):688–697. doi:10.1038/EYE.2013.25
2. Biousse V, Nahab F, Newman NJ. Management of Acute Retinal Ischemia: follow the Guidelines! Ophthalmology. 2018;125(10):1597–1607. doi:10.1016/J.OPHTHA.2018.03.054
3. Chronopoulos A, Schutz JS. Central retinal artery occlusion-A new, provisional treatment approach. Surv Ophthalmol. 2019;64(4):443–451. doi:10.1016/J.SURVOPHTHAL.2019.01.011
4. Lu Y, Wang JC, Zeng R, et al. Quantitative comparison of microvascular metrics on three optical coherence tomography angiography devices in chorioretinal disease. Clin Ophthalmol. 2019;13:2063–2069. doi:10.2147/OPTH.S215322
5. Lu Y, Wang JC, Cui Y, et al. A quantitative comparison of four optical coherence tomography angiography devices in healthy eyes. Graefes Arch Clin Exp Ophthalmol. 2020;259:1493.
6. Cui Y, Zhu Y, Wang JC, et al. Imaging artifacts and segmentation errors with wide-field swept-source optical coherence tomography angiography in diabetic retinopathy. Transl Vis Sci Technol. 2019;8(6):18. doi:10.1167/tvst.8.6.18
7. Zhu Y, Cui Y, Wang JC, et al. Different scan protocols affect the detection rates of diabetic retinopathy lesions by wide-field Swept-Source optical coherence tomography angiography. Am J Ophthalmol. 2020;215:72–80. doi:10.1016/j.ajo.2020.03.004
8. Cui Y, Zhu Y, Wang JC, et al. Comparison of widefield swept-source optical coherence tomography angiography with ultra-widefield colour fundus photography and fluorescein angiography for detection of lesions in diabetic retinopathy. Br J Ophthalmol. 2020;105(4):577.
9. Lu E, Cui Y, Le R, et al. Detection of neovascularisation in the vitreoretinal interface slab using widefield swept-source optical coherence tomography angiography in diabetic retinopathy. Br J Ophthalmol. 2020;106:534–539. doi:10.1136/bjophthalmol-2020-317983
10. Cui Y, Zhu Y, Lu ES, et al. Widefield Swept-source OCT Angiography Metrics Associated with the Development of Diabetic VItreous Hemorrhage A Prospective Study. Ophthalmology. 2021;128(9):1312–1324. doi:10.1016/j.ophtha.2021.02.020
11. Bonini Filho MA, Adhi M, de Carlo TE. Optical Coherence Tomography Angiography In Retinal Artery Occlusion. Retina. 2015;35(11):2339–2346. doi:10.1097/IAE.0000000000000850
12. Yang S, Liu X, Li H, Xu J, Wang F. Optical coherence tomography angiography characteristics of acute retinal arterial occlusion. BMC Ophthalmol. 2019;19(1):1–9. doi:10.1186/S12886-019-1152-8
13. Feucht N, Zapp D, Reznicek L, Lohmann CP, Maier M, Mayer CS. Multimodal imaging in acute retinal ischemia: spectral domain OCT, OCT-angiography and fundus autofluorescence. Int J Ophthalmol. 2018;11(9):1521–1527. doi:10.18240/IJO.2018.09.15
14. Loidl M, Enders C, Werner JU, Lang GK, Lang GE. Neue Untersuchungsmöglichkeiten in der Beurteilung retinaler Arterienverschlüsse mittels OCT-Angiografie [Novel Examination Procedures for the Assessment of Retinal Artery Occlusion by OCT Angiography]. Klin Monbl Augenheilkd. 2017;234(9):1154–1160. German. doi:10.1055/S-0043-118224
15. Yu S, Pang CE, Gong Y. The spectrum of superficial and deep capillary ischemia in retinal artery occlusion. Am J Ophthalmol. 2015;159(1):53–63.e2. doi:10.1016/J.AJO.2014.09.027
16. Moon JY, Garg I, Cui Y, et al. Wide-field swept-source optical coherence tomography angiography in the assessment of retinal microvasculature and choroidal thickness in patients with myopia. Br J Ophthalmol. 2021;107(1):102–108. doi:10.1136/bjophthalmol-2021-319540
17. Vance SK, Imamura Y, Freund KB. The effects of sildenafil citrate on choroidal thickness as determined by enhanced depth imaging optical coherence tomography. Retina. 2011;31(2):332–335. doi:10.1097/IAE.0B013E3181EEF0AE
18. Schmidt DP, Schulte-Mönting J, Schumacher M. Prognosis of Central Retinal Artery Occlusion: local Intraarterial Fibrinolysis versus Conservative Treatment. Am J Neuroradiol. 2002;23(8):1301.
19. Ahn SJ, Woo SJ, Park KH, Jung C, Hong J-H, Han M-K. Retinal and Choroidal Changes and Visual Outcome in Central Retinal Artery Occlusion: an Optical Coherence Tomography Study. Am J Ophthalmol. 2015;159(4):667–676.e1. doi:10.1016/J.AJO.2015.01.001
20. Díez-Sotelo M, Abraldes M, Gómez-Ulla F. Multimodality Imaging Approach for Combined Central Retinal Vein and Artery Occlusion: the Role of Optical Coherence Tomography Angiography. Case Rep Ophthalmol. 2019;10(3):415–423. doi:10.1159/000504127
21. Bonnin S, Krivosic V, Cognat E, Tadayoni R. Visibility of Blood Flow on Optical Coherence Tomography Angiography in a Case of Branch Retinal Artery Occlusion. J Ophthalmic Vis Res. 2018;13(1):75. doi:10.4103/JOVR.JOVR_13_17
22. Avery MB, Magal I, Kherani A, Mitha AP. Risk of Stroke in Patients With Ocular Arterial Occlusive Disorders: a Retrospective Canadian Study. J Am Heart Assoc. 2019;8(3). doi:10.1161/JAHA.118.010509
23. Mehta N, Marco RD, Goldhardt R, Modi Y. Central Retinal Artery Occlusion: Acute Management and Treatment. Curr Ophthalmol Rep. 2017;5(2):149. doi:10.1007/S40135-017-0135-2
 © 2023 The Author(s). This work is published and licensed by Dove Medical Press Limited. The
full terms of this license are available at https://www.dovepress.com/terms
and incorporate the Creative Commons Attribution
- Non Commercial (unported, 3.0) License.
By accessing the work you hereby accept the Terms. Non-commercial uses of the work are permitted
without any further permission from Dove Medical Press Limited, provided the work is properly
attributed. For permission for commercial use of this work, please see paragraphs 4.2 and 5 of our Terms.
© 2023 The Author(s). This work is published and licensed by Dove Medical Press Limited. The
full terms of this license are available at https://www.dovepress.com/terms
and incorporate the Creative Commons Attribution
- Non Commercial (unported, 3.0) License.
By accessing the work you hereby accept the Terms. Non-commercial uses of the work are permitted
without any further permission from Dove Medical Press Limited, provided the work is properly
attributed. For permission for commercial use of this work, please see paragraphs 4.2 and 5 of our Terms.