Back to Journals » Journal of Pain Research » Volume 12
Quantitative proteomics analysis to identify biomarkers of chronic myofascial pain and therapeutic targets of dry needling in a rat model of myofascial trigger points
Authors Li L, Huang Q ![]() , Barbero M
, Barbero M ![]() , Liu L, Nguyen T, Beretta-Piccoli M, Xu A, Ji L
, Liu L, Nguyen T, Beretta-Piccoli M, Xu A, Ji L
Received 4 September 2018
Accepted for publication 12 November 2018
Published 7 January 2019 Volume 2019:12 Pages 283—298
DOI https://doi.org/10.2147/JPR.S185916
Checked for plagiarism Yes
Review by Single anonymous peer review
Peer reviewer comments 3
Editor who approved publication: Professor Michael Überall
Li-Hui Li,1,2 Qiang-Min Huang,1 Marco Barbero,2 Lin Liu,3 Thi-Tham Nguyen,4 Matteo Beretta-Piccoli,2 An-Le Xu,1 Li-Juan Ji1
1Department of Sport Medicine and Rehabilitation Center, Shanghai University of Sport, Shanghai, China; 2Rehabilitation Research Laboratory 2rLab, Department of Business Economics Health and Social Care, University of Applied Sciences and Arts of Southern Switzerland, Manno, Switzerland; 3Nanjing Sport Institute, Sport and Health Science Department, Nanjing, China; 4Faculty of Sport Science, Ton Duc Thang University, Ho Chi Minh City, Vietnam
Background: Proteomics analysis may provide important information regarding the pathogenesis of chronic myofascial pain and the mechanisms underlying the treatment effects of dry needling.
Materials and methods: This study used a rat model of myofascial trigger points (MTrPs) to perform a proteomics analysis. Three biological replicate experiments were used to compare the proteomes of healthy control rats, a rat model of MTrP, MTrP model rats following dry needling of MTrPs, and MTrP model rats following dry needling of non-MTrPs. Tandem mass tag (TMT) labeling technology based on nanoscale liquid chromatography-tandem mass spectrometry was used. Hierarchical clustering, gene ontology (GO) analysis, Kyoto Encyclopedia of Genes and Genomes (KEGG) analysis, and protein–protein interaction network analysis were performed to characterize the proteins. To validate the TMT results, three candidate biomarker proteins were verified using parallel reaction monitoring and Western blot analysis.
Results: A total of 2,635 proteins were identified. GO and KEGG enrichment analyses showed that the glycolysis/gluconeogenesis pathways played dominant roles in the pathogenesis of chronic myofascial pain. The three candidate biomarker proteins were the pyruvate kinase muscle isozyme (encoded by the PKM gene), the muscle isoform of glycogen phosphorylase (encoded by the PYGM gene), and myozenin 2 (encoded by the MYOZ2 gene). The validation results were consistent with the TMT results.
Conclusion: This is the first proteomics study that has investigated the pathogenesis of chronic myofascial pain and the mechanisms underlying the treatment effects of dry needling in an in vivo rat model of MTrPs, which might promote our understanding of the molecular mechanisms underlying chronic myofascial pain.
Keywords: musculoskeletal pain, acupuncture, bioinformatics, mass spectrometry, tandem mass tag, parallel reaction monitoring
Introduction
Myofascial pain is one of the most common types of chronic musculoskeletal pain in clinical medicine.1–3 A myofascial trigger point (MTrP) is defined as a hyperirritable spot in a palpable taut band of skeletal muscle fibers, and having MTrPs is necessary to confirm the diagnosis of myofascial pain. MTrPs can be clinically classified as latent or active.1,2 Latent MTrPs induce pain only on mechanical stimulation while active MTrPs cause spontaneous pain that is recognized as usual or familiar by the patients.1–4 The histopathological and electron microscopic features of active MTrPs include hyperchromatic rounded contracture nodules, bead-like or spindle-shaped muscle fibers, and markedly increased levels of inflammatory cells.4,5 An in vivo microanalytical technique used by Shah et al showed that the levels of IL-1b, IL-6, IL-8, tumor necrosis factor α, substance P, bradykinin, calcitonin gene-related peptide, and norepinephrine within a localized palpable active MTrP region in the upper trapezius muscle increased compared with those in subjects with latent MTrPs and in those without MTrPs.6–8 Hubbard and Berkoff first described the needle electromyography (EMG) patterns of the upper trapezius muscle MTrP as two abnormal patterns involving intermittent higher-amplitude spike-like activity of 100–700 mV and low-amplitude persistent activity of 50 mV.9 This persistent and spontaneous electrical activity (SEA) of the MTrP was supported by further investigations in clinical studies10,11 and preclinical studies.12,13 However, the diagnosis of MTrPs remains based solely on clinical examination,14 and no proteins or other biomarkers that are specific to MTrPs have been identified.
Dry needling is a commonly applied intervention for MTrPs. Several studies have reported a significant decrease in pain intensity, reduction of stiffness, and improvements in the range of motion, functionality, and muscle strength after dry needling treatment in patients with MTrP pain.15 Few studies have been conducted on the therapeutic mechanisms underlying dry needling, particularly at a molecular level. Using ELISA and Western blotting, Hsieh et al evaluated changes in enkephalin and β-endorphin in the serum, spinal cord, dorsal root ganglion, and muscle induced by acupuncture at distant MTrPs in rabbits; this indicated that the endogenous opioid system could be a potential analgesic mechanism underlying MTrP pain management.16 The limitation was that control groups (healthy and MTrP model groups [MGs]) were not involved.16 Another study showed that the levels of acetylcholine and acetylcholine receptor were significantly decreased and that the level of acetylcholine esterase was significantly increased after dry needling of MTrPs compared with those after dry needling of a non-MTrP muscle region in MTrP model rats.13 However, there remain insufficient studies on the exact mechanism underlying dry needling treatment of MTrPs.
Currently, studies on the mechanisms of MTrPs and dry needling have mainly focused on histopathology5 and EMG,10–12 which basically stay in the verification to support the integrated trigger point hypothesis proposed by Simons and Travell.17–20 In this hypothesis, the existence of MTrPs is classified as a neuromuscular dysfunction associated with long-lasting eccentric/concentric muscle activity that leads to two physiopathologic events: 1) energy depletion together with the release of sensitizing substances and 2) spontaneous nonquantal acetylcholine release due to a limited number of dysfunctional endplates. Furthermore, the exact change in overall proteins in the active MTrP regions (compared with healthy tissues) is still unknown, as is whether there are one or more particular proteins with key roles in dry needling-induced inactivation of MTrPs. As there is a complex and precise regulation system underlying the biological processes of MTrPs in myofascial pain, cross-talk between several proteins and signaling pathways may be involved. Therefore, it is difficult to entirely explain the pathogenic mechanism based on a single protein or single pathway, especially as there is a lack of related data from previous studies. Mass spectrometry (MS)-based proteomics technology has emerged as a powerful method to identify large-scale sets of proteins involved in many health conditions and treatments, including in pain control. Proteomics techniques may reveal novel diagnostic and therapeutic targets as well as potential biomarkers.21
Taken together, this study aimed to discover the potential pathogenesis of myofascial pain and the therapeutic mechanism underlying dry needling treatment at the molecular level based on proteomics technology, using an in vivo rat model of MTrPs.
Materials and methods
Modeling of MTrPs
A total of 48 male Sprague Dawley rats (220–250 g) (Shanghai Jiesijie Experimental Animal Co., Ltd, Shanghai, China) were housed in groups of three to five in a specific pathogen-free (SPF) animal experimental laboratory room under a 12-hour light/dark cycle. The rats were randomly divided into four groups using a web-based random number generator (GraphPad software) (n=12 in each group): a control group (CG), an MG, a dry needling of MTrPs group (DG), and a dry needling of non-MTrPs group (NDG). The rats in the CG group were fed as usual without any intervention. In the MG, DG, and NDG groups, the model of active MTrPs was established by blunt striking on the left gastrocnemius muscle and eccentric-based exercise for a period of 8 weeks, followed by a 4-week recovery period. The left gastrocnemius muscle of each rat was marked and, on the first day of each week, the muscle was hit at the marked position using a hand-made stick device dropped once from a height of 20 cm with a kinetic energy of 2.352 J to induce muscle contusion. The rats were then made to run on a DSPT-202 treadmill (Duanshi Co., Hangzhou, China) for 1.5 hours at a –16° downward angle, and a speed of 16 m/min, on the second day of each week.
In our study, the diagnostic criteria for active MTrPs were as follows: 1) tender spot in a palpable taut band; 2) elicitation of a local twitch response (LTR) by palpation of or needle insertion into the tender spot; 3) SEA features involving intermittent higher-amplitude spike-like activity of 100–700 mV and low-amplitude persistent activity of 50 mV.9 Specifically, a contracture nodule in a taut band was palpated and marked. An electrode needle was then inserted into the marked nodule. If LTRs were found to be elicited by needling, the marked nodule was considered as a possible active MTrP. Second, for confirmation, an EMG device with bipolar electrodes (Z2J-NB-NCC08, NCC Medical Co., Ltd, Shanghai, China) was used to verify the potential MTrP.13 The first needle was maintained in situ as one electrode and a second fine needle was longitudinally inserted 3–5 mm away from the first as a reference electrode. If SEAs were recorded in 60 seconds, the model of MTrP was considered to be successful.
The flowchart of the experimental design and procedures is shown in Figure 1. All animal experiments were conducted at the Laboratory Animal Center of Shanghai University of Sport, China. The study was approved by the Ethics Committee of Shanghai University of Sport. The animal experiments complied with the ARRIVE (Animal Research: Reporting of In Vivo Experiments) guidelines and were carried out in accordance with the UK Animals (Scientific Procedures) Act, 1986, and associated guidelines.
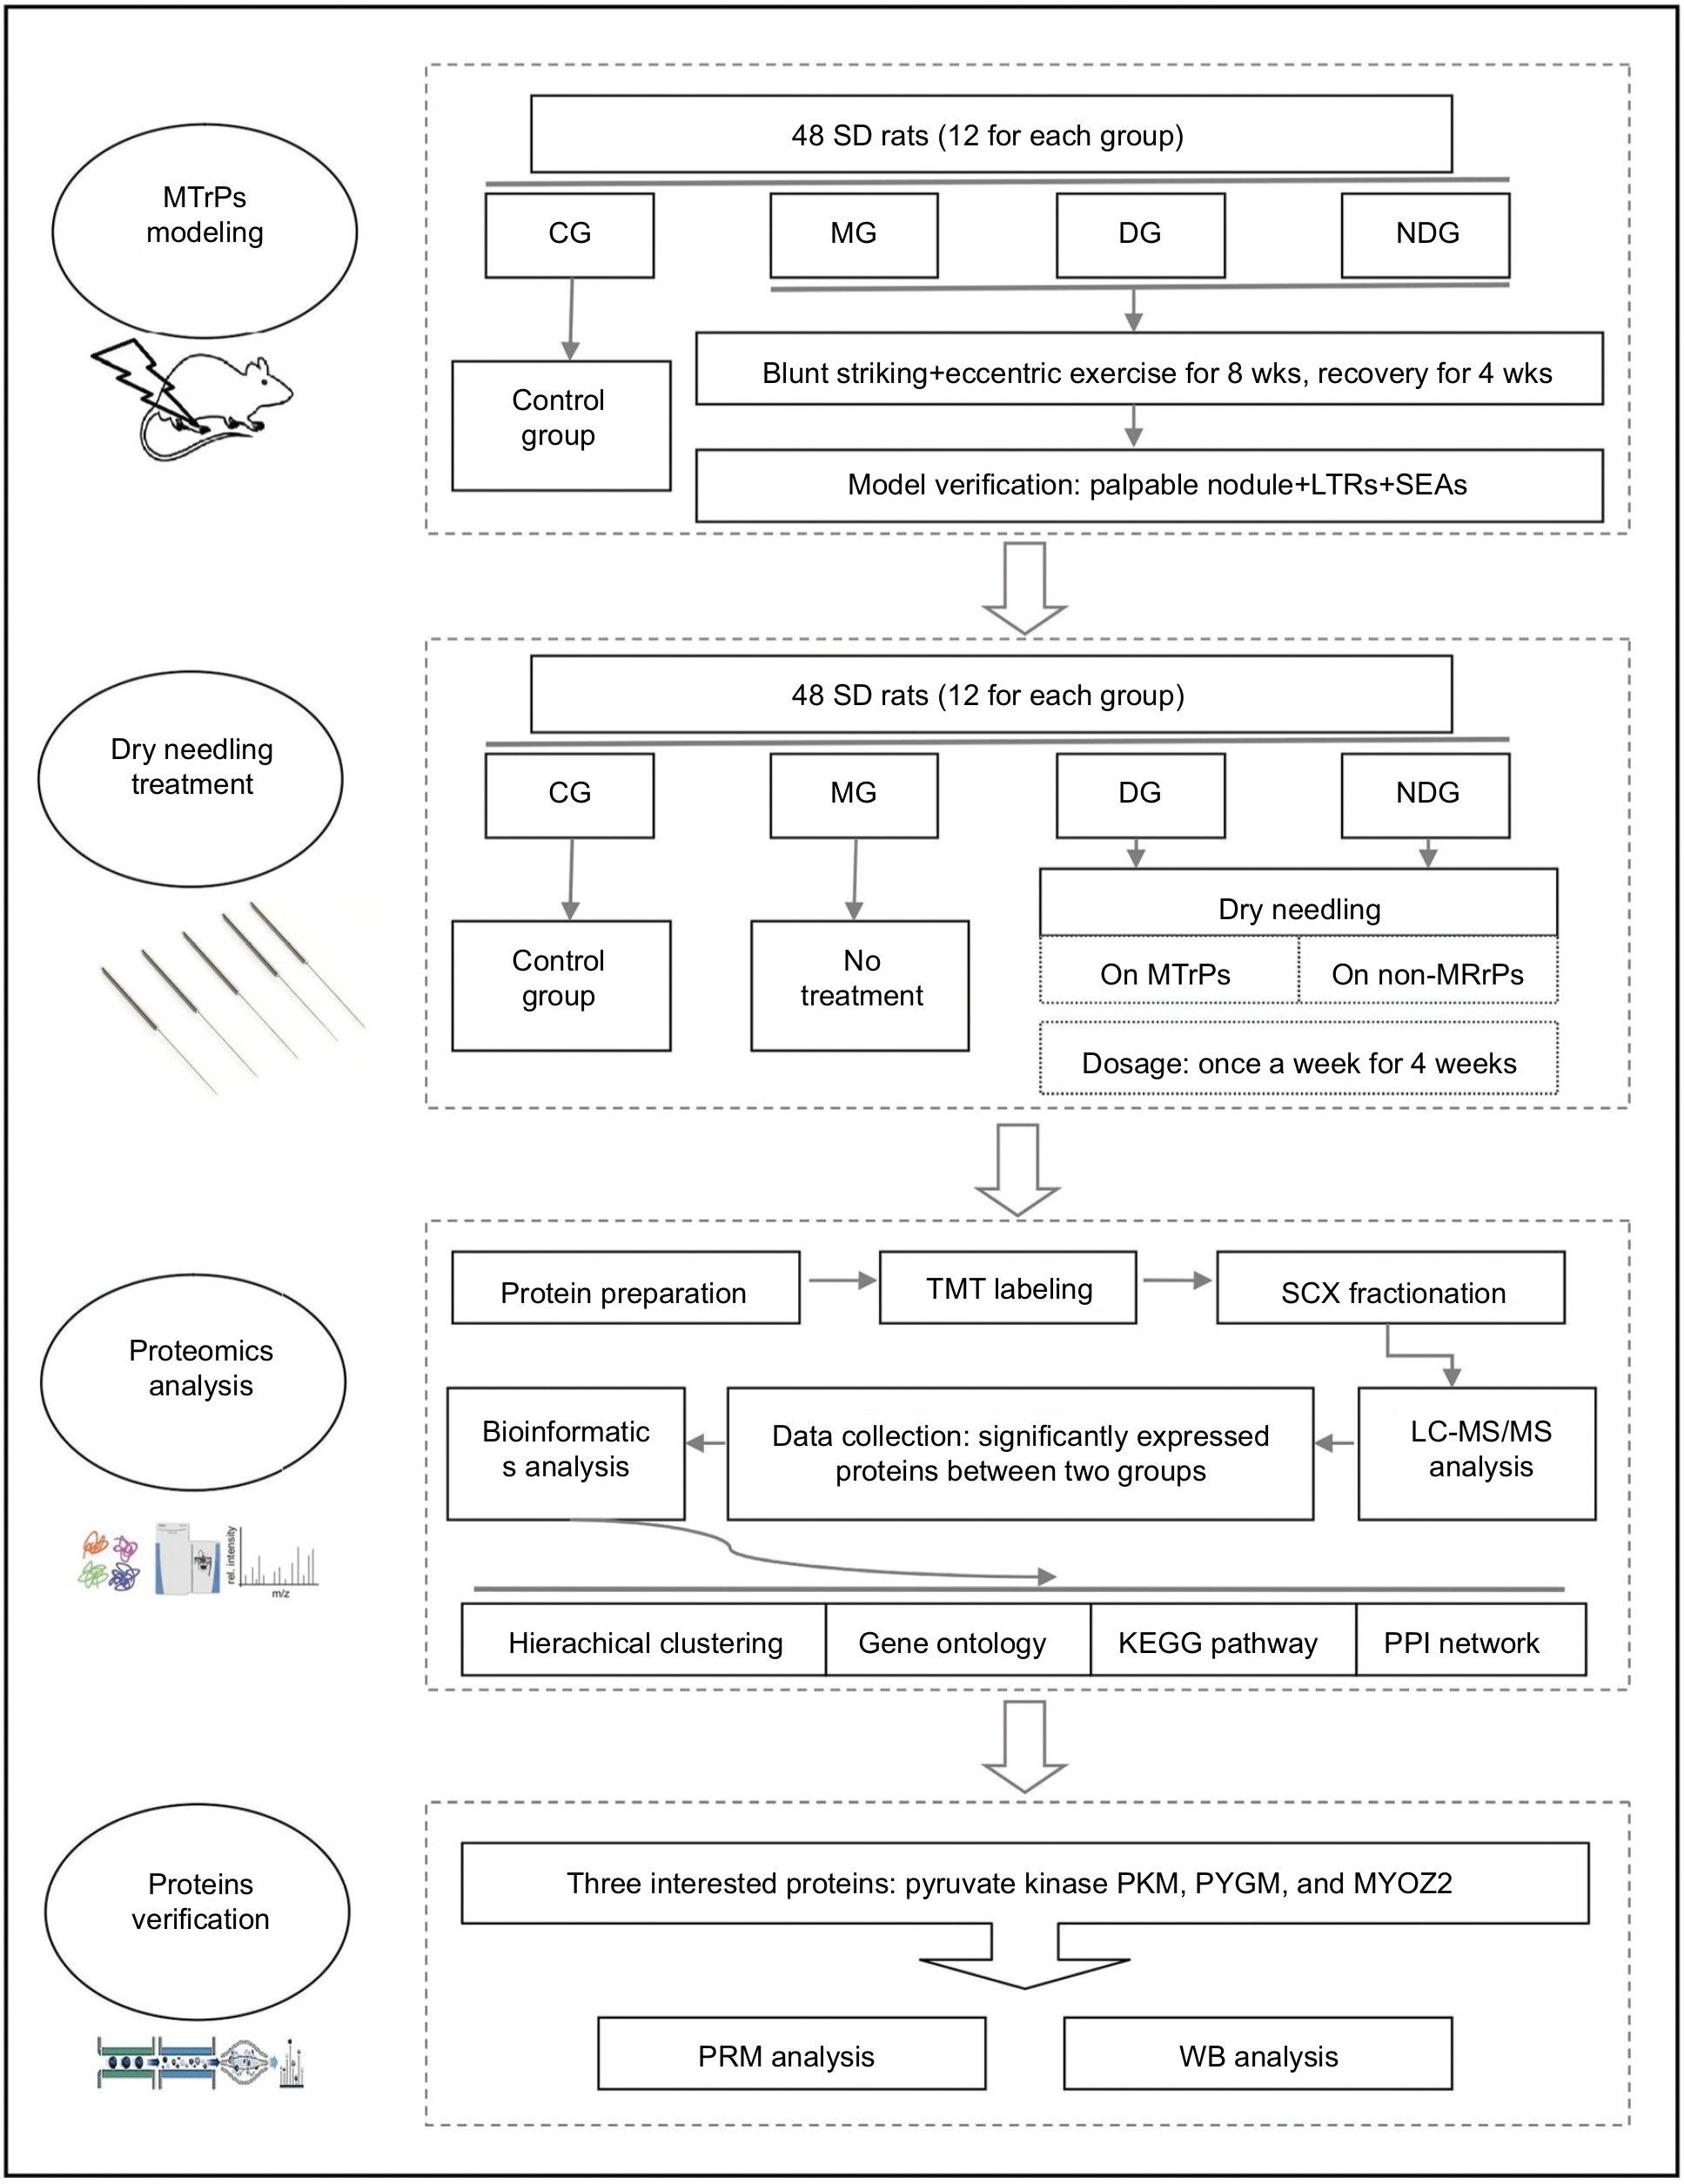 | Figure 1 Flowchart showing the experimental design and procedures. Abbreviations: CG, control group; DG, dry needling of MTrPs group; KEGG, Kyoto Encyclopedia of Genes and Genomes; LC-MS/MS, liquid chromatography-tandem mass spectrometry; LTR, local twitch response; MG, model group; MTrPs, myofascial trigger points; NDG, dry needling of non-MTrPs group; PPI, protein–protein interaction; PRM, parallel reaction monitoring; SEA, spontaneous electrical activity; TMT, tandem mass tag; WB, Western Blot; |
Dry needling treatment
Dry needling of MTrPs or non-MTrP regions was carried out in the DG and NDG groups, respectively, once a week for 4 weeks. All rats were fixed on a board. In the DG group, a fine needle (Ф 0.3 mm) was rapidly inserted and withdrawn in and out precisely at each gastrocnemius muscle MTrP to obtain no less than six LTRs.22 In the NDG group, the needle was inserted 1 cm away from each MTrP (MTrPs “neighborhood”) and withdrawn in and out six times with no LTRs. If there was an LTR elicited by accident when the needle was just inserted into the muscle of some rats in the NDG group, we slightly adjusted the direction of the needle; in these cases, no more LTRs were elicited. The rats in the CG and MG groups did not undergo dry needling.
Proteomics analysis
The steps for protein preparation and TMT labeling have been submitted to the protocols.io repository with the following doi: dx.doi.org/10.17504/protocols.io.upjevkn. After TMT labeling, liquid chromatography-tandem mass spectrometry (LC-MS/MS) analysis was performed. The fractionated peptide mixture was placed onto a reversed-phase trap column, 100 µm×2 cm (nano Viper C18) (Thermo Fisher Scientific, Waltham, MA, USA) coupled with a C18 reversed-phase analytical column with an inner diameter of 75 µm, a length of 10 cm, and 3 µm of resin (Thermo Fisher Scientific) in 0.1% formic acid buffer. The mixture was separated with a linear gradient of buffer containing 0.1% formic acid and 84% acetonitrile. The flow rate was controlled at 300 mL/min using IntelliFlow Technology (Thermo Fisher Scientific).
A quadrupole Q-Exactive mass spectrometer coupled Easy LLC (Thermo Fisher Scientific) was used to perform the LC-MS/MS analysis and the duration was set to 60 minutes. The instrument was run under the peptide recognition enablement mode. A data-dependent Top20 method was used to acquire the MS data. The most abundant precursor ions for higher energy collisional dissociation (HCD) fragmentation were dynamically selected from the survey scan at a speed of 300–1,800 m/z. The dynamic exclusion duration was set to 40 s, the maximum injection time was 10 ms, and the automatic gain control target was 3×10⁶. The HCD spectrum resolution was set to 17,500 at 200 m/z (isolation width 2 m/z, TMT 4-plex) and the resolution for survey scans was 70,000 at 200 m/z. The under fill ratio was defined as 0.1% and the normalized collision energy was set to 30 eV.
MASCOT search engine version 2.2 (Matrix Science, London, UK) with Proteome Discoverer 1.4 was used to search the MS/MS spectra. Filtered MS/MS spectra were searched against the UniProtKB Rattus norvegicus decoy database, including both regular and reversed protein sequences for false-positive rate estimation. Various parameters were set, including a peptide mass tolerance of ±20 ppm, variable modifications of oxidation (M), a fragment mass tolerance of 0.1 Da, decoy as the database pattern, and a peptide false discovery rate of ≤0.01. The protein ratios were calculated as the median of only unique peptides of each protein. Experimental bias was performed to normalize all peptide ratios based on the median protein ratio. The T median protein ratio was required to be 1 after normalization. Proteins with significant differences in expression between pairs of groups and with expression ratio thresholds of ≥1.2-fold increase or ≤0.83-fold decrease were identified. A bioinformatics analysis based on the results of the LC-MS/MS analysis between the CG and MG groups and the MG and DG groups was performed. The detailed information on the bioinformatics analysis has been submitted to the protocols.io repository with the following doi: dx.doi.org/10.17504/protocols.io.upievke.
Verification of protein expression changes by parallel reaction monitoring (PRM) and Western blot analysis
To verify the results of the TMT analysis coupled with LC-MS/MS, first, PRM was performed among all proteins with differential abundance under in group (without pooling). Three proteins of interest were identified, namely, the pyruvate kinase muscle isozyme (encoded by the PKM gene), the muscle isoform of glycogen phosphorylase (encoded by the PYGM gene), and myozenin 2 (encoded by the MYOZ2 gene). The remaining sample of the TMT proteome was used for direct enzymatic hydrolysis. The steps for verification of protein expression changes by PRM have been submitted to the protocols.io repository with the following doi: dx.doi.org/10.17504/protocols.io.upvevn6.
Second, to further verify the results of the TMT analysis coupled with LC-MS/MS, the same three proteins of interest as for PRM were selected to perform a Western blot analysis. This involved using 20–30 µg of proteins extracted with RIPA buffer. The proteins were analyzed by SDS-PAGE and transferred to a nitrocellulose membrane. Subsequently, 3%–5% dried skimmed milk powder was used to block the membranes for 1 hour, followed by overnight incubation at 4°C with primary antibodies against pyruvate kinase PKM (1:2,000) (ProteinTech Inc., Chicago, IL), MYOZ2 (1:1,000) (ProteinTech Inc.), PYGM (1:1,500) (Abcam, Cambridge, UK), and glyceraldehyde-3-phosphate dehydrogenase (GAPDH) (1:2,000) (Abcam). The membranes were then incubated for 1 hour at room temperature with secondary antibodies (1:2,000) (The Jackson Laboratory, Mount Desert Island, USA) labeled with horseradish peroxidase. Relative protein levels were normalized to GAPDH, which was used as a loading control for total protein. An enhanced chemiluminescence detection system was used for blot visualization, and an ImageQuant image analysis system was used for protein quantification.
Statistical analyses
Proteomics analysis was performed in triplicate (similar results were obtained for at least three separate experiments), and the mean values were calculated. Statistical analysis was performed with SPSS Statistics version 20.0 (IBM Corporation, Armonk, NY) and GraphPad Prism software version 6.0. The data were presented as the mean±SD. Student’s t-test and one-way ANOVA were used to analyze quantitative variables and a P-value <0.05 was considered to be statistically significant. Gene ontology (GO) and Kyoto Encyclopedia of Genes and Genomes (KEGG) pathway enrichment analyses were carried out using Fisher’s exact test, using the entire quantified protein annotations as the background dataset. To adjust derived P-values, the Benjamini–Hochberg correction was applied for multiple testing. Only categories and pathways with P-values <0.05 were considered statistically significant.
Results
Overall number of differentially expressed proteins
A total of 2,635 proteins were identified and quantified overall via TMT coupled with LC-MS/MS. The overall number of identified proteins in the three biological replicates is shown in Figure 2A. The number of distinct peptide sequences was also assessed in our study (Figure 2B). Of these proteins, 180 (up =75; down =105) were differentially expressed between the CG and MG groups, 158 (up =86; down =72) were differentially expressed between the DG and MG groups, and 93 (up =62; down =31) were differentially expressed between the NDG and MG groups.
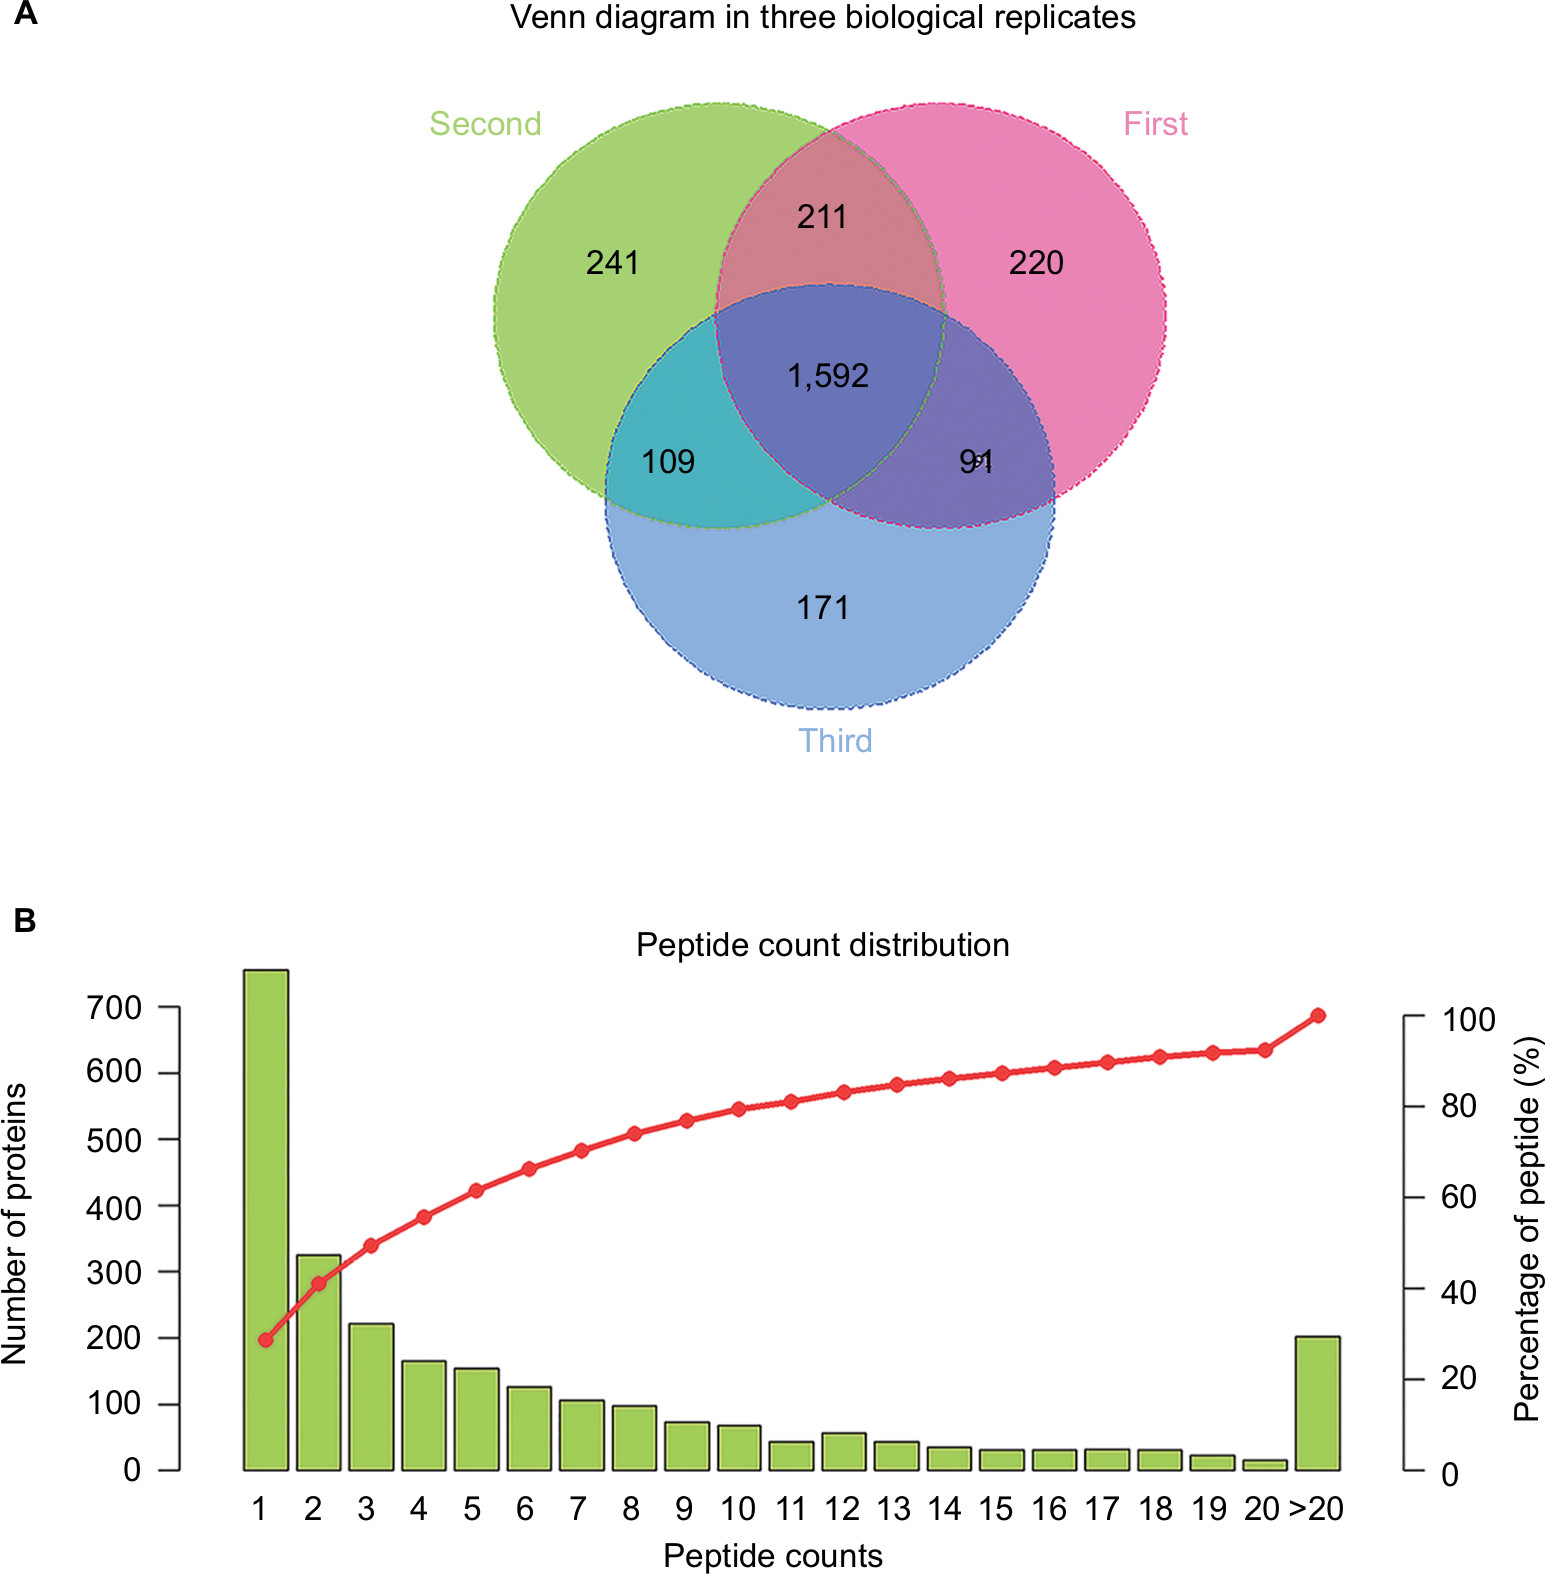 | Figure 2 Number of identified proteins and peptide count distribution. Notes: (A) Venn diagram of identified proteins in three biological replicates. (B) Peptide count distribution of identified proteins. |
Hierarchical clustering
Hierarchical clustering analysis was performed according to the significantly differentially expressed proteins. The results showed that the selected proteins (which were significantly differentially expressed between groups) were well distinguished and accurately screened out, which provided better visualization of the overall proteome changes between the CG and MG groups (Figure 3), and the DG and MG groups (Figure 4). The relative expression levels are shown by the intensity of the color. Red, blue, or gray colors indicate a relative increase, decrease, or no quantitative information regarding protein content for a particular protein, respectively (in the rows).
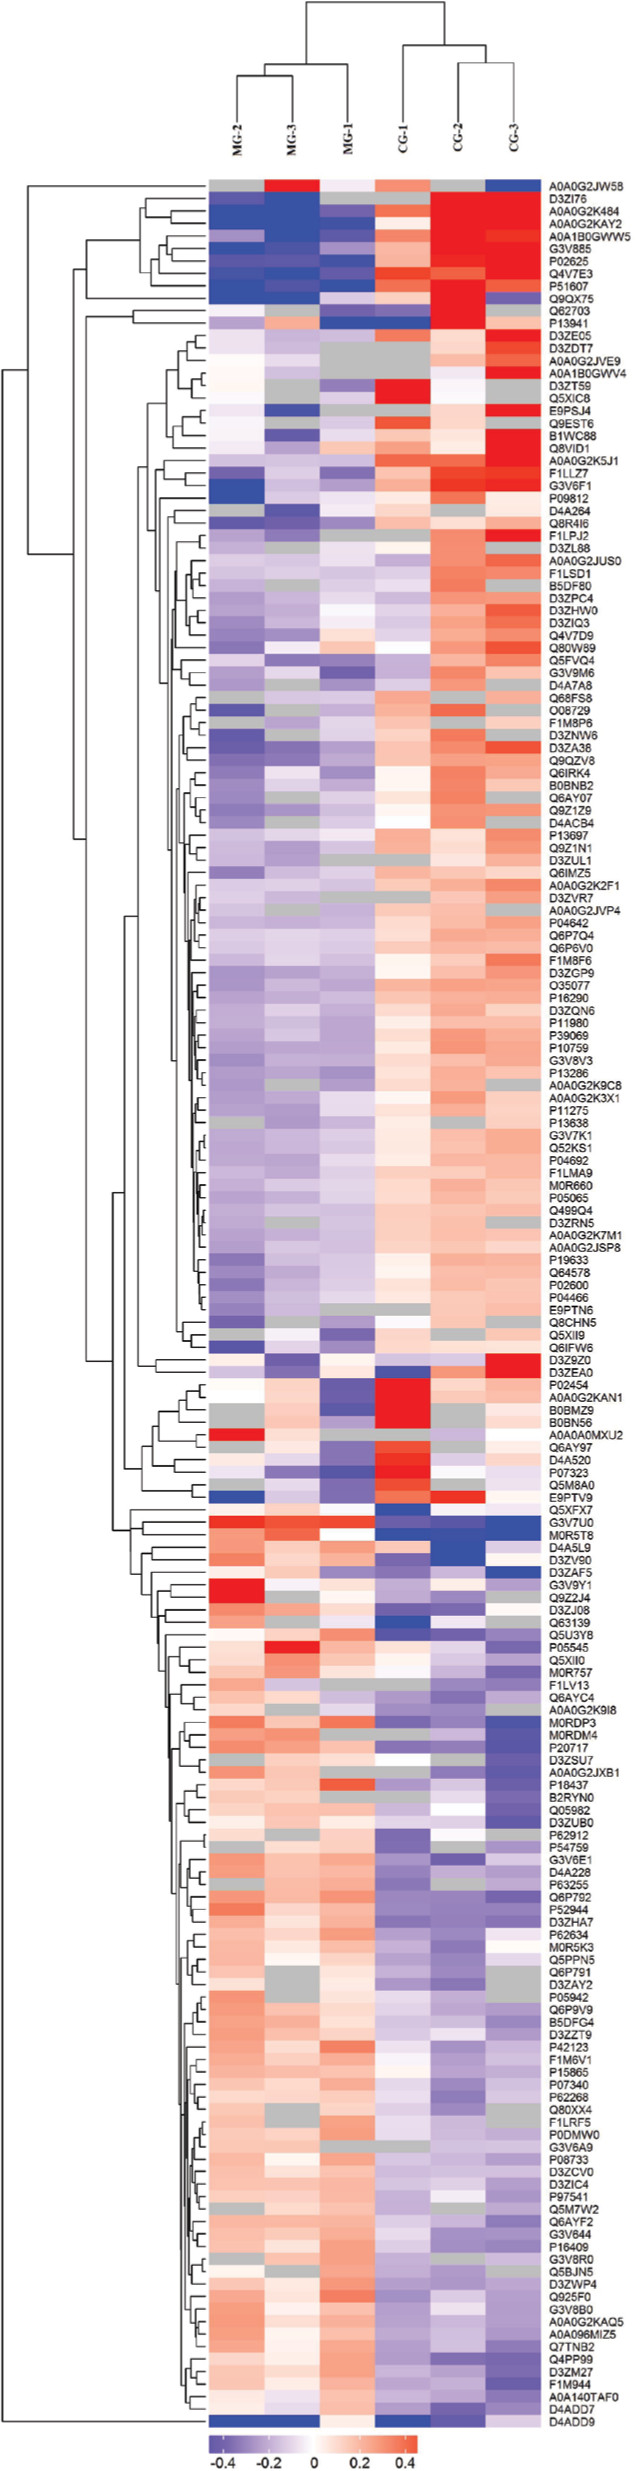 | Figure 3 Significantly differentially expressed proteins between the MG and CG groups were well distinguished using hierarchical clustering analysis. Notes: Each column represents one biological replicate (from left to right: columns 1–3 represent the MG group; columns 4–6 represent the CG group). Each row represents one significant protein (180 proteins were found to be significantly differentially expressed; upregulated=75, downregulated=105). Abbreviations: CG, control group; MG, model group. |
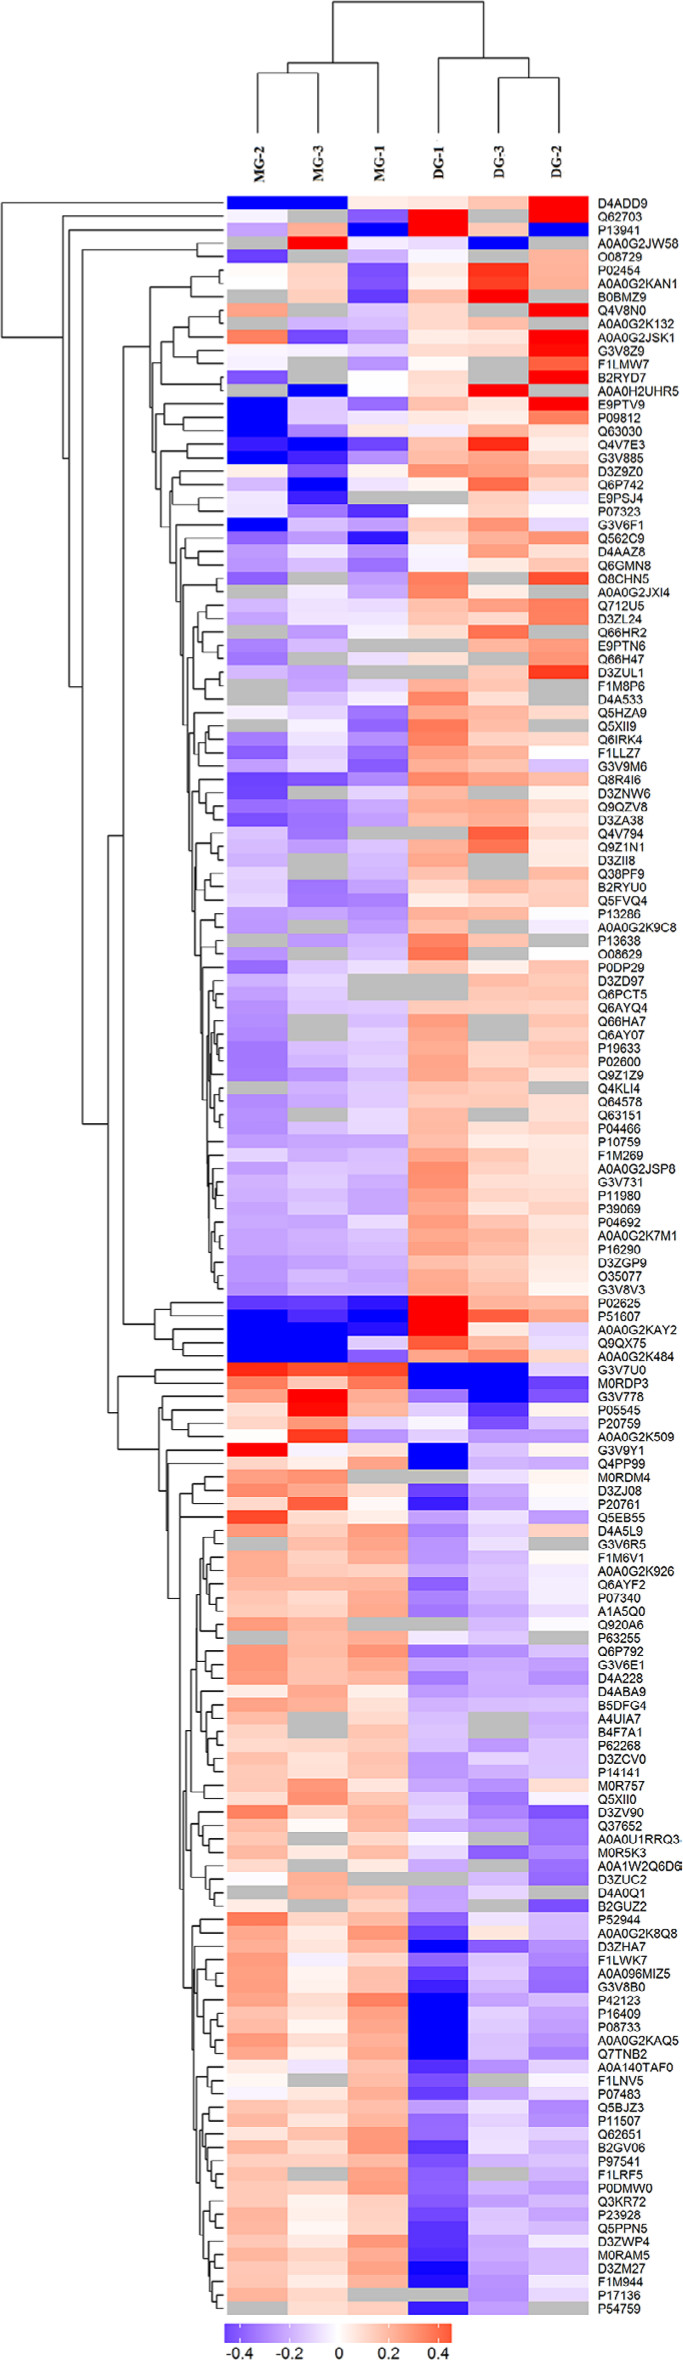 | Figure 4 Significantly differentially expressed proteins between the MG and DG groups were well distinguished using hierarchical clustering analysis. Notes: Each column represents one biological replicate (from left to right: columns 1–3 represent the MG group; columns 4–6 represent the DG group). Each row represents one significant protein (158 proteins were found to be significantly differentially expressed; upregulated=86, downregulated=72). Abbreviations: DG, dry needling of MTrPs group; MG, model group. |
GO functional annotation
As shown in Figures 5 and 6, the horizontal axis of the graph represents the three categories (biological process [BP], molecular function [MF], and cellular component [CC] categories), while the vertical axis represents the number of significant proteins. The colors of the bar charts represent the significant enrichment of the three categories. The color gradient from orange to red represents the P-value. The more intense the red color, the lower is the P-value and the greater is the degree of significance corresponding to the enrichment. Each number above the bar charts is the richFactor (richFactor ≤1), which is the ratio of the number of proteins that have been annotated in this category. In general, the richFactor is positively associated with the degree of enrichment.
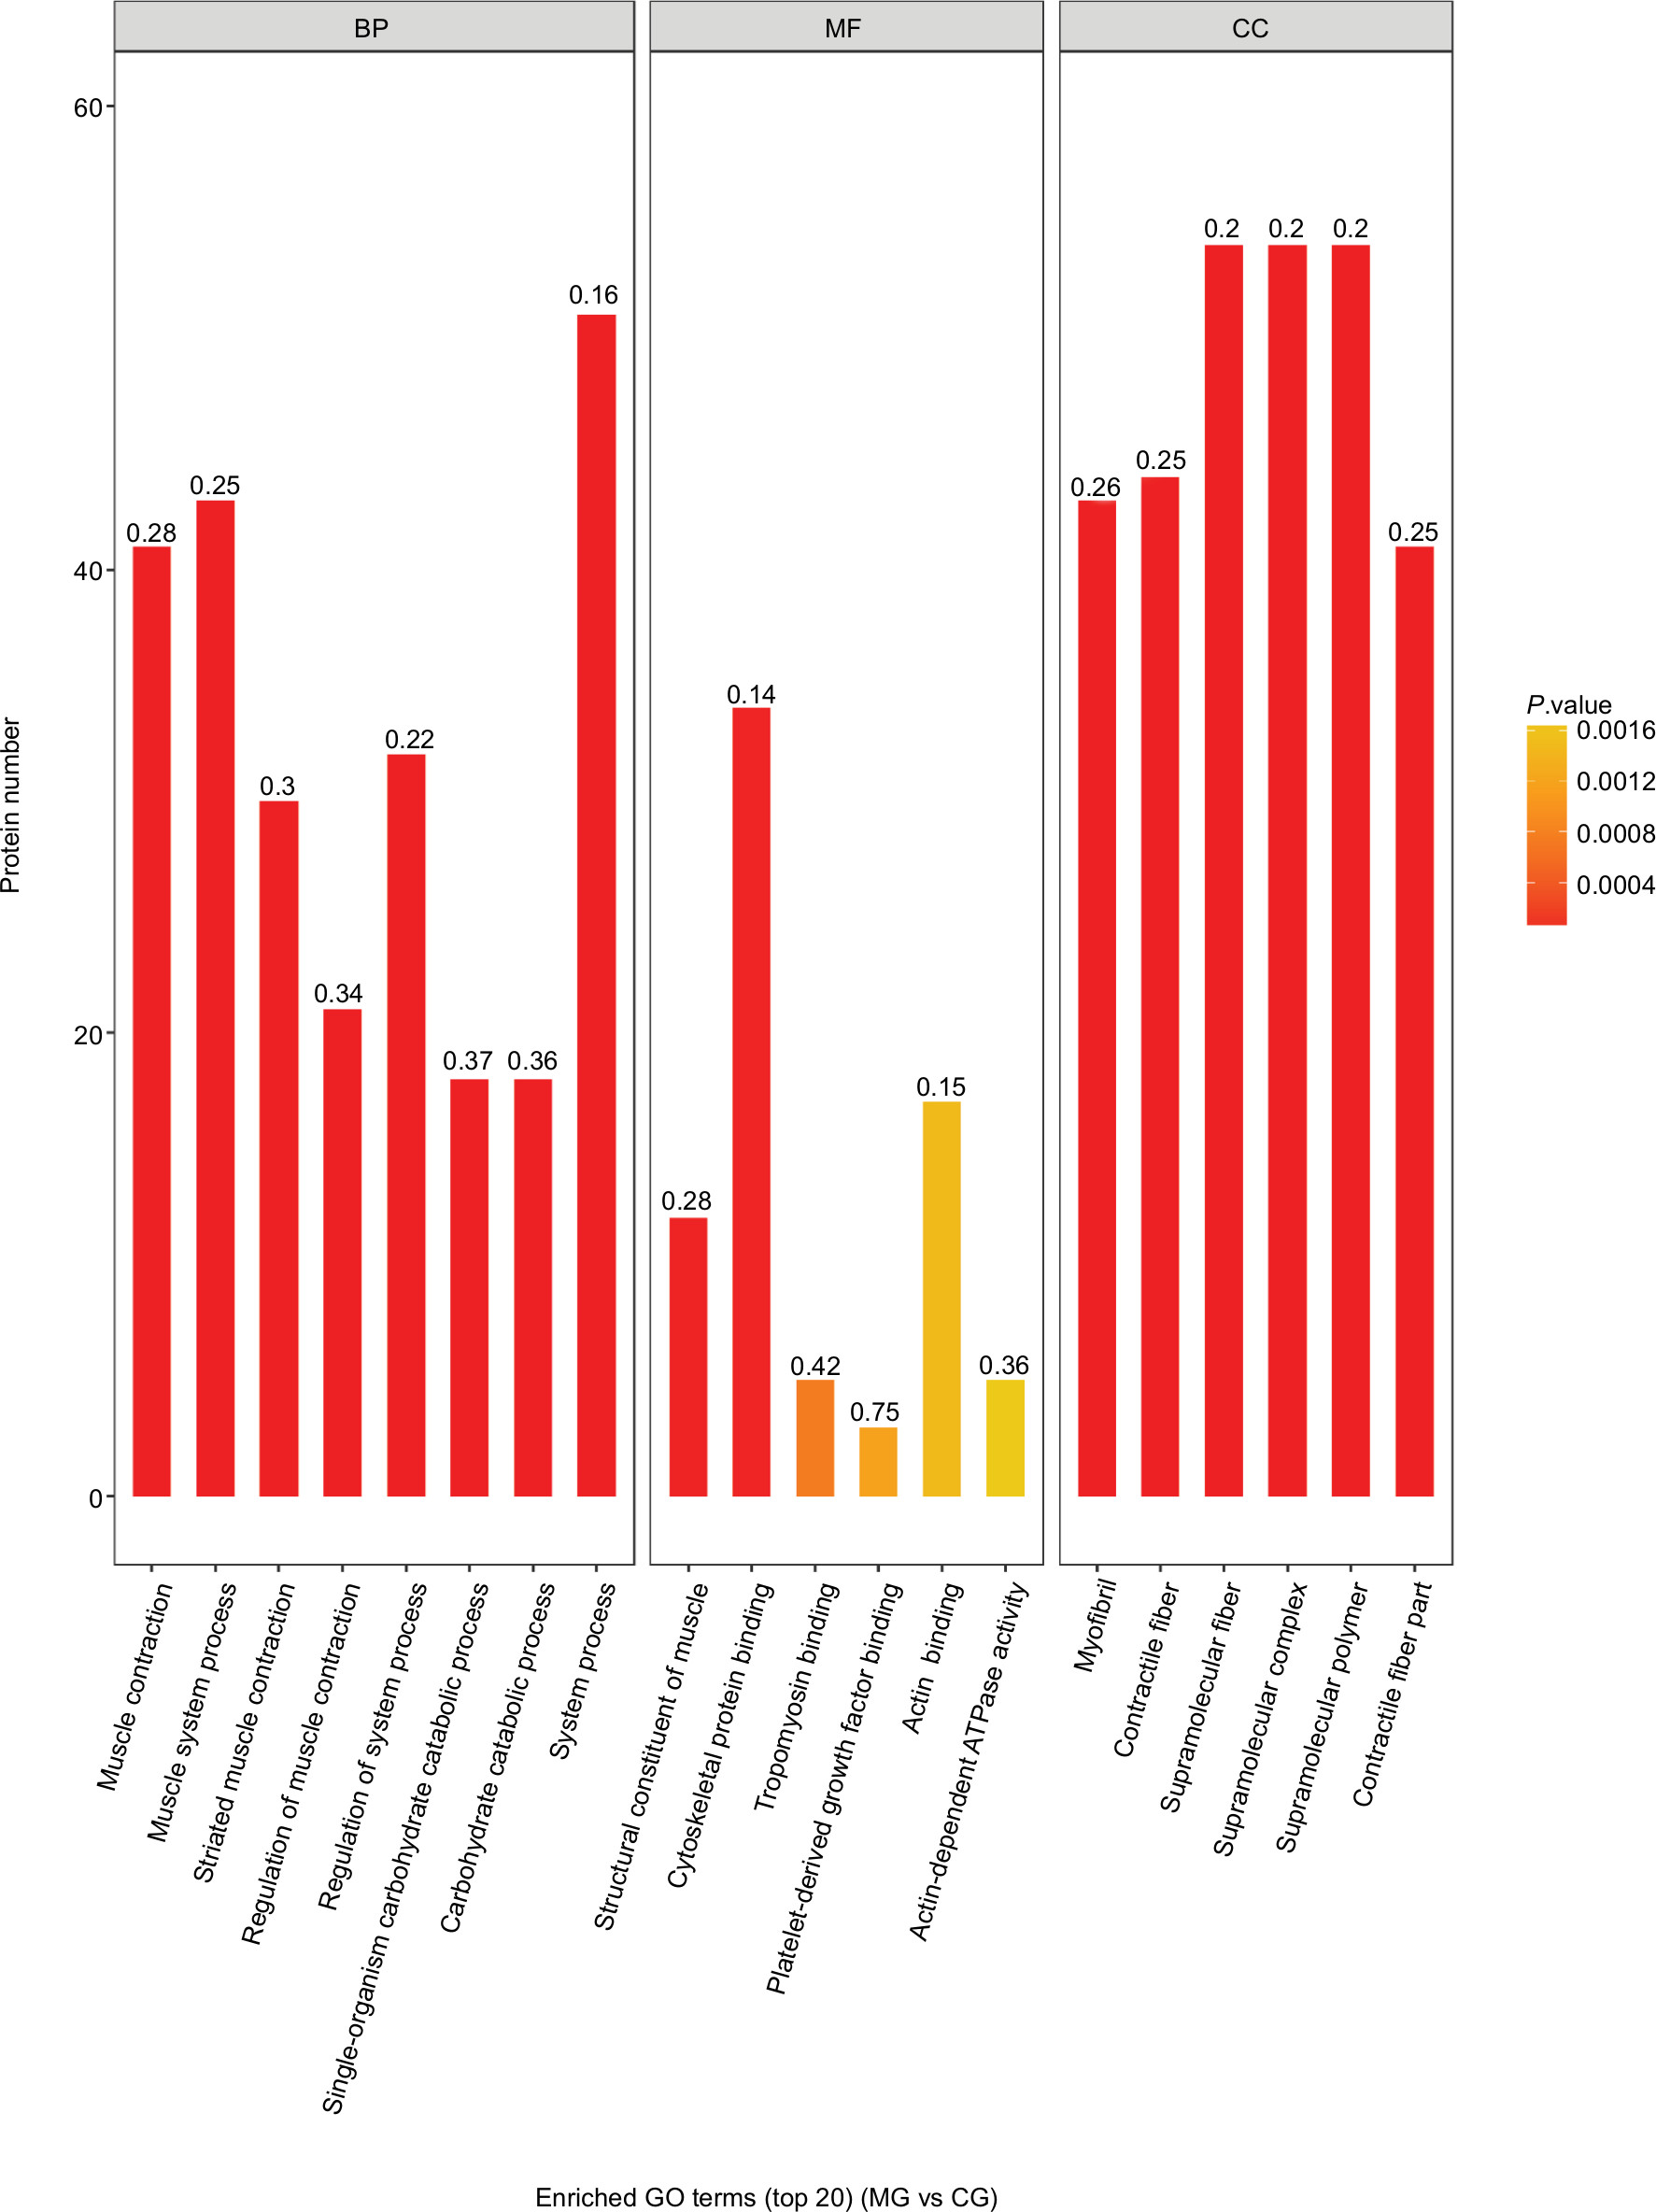 | Figure 5 Top 20 enriched GO terms of significantly differentially expressed proteins between the MG and CG groups. Notes: In terms of BP, the top three enriched categories were: system process proteins (51 proteins, richFactor =0.16), muscle system process proteins (43 proteins, richFactor =0.25), and muscle contraction proteins (41 proteins, richFactor =0.28). In terms of MF, the top three enriched categories were cytoskeletal protein binding (34 proteins, richFactor =0.14), action binding (17 proteins, richFactor =0.15), and structural constituent of muscle (12 proteins, richFactor =0.28). In terms of CC, the top three enriched categories were supramolecular fiber, supramolecular polymer, and supramolecular complex (54 proteins, richFactor =0.2, each). Abbreviations: BP, biological process; CC, cellular component; CG, control group; GO, gene ontology; MF, molecular function; MG, model group. |
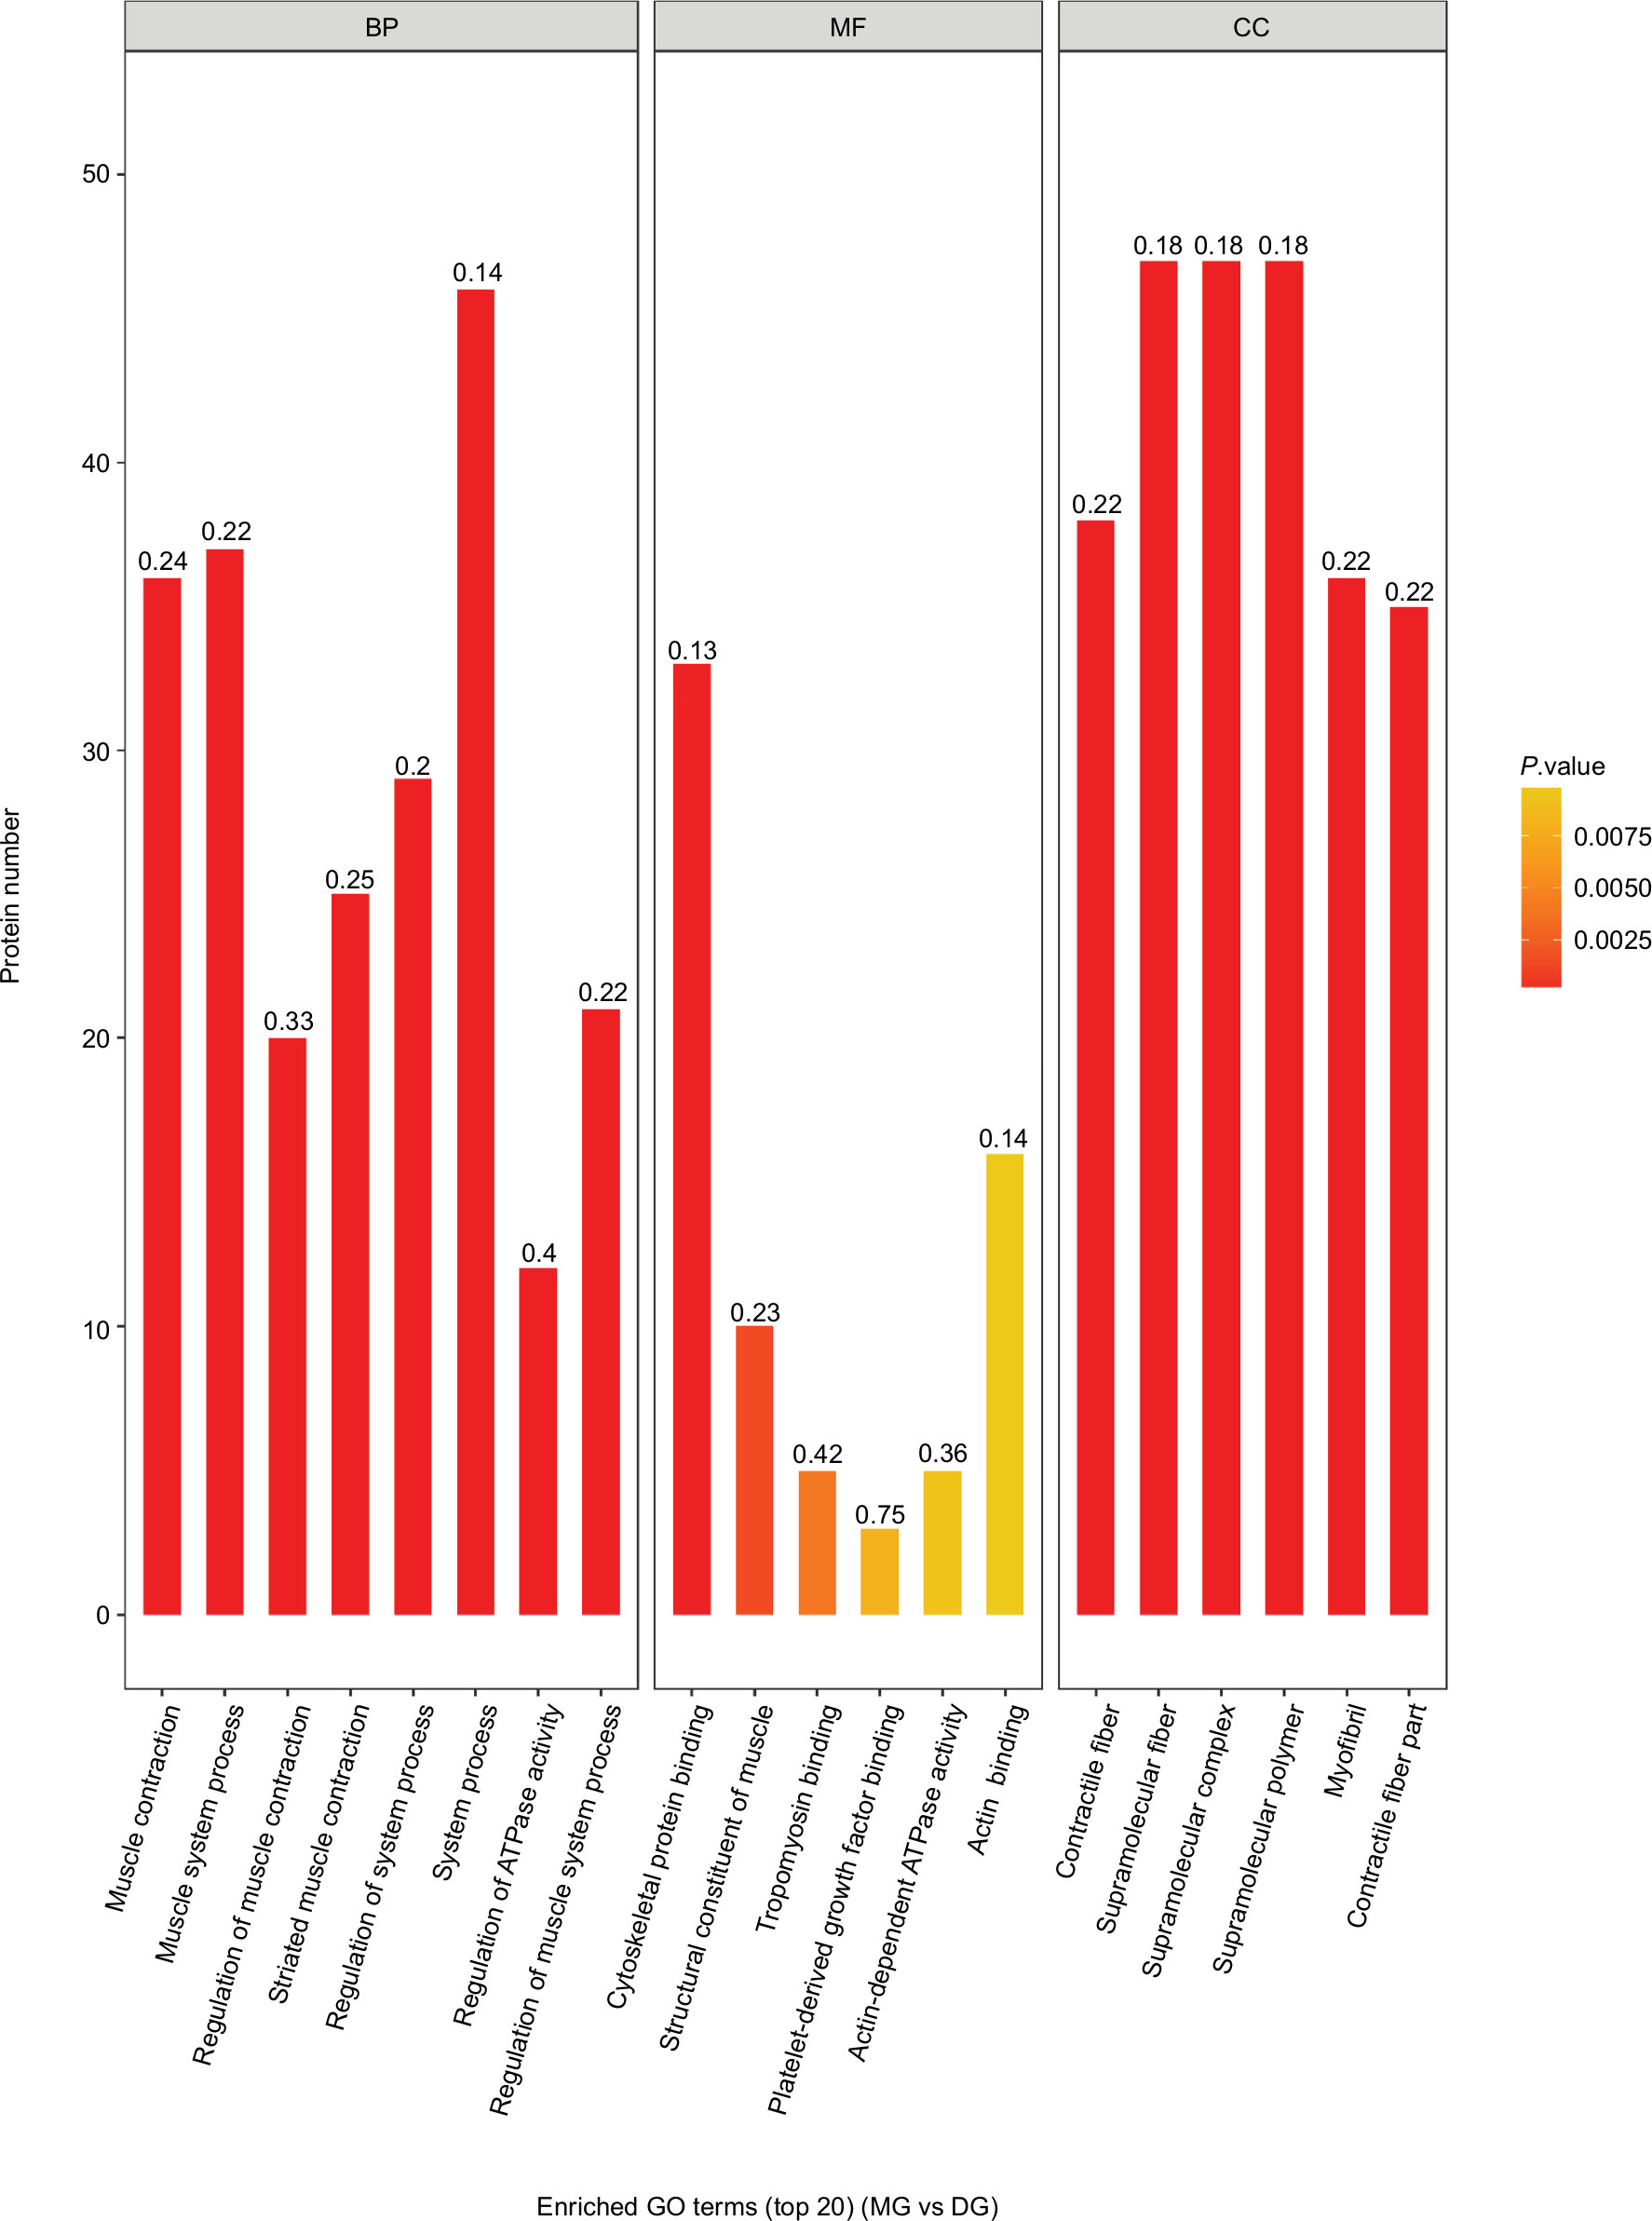 | Figure 6 Top 20 enriched GO terms of significantly differentially expressed proteins between the MG and DG groups. Notes: In terms of BP, the top three enriched categories were system process proteins (46 proteins, richFactor =0.14), muscle system process proteins (37 proteins, richFactor =0.22), and muscle contraction proteins (36 proteins, richFactor =0.24). In terms of MF, the top three enriched categories were cytoskeletal protein binding (33 proteins, richFactor =0.13), action binding (16 proteins, richFactor =0.14), and structural constituent of muscle (10 proteins, richFactor =0.23). In terms of CC, the top three enriched categories were supramolecular fiber, supramolecular polymer, and supramolecular complex (47 proteins, richFactor =0.18, each). Abbreviations: BP, biological process; CC, cellular component; DG, dry needling of MTrPs group; GO, gene ontology; MF, molecular function; MG, model group. |
Differentially expressed proteins between groups were further analyzed. The top three enriched BP categories were system process proteins (51 proteins, richFactor =0.16, CG/MG; 46 proteins, richFactor =0.14, DG/MG), muscle system process proteins (43 proteins, richFactor =0.25, CG/MG; 37 proteins, richFactor =0.22, DG/MG), and muscle contraction proteins (41 proteins, richFactor =0.28, CG/MG; 36 proteins, richFactor =0.24, DG/MG). The top three enriched MF categories were cytoskeletal protein binding (34 proteins, richFactor =0.14, CG/MG; 33 proteins, richFactor =0.13, DG/MG), action binding (17 proteins, richFactor =0.15, CG/MG; 16 proteins, richFactor =0.14, DG/MG), and structural constituent of muscle (12 proteins, richFactor =0.28, CG/MG; 10 proteins, richFactor =0.23, DG/MG). The top three enriched CC categories were supramolecular fiber, supramolecular polymer, and supramolecular complex (54 proteins, richFactor =0.2, CG/MG; 47 proteins, richFactor =0.18, DG/MG).
KEGG pathway analysis
As shown in Figures 7 and 8, the horizontal axis of the graph represents the enriched KEGG pathways, while the vertical axis represents the number of significant proteins. The colors of the bar charts represent the significance of the enrichment in the three categories. The color gradient from orange to red represents the P-value; the closer to the red color, the lower the P-value and the greater the degree of significance corresponding to the enrichment. Each number above the bar charts is the richFactor (richFactor ≤1), which is the ratio of the number of proteins annotated in each category. The results showed that the top three enriched pathways between the CG and MG groups were glycolysis/gluconeogenesis (15 proteins, richFactor =0.36), glucagon signaling pathway (12 proteins, richFactor =0.31), and hypoxia-inducible factor (HIF)–1 signaling pathway (11 proteins, richFactor =0.28) (Figure 7). The top four enriched pathways between the DG and MG groups were cardiac muscle contraction (14 proteins, richFactor =0.29), adrenergic signaling in cardiomyocytes (11 proteins, richFactor =0.22), glycolysis/gluconeogenesis (nine proteins, richFactor =0.21), and glucagon signaling pathway (nine proteins, richFactor =0.23) (Figure 8).
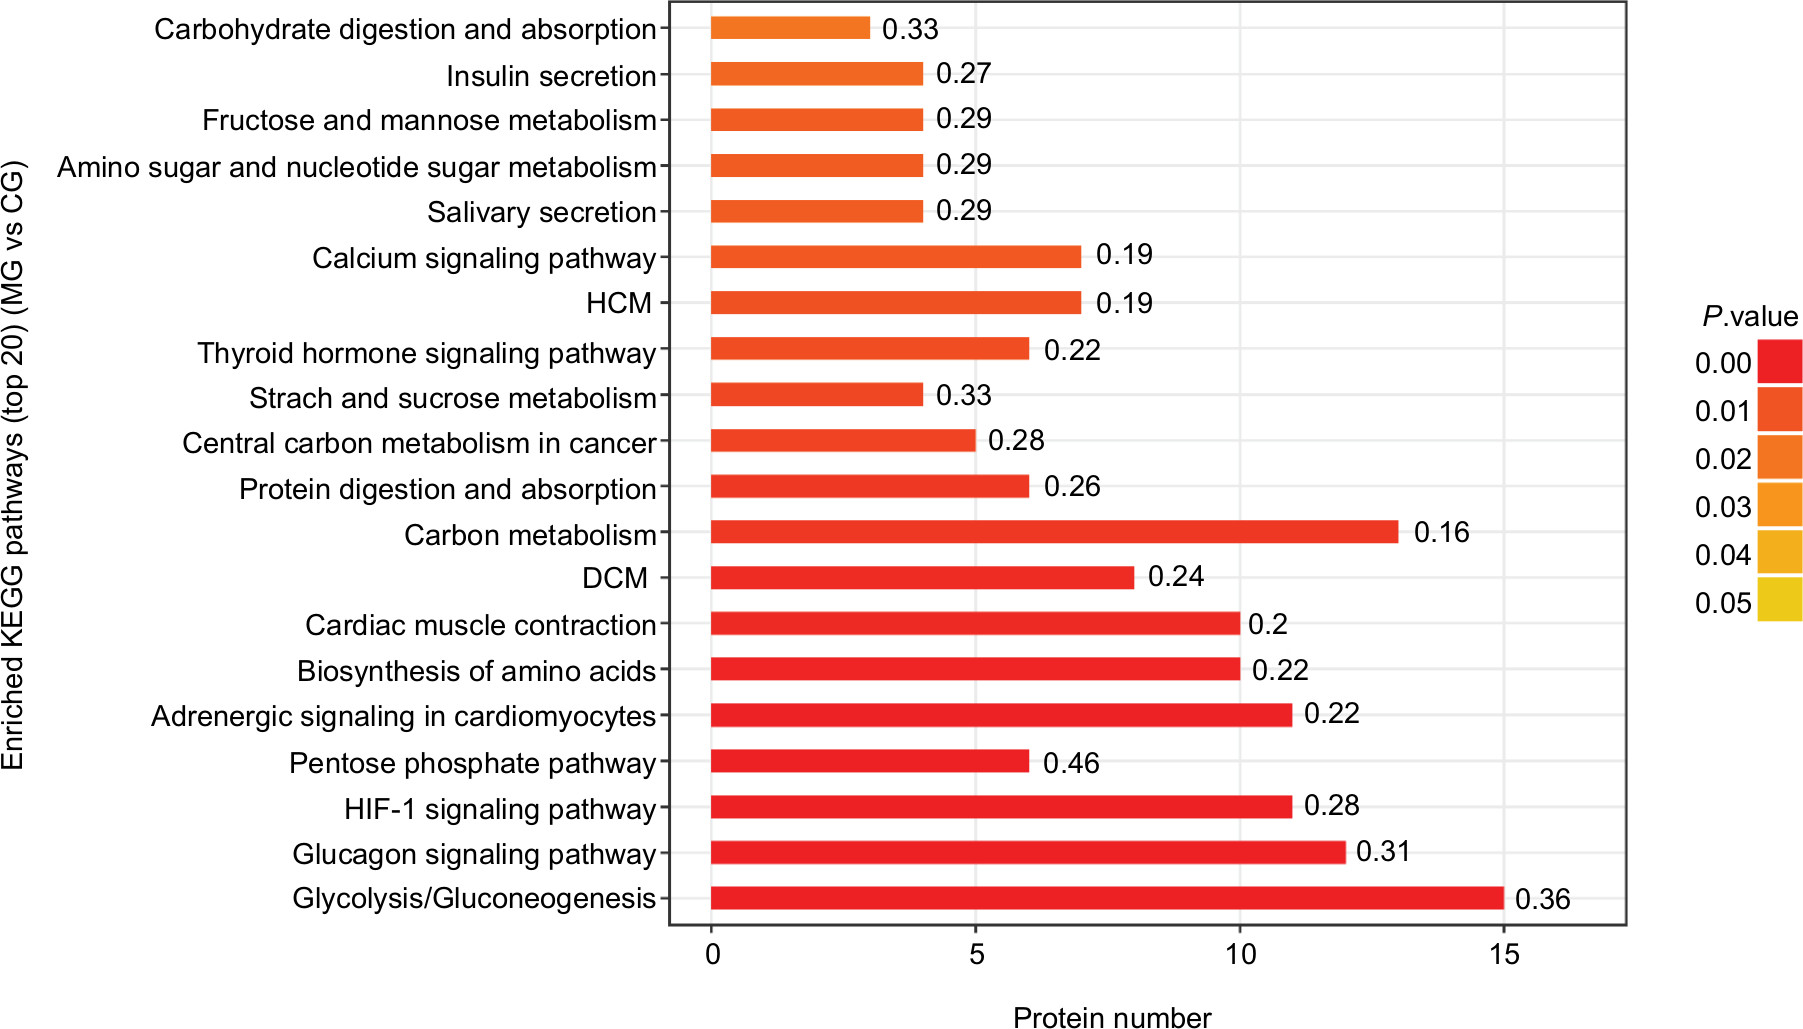 | Figure 7 Top 20 enriched KEGG pathways of significantly differentially expressed proteins between the MG and CG groups. Notes: The top three enriched pathways were glycolysis/gluconeogenesis (15 proteins, richFactor =0.36), the glucagon signaling pathway (15 proteins, richFactor =0.31), and the HIF-1 signaling pathway (11 proteins, richFactor =0.28). Abbreviations: CG, control group; DCM, dilated cardiomyopathy; DG, dry needling of MTrPs group; HCM, hypertrophic myopathy; HIF, hypoxia-inducible factor; KEGG, Kyoto Encyclopedia of Genes and Genomes; MG, model group. |
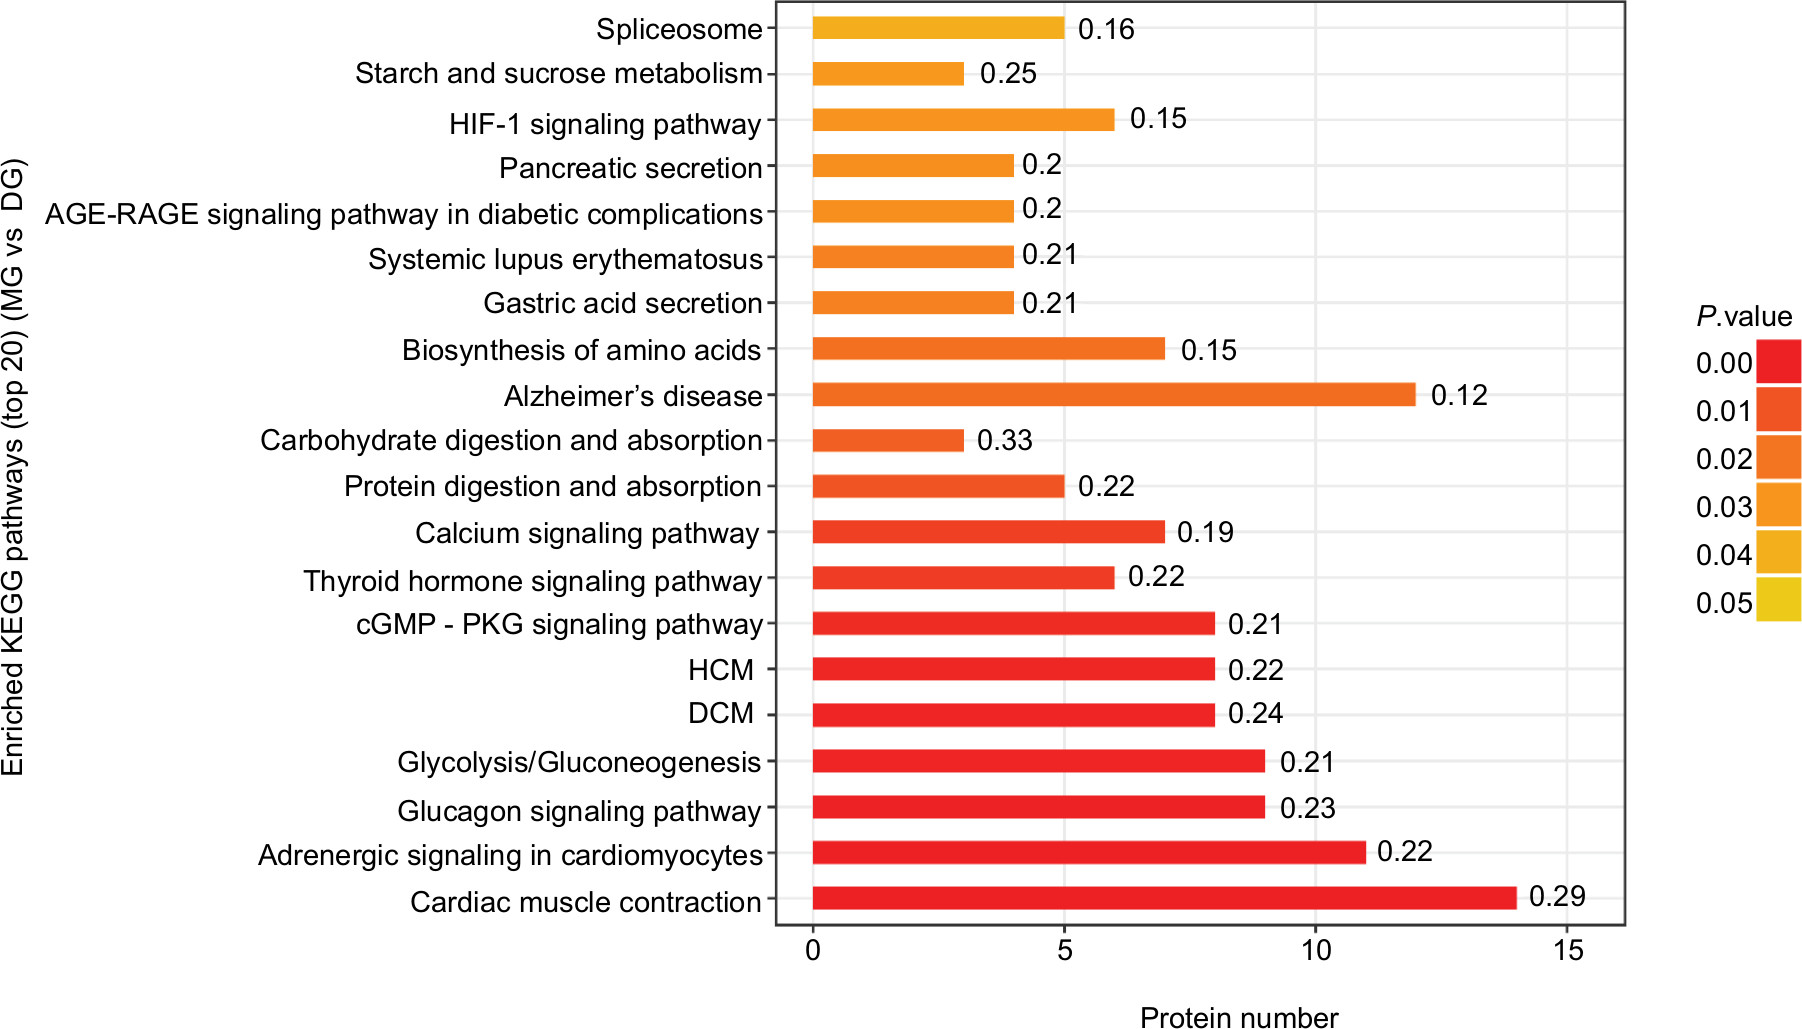 | Figure 8 Top 20 enriched KEGG pathways of significantly differentially expressed proteins between the MG and DG groups. Notes: The top four enriched pathways were cardiac muscle contraction (14 proteins, richFactor =0.29), adrenergic signaling in cardiomyocytes (11 proteins, richFactor =0.22), glycolysis/gluconeogenesis (nine proteins, richFactor =0.21), and the glucagon signaling pathway (nine proteins, richFactor =0.23). Abbreviations: DCM, dilated cardiomyopathy; DG, dry needling of MTrPs group; HCM, hypertrophic myopathy; HIF, hypoxia-inducible factor; KEGG, Kyoto Encyclopedia of Genes and Genomes; MG, model group. |
Protein–protein interaction (PPI) network
Proteins do not exist independently in vivo, as their functions are associated with, or regulated by, other proteins. Therefore, we performed a network analysis of the target proteins using PPI. The lead proteins (which are differentially expressed between the CG and MG groups) with a high degree of connectivity in the PPI network are shown as red nodes in Figure 9. Pyruvate kinase PKM (UniProtKB-P11980) had the highest connectivity degree, interacting and connecting with 18 significantly differentially expressed proteins. The other four lead proteins were fructose-bisphosphate aldolase A (UniProtKB-P05065; connectivity degree: 16 proteins), fructose-bisphosphate aldolase (UniProtKB-Q6AY07; connectivity degree: 16 proteins), troponin I type 2 (UniProtKB-A0A0G2K3X1; connectivity degree: 14 proteins), and actin alpha (UniProtKB-D3ZCV0; connectivity degree: 14 proteins).
 | Figure 9 Top five important node proteins (marked in red) in the PPI network that are significantly differentially expressed between the CG and MG groups. Notes: Pyruvate kinase PKM (UniProtKB-P11980; connectivity degree: 18 proteins), fructose-bisphosphate aldolase A (UniProtKB-P05065; connectivity degree: 16 proteins), fructose-bisphosphate aldolase (UniProtKB-Q6AY07; connectivity degree: 16 proteins), troponin I type 2 (UniProtKB-A0A0G2K3X1; connectivity degree: 14 proteins), and actin alpha (UniProtKB-D3ZCV0; connectivity degree: 14 proteins). Abbreviations: CG, control group; MG, model group; PPI, protein–protein interaction. |
PRM and Western blot validation
Three differentially expressed proteins (pyruvate kinase PKM, PYGM, and MYOZ2) were selected to verify the TMT-based proteomics data using PRM. The PRM results showed that the three candidate proteins showed similar trends as in the TMT data, which supported the credibility and reliability of the proteomics data (Figure 10). Consistent with the PRM results, compared with the CG group, the protein expression of pyruvate kinase PKM and PYGM decreased significantly in the MG group. However, also consistent with the PRM results, MYOZ2 significantly increased. After dry needling of MTrPs (DG group), the three proteins returned to almost normal levels (as in the CG group), which were significantly different from the levels in the MG group. However, there were no significant changes in the three protein levels between the NDG group (dry needling non-MTrPs) and the MG group (Figure 11).
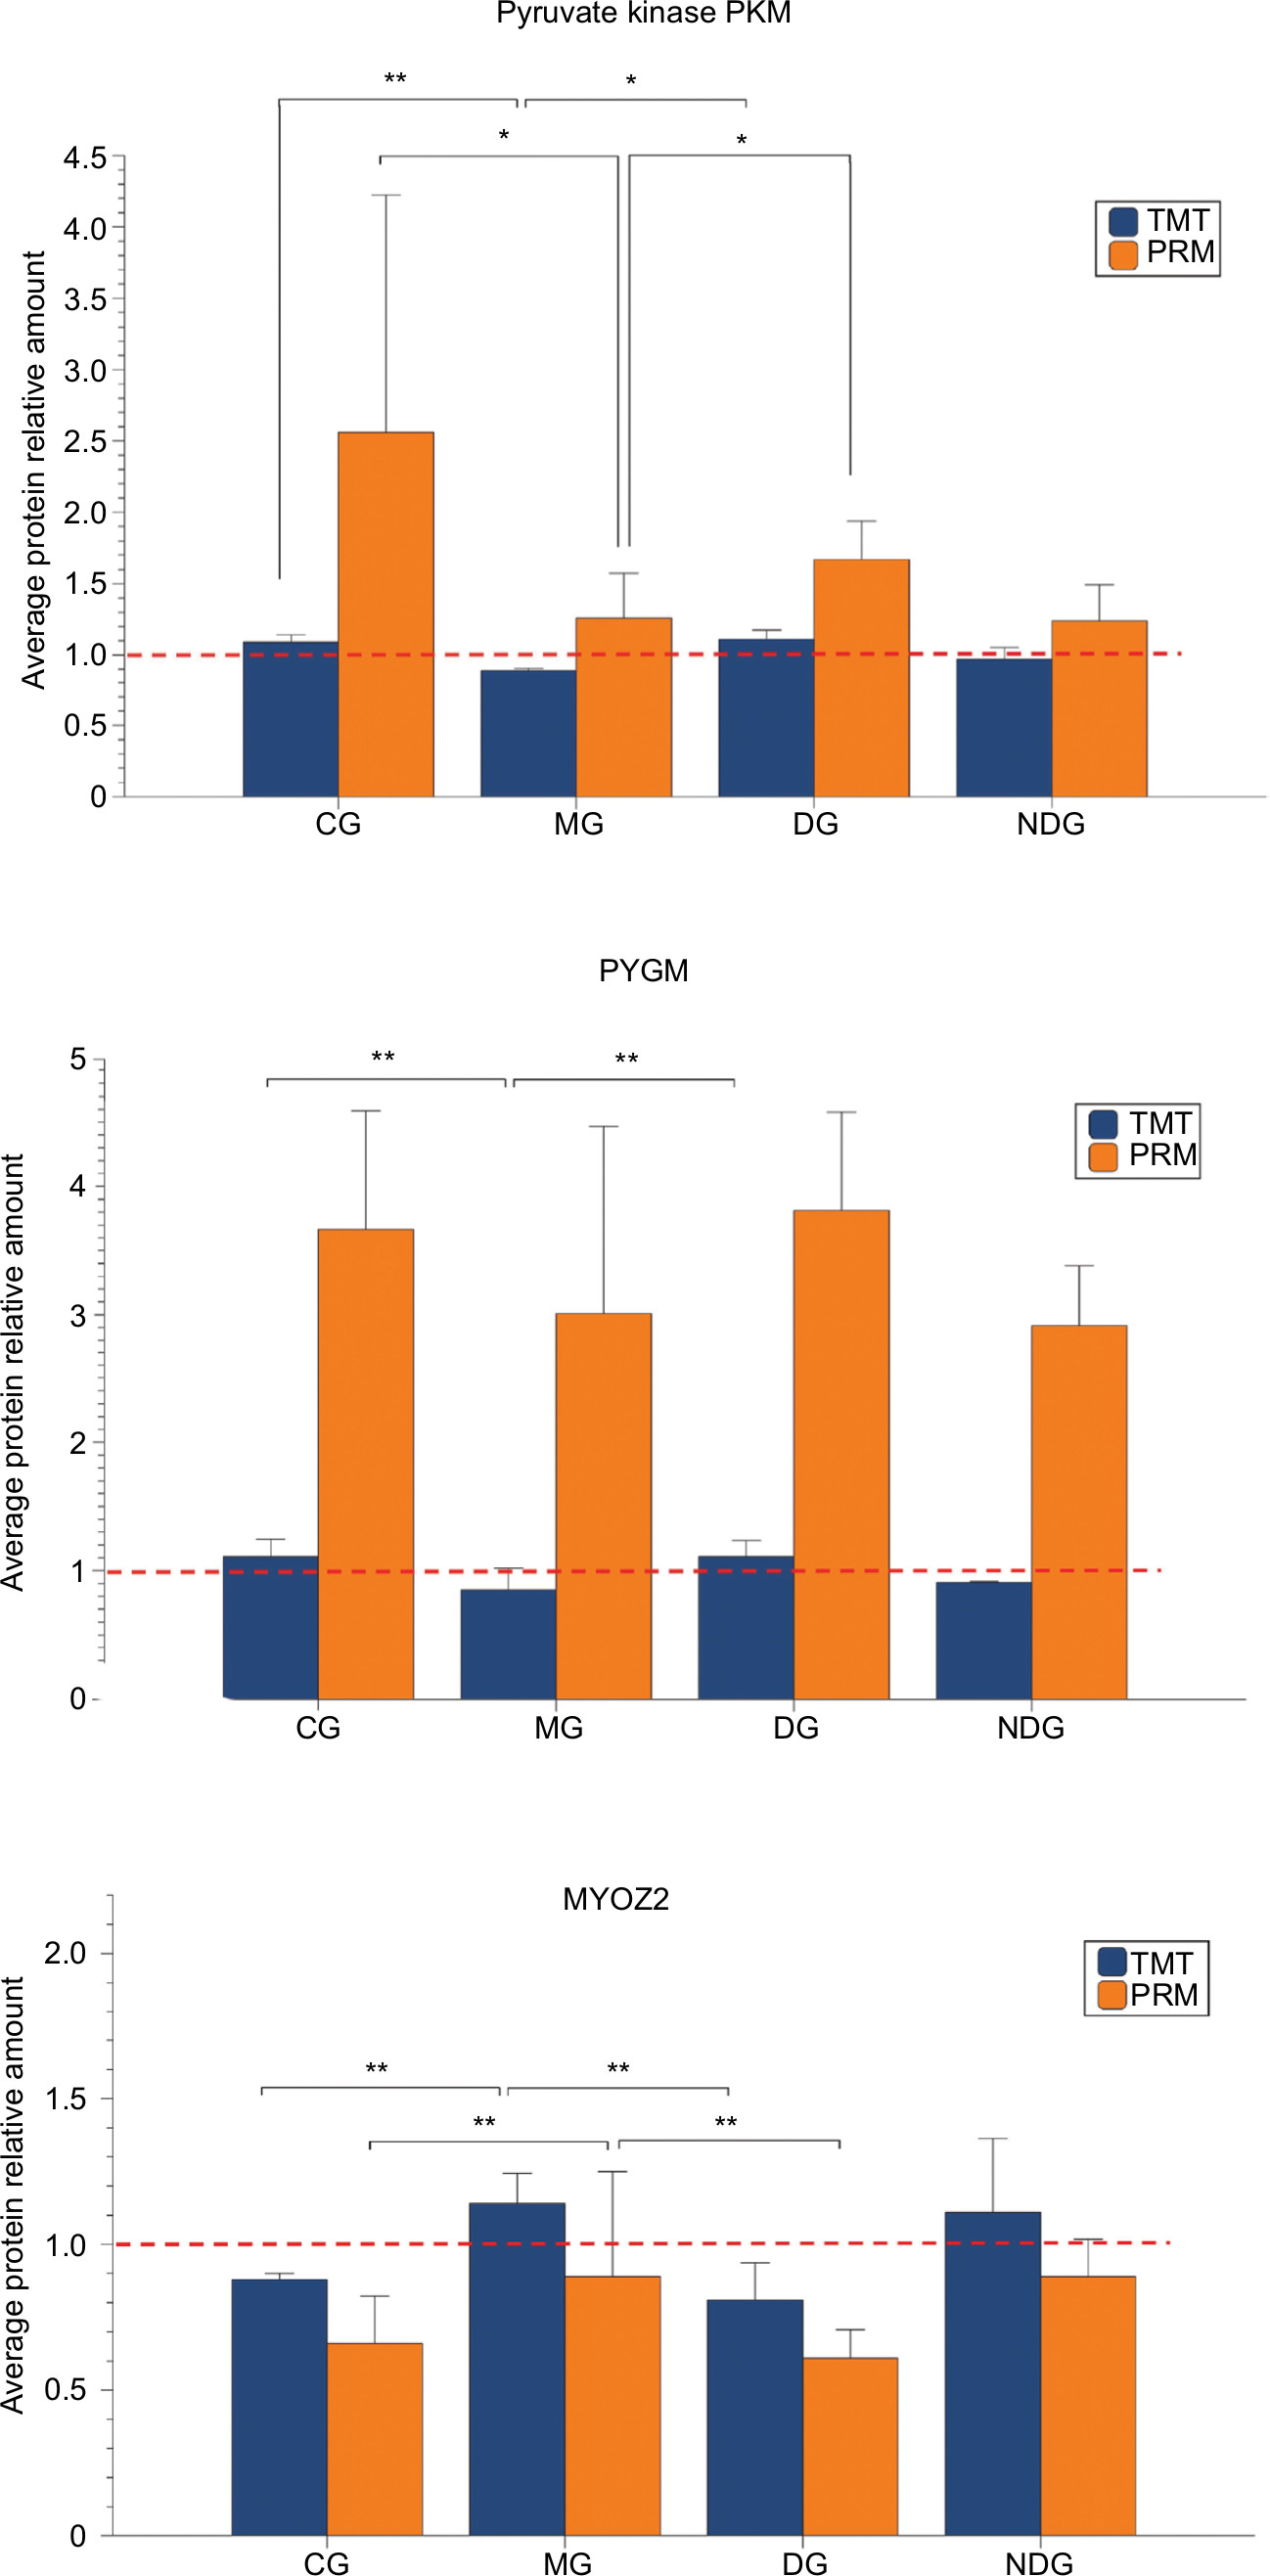 | Figure 10 Expression of pyruvate kinase PKM, PYGM, and MYOZ2 in different groups using TMT analysis, consistent with PRM validation. Notes: Data are shown as the mean±SD, compared with the MG. *P<0.05; **P<0.01. Abbreviations: CG, control group; DG, dry needling of MTrPs group; MG, model group; NDG, dry needling of non-MTrPs group; PRM, parallel reaction monitoring; TMT, tandem mass tag. |
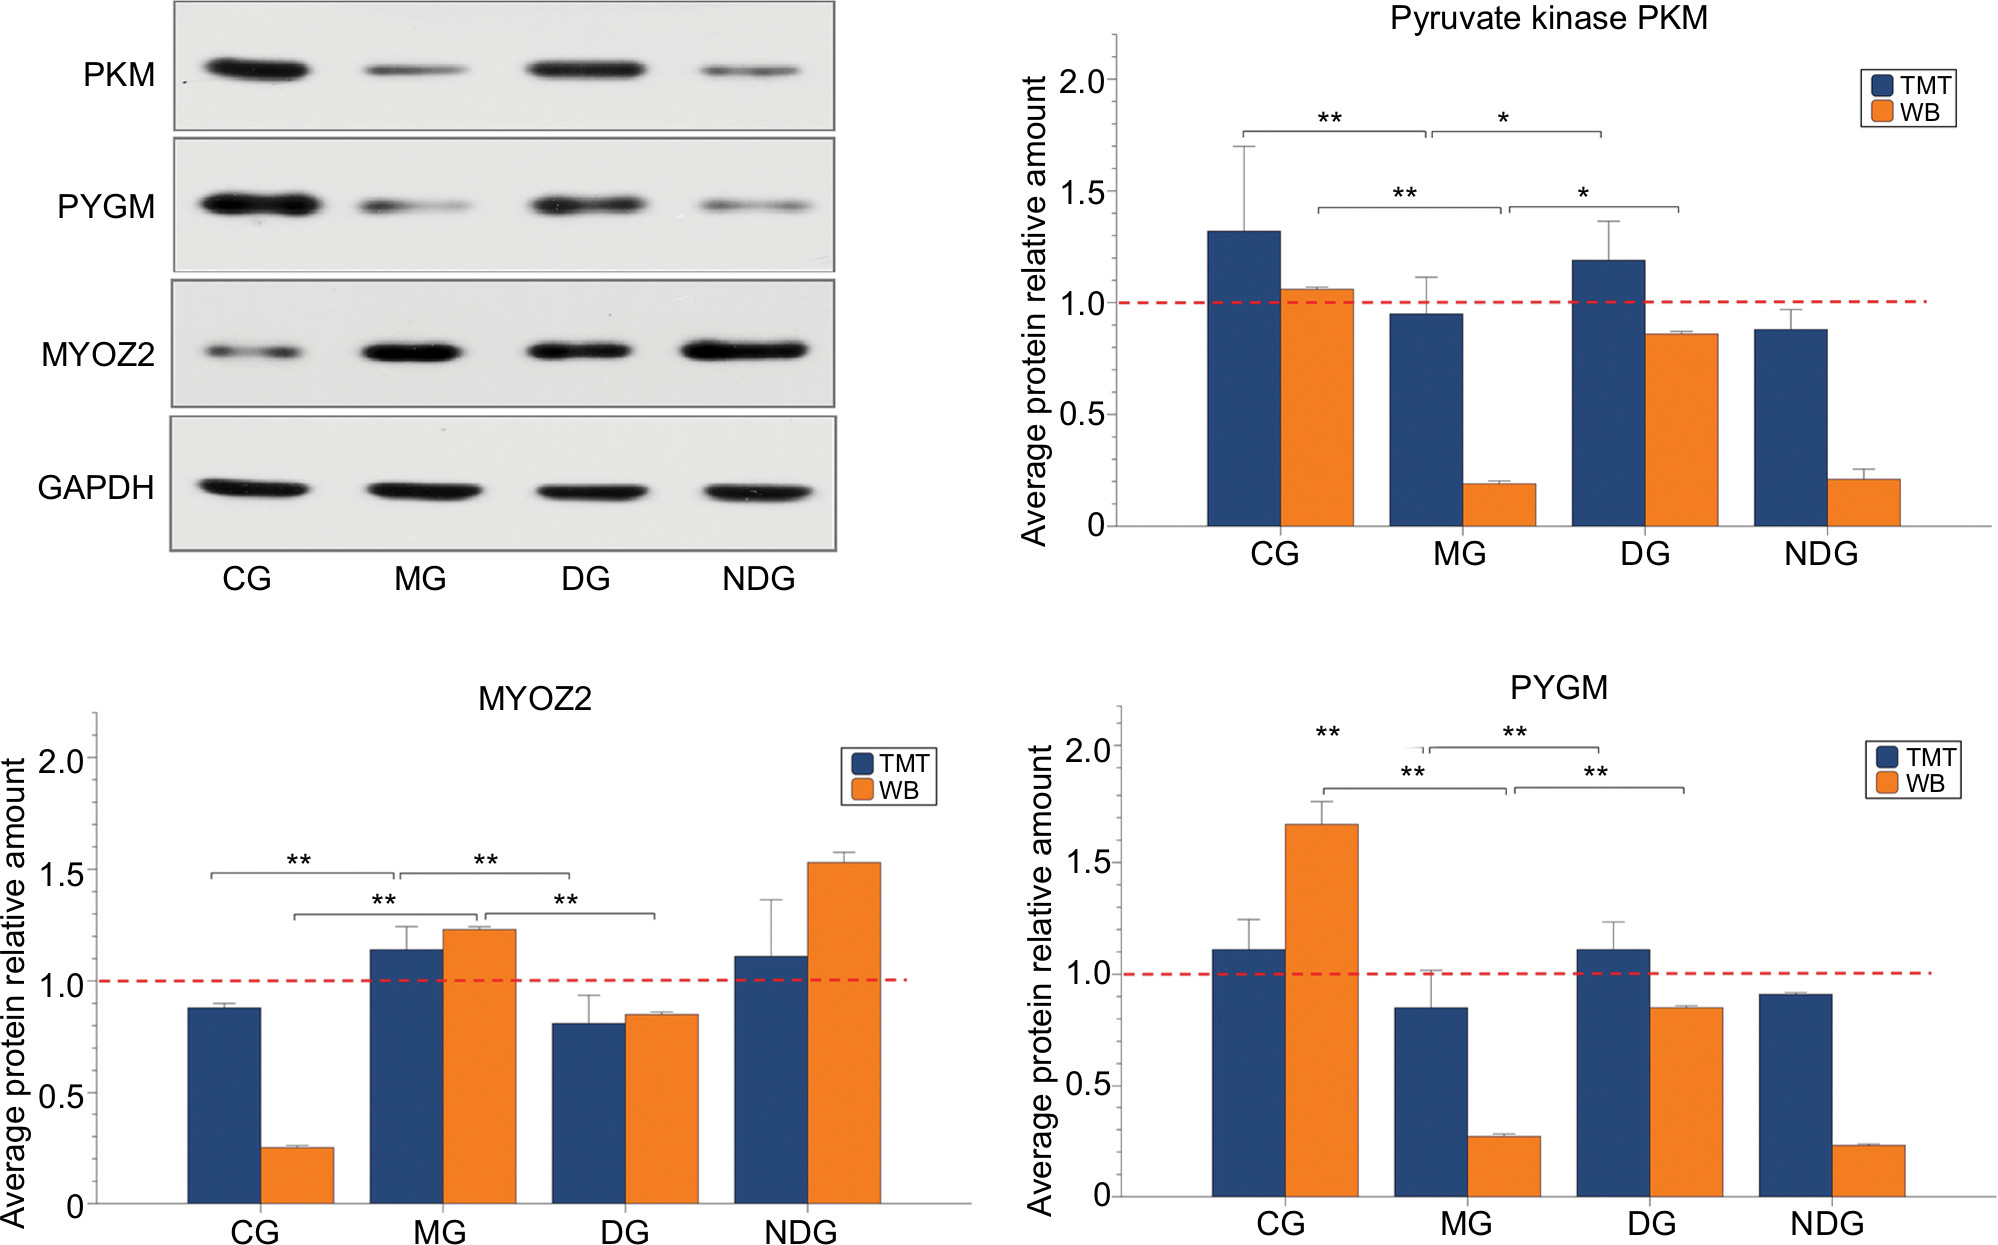 | Figure 11 Expression of pyruvate kinase PKM, PYGM, and MYOZ2 in different groups using TMT analysis, consistent with Western blot validation. Notes: Data are shown as the mean±SD, compared with the MG. *P<0.05; **P<0.01. Abbreviations: CG, control group; DG, dry needling of MTrPs group; GAPDH, glyceraldehyde-3-phosphate dehydrogenase; MG, model group; NDG, dry needling of non-MTrPs group; TMT, tandem mass tag; WB, Western Blot. |
Discussion
Proteomics technology in the post-genome era has become an important branch of system biology. The concept of the proteome was first proposed by Wilkins at Macquarie University, Australia, in 1994.23 Compared with the traditional single gene or protein study, proteomics technology shows increased reliability regarding disease diagnosis and more accurately reflects changes related to certain biological processes.24 TMT coupled with LC-MS/MS is a new technology, based on labeling quantification, which can precisely and simultaneously compare multiple samples for protein and peptide quantification.25 Large-scale proteomics technology can have the problem of quantitative false-positives, and the results usually need to be verified by specific detection methods. We adopted traditional semiquantitative Western blot analysis and precise quantitative PRM analysis in this study. As a targeted proteomics method, PRM was recognized by the journal Nature Methods as the method of the year 2012, and it is now easily applicable to evaluate many proteins.26
To the best of our knowledge, this is the first proteomics study to evaluate the mechanisms underlying myofascial pain and the treatment effects of dry needling. In this study, we used both clinical examination (observing a tender spot in a palpable taut band, and palpable or visible LTRs) and an objective tool (SEA) for identifying active MTrPs in a rat model. The GO and KEGG pathway enrichment analyses in our study demonstrated that glycolysis/gluconeogenesis was predominantly involved in the MTrP model and in precise dry needling treatment. Recently published studies using two-dimensional gel electrophoresis reported that many significantly altered proteins are important enzymes in the glycolysis/gluconeogenesis pathways in the trapezius muscle of patients diagnosed with widespread chronic pain.27–29 Gao et al found that the glycolysis/gluconeogenesis/hexose metabolism pathway might play an important role in supporting energy and neurotransmitter homeostasis following electroacupuncture treatment in rats with neuropathic pain.30
Another previously published study showed a significant increase in the dialysate lactate concentration in the MTrP region.31 Lactate is metabolized from glucose via the glycolysis pathway, which means that lactate levels are likely to be continually increased at the site of MTrPs until oxidative systems fully oxidize the lactate and glucose (if no treatment is administered). Also, the role of the glycolysis/gluconeogenesis pathway is in accordance with the integrated hypothesis put forward by Simons et al, which proposes that the MTrP zone is ischemic, leading to a shortage of oxygen and glucose for metabolism.1,32 Glycolysis is the process of converting glucose into pyruvate and generating small amounts of ATP (energy) and NADH (reducing power), which can be oxidized through oxidative phosphorylation (OXPHO) to produce ATP. In contrast, gluconeogenesis is a synthesis pathway for glucose from non-carbohydrate precursors, which is essentially a reversal of glycolysis, with minor variations in the pathway. Any protein or enzyme in this pathway that is up- or downregulated will trigger a series of biological changes. In our study, three candidate proteins, comprising pyruvate kinase PKM, PYGM, and MYOZ2, were selected based on their biological functions and their high fold changes. Also, besides the bioinformatics results, the selection criteria were also based on the effect of dry needling treatment, which means that proteins were selected only if they were up- or downregulated in MTrPs, reversed in non-MTrPs, and either recovered after dry needling of MTrPs or showed no significant expression change after dry needling of non-MTrPs. The three proteins were verified by PRM and Western blotting, the results of which coincided exactly with the TMT results.
The first candidate biomarker, pyruvate kinase PKM, had the highest degree of connectivity (as detected by PPI analysis), interacting and combining with 18 proteins that showed significantly altered expression between the CG and MTrP MG. Also, pyruvate kinase PKM was significantly downregulated in the MTrP muscle region compared with the healthy muscle tissue, and a study reported that it might be associated with a decrease in blood flow and mitochondrial dysfunction in MTrP muscle regions.33 All the enzymes involved in glycolysis and gluconeogenesis that have been identified by proteomics analysis have been shown to be acetylated.34 Acetylation of pyruvate kinase PKM decreases glycolysis/gluconeogenesis and also targets pyruvate kinase PKM for subsequent lysosome degradation and chaperone-mediated autophagy,35 suggesting that pyruvate kinase PKM has an essential role in the glycolysis/gluconeogenesis pathway. The findings of the present study may indirectly support these previous findings, as the up-regulation of pyruvate kinase PKM after dry needling of MTrPs could be explained by an increased energy requirement to support muscle activity, in line with the integrated trigger point hypothesis.17–20 It is possible that pyruvate kinase PKM leads to the inhibition of glucose production and promotion of glucose utilization, resulting in enhanced oxygen consumption, due to insufficient regeneration of ATP. Therefore, inhibition of the degradation of pyruvate kinase PKM could further promote a shift from aerobic glycolysis to gluconeogenesis, and pyruvate kinase PKM may be a novel therapeutic target for MTrPs. This hypothesis is supported by a recently published study that investigated the potential role of pyruvate kinase isozyme M2 (PKM2) in neuropathic pain, which demonstrated that inhibition of PKM2 expression effectively reduced neuropathic pain and inflammatory responses in a rat model by regulating the ERK) and STAT3 signaling pathways.36 Therefore, pyruvate kinase PKM may be involved in several pathways to alleviate pain.
The second protein biomarker identified in this study, PYGM, has been previously identified as being associated with McArdle’s disease (glycogen storage disease type V), which is the most common autosomal recessive disorder of glycogen metabolism.37,38 The typical clinical symptoms of McArdle’s disease are muscle pain, muscle weakness, myalgia, cramping associated with exercise, and lack of physical endurance.39 PYGM is also involved in the glucagon signaling pathway and in starch and sucrose metabolism. In the present study, PYGM was downregulated in MTrPs and its expression was reversed in non-MTrPs and upregulated after dry needling of MTrPs, with no significant expression change after dry needling of non-MTrPs. Although further studies are still needed to determine the mechanism underlying the relationship between PYGM and MTrPs, the findings of this preliminary in vivo study using a rat model might provide the basis for further studies on PYGM and pain control.
The third identified candidate protein biomarker was MYOZ2, which is specific to cardiac and slow-skeletal muscle fibers and has been identified through studies in transgenic animals.40 In slow-skeletal muscle, MYOZ2 is NFAT increased in slow-twitch muscle fibers.41 The increase of MYOZ2 mRNA expression in the rat soleus muscle under conditions of muscle disuse has been shown to be associated with the calcineurin/nuclear factor of activated T cells signaling pathway.42 Also, previously published studies have supported a role for MYOZ2 in inhibiting pathological cardiac hypertrophy,43 which can be provoked by exercise, resulting in symptoms that include chest pain, dyspnea, syncope, and palpitations. MYOZ2 plays an important role in the modulation of calcineurin signaling, and it may serve as an intracellular binding protein involved in linking Z-line proteins and localizing calcineurin signaling to the sarcomere. The findings of the present study showed that MYOZ2 was significantly upregulated in the MTrP model and downregulated following dry needling treatment. As exercise and blunt injury were used for MTrP modeling, the decrease of MYOZ 2 might be considered as a potential therapeutic biomarker of the effects of pain reduction after dry needling and requires further study.
Conclusion
This in vivo study, using a rat model, is the first TMT-based proteomics study that has investigated the mechanism underlying myofascial pain and the treatment effects of dry needling of MTrPs using enriched signaling pathways to identify three potential novel biomarkers or therapeutic targets. Although the three candidate proteins selected in this preliminary study might not be the optimum protein targets, the proteomics data may provide valuable clues to better understand the pathogenesis associated with myofascial pain in order to improve diagnosis and treatment. There are several limitations in the present study. First, only a small number of differentially expressed proteins (three) were selected for further validation, possibly resulting in other valuable proteins being omitted. Second, a qualitative immunohistochemistry analysis was not performed to confirm the protein location in the muscles. Third, we selected male rats as the experimental subjects; however, both male and female subjects should be considered as gender-specific differences in pain perception are often a focus. Further, future studies are necessary to verify the candidate biomarkers in larger cohorts, and functional studies are required to dissect the roles of the pathways, as there may be a potential for developing new drugs based on the proteome associated with myofascial pain.
Acknowledgment
This work was supported by National Natural Science Foundation of China (grant number 81470105); Shanghai Key Laboratory of Human Performance (Shanghai University of Sport) (grant number 11DZ2261100); Exercise and Health Sciences of Ministry of Education (Shanghai University of Sport); and the China Scholarship Council.
Disclosure
The authors report no conflicts of interest in this work.
References
Simons DG. New views of myofascial trigger points: etiology and diagnosis. Arch Phys Med Rehabil. 2008;89(1):157–159. | ||
Gerwin RD. Myofascial trigger point pain syndromes. Semin Neurol. 2016;36(5):469–473. | ||
Shah JP, Thaker N, Heimur J, Aredo JV, Sikdar S, Gerber L. Myofascial trigger points then and now: a historical and scientific perspective. Pm R. 2015;7(7):746–761. | ||
Zhuang X, Tan S, Huang Q. Understanding of myofascial trigger points. Chin Med J. 2014;127(24):4271–4277. | ||
Mense S, Simons DG, Hoheisel U, Quenzer B. Lesions of rat skeletal muscle after local block of acetylcholinesterase and neuromuscular stimulation. J Appl Physiol. 2003;94(6):2494–2501. | ||
Shah JP, Gilliams EA. Uncovering the biochemical milieu of myofascial trigger points using in vivo microdialysis: an application of muscle pain concepts to myofascial pain syndrome. J Bodyw Mov Ther. 2008;12(4):371–384. | ||
Shah JP, Danoff JV, Desai MJ, et al. Biochemicals associated with pain and inflammation are elevated in sites near to and remote from active myofascial trigger points. Arch Phys Med Rehabil. 2008;89(1):16–23. | ||
Shah JP. Uncovering the biochemical milieu of myofascial trigger points using in vivo microdialysis. J Musculoskelet Pain. 2008;16(1–2):17–20. | ||
Hubbard DR, Berkoff GM. Myofascial trigger points show spontaneous needle EMG activity. Spine. 1993;18(13):1803–1807. | ||
Ge HY, Fernández-de-Las-Peñas C, Yue SW. Myofascial trigger points: spontaneous electrical activity and its consequences for pain induction and propagation. Chin Med. 2011;6:13. | ||
Barbero M, Falla D, Cescon C. Topographical distribution of EMG activity in the upper trapezius muscle in people with myofascial trigger points. Clin J Pain. 2017;33(5):473–474. | ||
Huang QM, Lv JJ, Ruanshi QM, Liu L. Spontaneous electrical activities at myofascial trigger points at different stages of recovery from injury in a rat model. Acupunct Med. 2015;33(4):319–324. | ||
Liu QG, Liu L, Huang QM, Nguyen TT, Ma YT, Zhao JM. Decreased spontaneous electrical activity and acetylcholine at myofascial trigger spots after dry needling treatment: a pilot study. Evid Based Complement Alternat Med. 2017;2017:1–7. | ||
Fernández-de-Las-Peñas C, Dommerholt J. International consensus on diagnostic criteria and clinical considerations of myofascial trigger points: a Delphi study. Pain Med. 2018;19(1):142–150. | ||
Liu L, Huang QM, Liu QG, et al. Evidence for dry needling in the management of myofascial trigger points associated with low back pain: a systematic review and meta-analysis. Arch Phys Med Rehabil. 2018;99(1):144–152. | ||
Hsieh YL, Hong CZ, Liu SY, Chou LW, Yang CC. Acupuncture at distant myofascial trigger spots enhances endogenous opioids in rabbits: a possible mechanism for managing myofascial pain. Acupunct Med. 2016;34(4):302–309. | ||
Simons DG, Travell JG, Simons LS. Myofascial Pain and Dysfunction: The Trigger Point Manual. vol. 1, 2nd ed. Baltimore: Williams and Wilkins; 1999. | ||
Simons DG, Hong CZ, Simons LS. Endplate potentials are common to midfiber myofacial trigger points. Am J Phys Med Rehabil. 2002;81(3):212–222. | ||
Hong CZ, Simons DG. Pathophysiologic and electrophysiologic mechanisms of myofascial trigger points. Arch Phys Med Rehabil. 1998;79(7):863–872. | ||
Simons DG. Do endplate noise and spikes arise from normal motor endplates? Am J Phys Med Rehabil. 2001;80(2):134–140. | ||
Nesvizhskii AI. Proteogenomics: concepts, applications and computational strategies. Nat Methods. 2014;11(11):1114–1125. | ||
Fernández-Carnero J, Gilarranz-de-Frutos L, León-Hernández JV, et al. Effectiveness of different deep dry needling dosages in the treatment of patients with cervical myofascial pain: a pilot RCT. Am J Phys Med Rehabil. 2017;96(10):726–733. | ||
Wilkins MR, Sanchez JC, Gooley AA, et al. Progress with proteome projects: why all proteins expressed by a genome should be identified and how to do it. Biotechnol Genet Eng Rev. 1996;13:19–50. | ||
Ohlendieck K. Skeletal muscle proteomics: current approaches, technical challenges and emerging techniques. Skelet Muscle. 2011;1(1):6. | ||
Thompson A, Schäfer J, Kuhn K, et al. Tandem mass tags: a novel quantification strategy for comparative analysis of complex protein mixtures by MS/MS. Anal Chem. 2003;75(8):1895–1904. | ||
Aebersold R, Burlingame AL, Bradshaw RA. Western blots versus selected reaction monitoring assays: time to turn the tables? Mol Cell Proteomics. 2013;12(9):2381–2382. | ||
Olausson P, Gerdle B, Ghafouri N, Sjöström D, Blixt E, Ghafouri B. Protein alterations in women with chronic widespread pain – An explorative proteomic study of the trapezius muscle. Sci Rep. 2015;5:11894. | ||
Olausson P, Ghafouri B, Ghafouri N, Gerdle B. Specific proteins of the trapezius muscle correlate with pain intensity and sensitivity – an explorative multivariate proteomic study of the trapezius muscle in women with chronic widespread pain. J Pain Res. 2016;9:345–356. | ||
Wåhlén K, Olausson P, Carlsson A, Ghafouri N, Gerdle B, Ghafouri B. Systemic alterations in plasma proteins from women with chronic widespread pain compared to healthy controls: a proteomic study. J Pain Res. 2017;10:797–809. | ||
Gao Y, Chen S, Xu Q, et al. Proteomic analysis of differential proteins related to anti-nociceptive effect of electroacupuncture in the hypothalamus following neuropathic pain in rats. Neurochem Res. 2013;38(7):1467–1478. | ||
Moraska AF, Hickner RC, Kohrt WM, Brewer A. Changes in blood flow and cellular metabolism at a myofascial trigger point with trigger point release (ischemic compression): a proof-of-principle pilot study. Arch Phys Med Rehabil. 2013;94(1):196–200. | ||
Gerwin RD, Dommerholt J, Shah JP. An expansion of Simons’ integrated hypothesis of trigger point formation. Curr Pain Headache Rep. 2004;8(6):468–475. | ||
Zhang P, Zhu S, Li Y, et al. Quantitative proteomics analysis to identify diffuse axonal injury biomarkers in rats using iTRAQ coupled LC-MS/MS. J Proteomics. 2016;133:93–99. | ||
Guan KL, Xiong Y. Regulation of intermediary metabolism by protein acetylation. Trends Biochem Sci. 2011;36(2):108–116. | ||
Xiong Y, Lei QY, Zhao S, Guan KL. Regulation of glycolysis and gluconeogenesis by acetylation of PKM and PEPCK. Cold Spring Harb Symp Quant Biol. 2011;76:285–289. | ||
Wang B, Liu S, Fan B, et al. PKM2 is involved in neuropathic pain by regulating ERK and STAT3 activation in rat spinal cord. J Headache Pain. 2018;19(1):7. | ||
Chéraud C, Froissart R, Lannes B, Echaniz-Laguna A. Novel variant in the PYGM gene causing late-onset limb-girdle myopathy, ptosis, and camptocormia. Muscle Nerve. 2018;57(1):157–160. | ||
de Luna N, Brull A, Lucia A, et al. PYGM expression analysis in white blood cells: a complementary tool for diagnosing McArdle disease? Neuromuscul Disord. 2014;24(12):1079–1086. | ||
Gurgel-Giannetti J, Nogales-Gadea G, van der Linden H, et al. Clinical and molecular characterization of McArdle’s disease in Brazilian patients. Neuromolecular Med. 2013;15(3):470–475. | ||
Frey N, Barrientos T, Shelton JM, et al. Mice lacking calsarcin-1 are sensitized to calcineurin signaling and show accelerated cardiomyopathy in response to pathological biomechanical stress. Nat Med. 2004;10(12):1336–1343. | ||
Rual JF, Venkatesan K, Hao T, et al. Towards a proteome-scale map of the human protein-protein interaction network. Nature. 2005;437(7062):1173–1178. | ||
Lomonosova YN, Turtikova OV, Shenkman BS. Reduced expression of MyHC slow isoform in rat soleus during unloading is accompanied by alterations of endogenous inhibitors of calcineurin/NFAT signaling pathway. J Muscle Res Cell Motil. 2016;37(1–2):7–16. | ||
Ruggiero A, Chen SN, Lombardi R, Rodriguez G, Marian AJ. Pathogenesis of hypertrophic cardiomyopathy caused by myozenin 2 mutations is independent of calcineurin activity. Cardiovasc Res. 2013;97(1):44–54. |
 © 2019 The Author(s). This work is published and licensed by Dove Medical Press Limited. The
full terms of this license are available at https://www.dovepress.com/terms
and incorporate the Creative Commons Attribution
- Non Commercial (unported, 3.0) License.
By accessing the work you hereby accept the Terms. Non-commercial uses of the work are permitted
without any further permission from Dove Medical Press Limited, provided the work is properly
attributed. For permission for commercial use of this work, please see paragraphs 4.2 and 5 of our Terms.
© 2019 The Author(s). This work is published and licensed by Dove Medical Press Limited. The
full terms of this license are available at https://www.dovepress.com/terms
and incorporate the Creative Commons Attribution
- Non Commercial (unported, 3.0) License.
By accessing the work you hereby accept the Terms. Non-commercial uses of the work are permitted
without any further permission from Dove Medical Press Limited, provided the work is properly
attributed. For permission for commercial use of this work, please see paragraphs 4.2 and 5 of our Terms.