Back to Journals » OncoTargets and Therapy » Volume 13
Quantitative Proteomics Analysis Indicates That Upregulation of lncRNA HULC Promotes Pathogenesis of Glioblastoma Cells
Authors Hu Y ![]() , Ye S, Li Q, Yin T, Wu J, He J
, Ye S, Li Q, Yin T, Wu J, He J
Received 7 March 2020
Accepted for publication 15 May 2020
Published 22 June 2020 Volume 2020:13 Pages 5927—5938
DOI https://doi.org/10.2147/OTT.S252915
Checked for plagiarism Yes
Review by Single anonymous peer review
Peer reviewer comments 2
Editor who approved publication: Prof. Dr. Nicola Silvestris
Yuchen Hu,1 Shan Ye,2 Qian Li,3 Tiantian Yin,1 Jing Wu,1 Jie He1
1Department of Pathology, The First Affiliated Hospital of USTC, Division of Life Sciences and Medicine, University of Science and Technology of China, Hefei, Anhui, People’s Republic of China; 2Anhui Provincial Hospital Affiliated to Anhui Medical University, Hefei, Anhui, People’s Republic of China; 3The Second Hospital of Anhui Medical University, Hefei, Anhui, People’s Republic of China
Correspondence: Jie He
Department of Pathology, The First Affiliated Hospital of USTC,Division of Life Sciences and Medicine, University of Science and Technology of China, Hefei, Anhui, People’s Republic of China
Email [email protected]
Purpose: Glioblastoma (GBM) is an aggressive central nervous system (CNS) cancer and a serious threat to human health. The long noncoding RNA (lncRNA) HULC has been implicated in GBM, but the molecular mechanism is uncertain. This study used quantitative proteomic analysis for global identification of HULC-regulated proteins in glioblastoma cells and identification of potential biomarkers.
Materials and Methods: qRT-PCR was used to determine the expression of HULC in U87 cells stably transfected with HULC or an empty vector (control). The CCK-8 assay, transwell assay, and wound-scratch assay were used to measure cell proliferation, invasion, and migration. Quantitative proteomics using Tandem Mass Tag (TMT) labeling, high-performance liquid chromatography (HPLC) fractionation, and liquid chromatography–mass spectrometry (LC-MS/MS) analysis were used to identify differentially expressed proteins (DEPs). Screened proteins were validated by parallel reaction monitoring (PRM) and Western blotting.
Results: Overexpression of HULC led to increased cell proliferation, invasion, and migration. HULC overexpression also led to significant upregulation of 37 proteins and downregulation of 78 proteins. Bioinformatics analysis indicated these proteins had roles in cellular component, biological process, and molecular function. PRM results of 8 of these proteins (PTK2, TNC, ITGAV, LASP1, MAPK14, ITGA1, GNA13, RRAS) were consistent with the LC-MS/MS and Western blotting results.
Conclusion: The results of present study suggest that lncRNA HULC promotes GBM cell proliferation, invasion, and migration by regulating RRAS expression, suggesting that RRAS may be a potential biomarker or therapeutic target for this cancer.
Keywords: glioblastoma, LncRNA HULC, quantitative proteomics, PRM
Introduction
Glioblastoma (GBM) is a grade IV glioma that accounts most gliomas and is one of the most common and malignant brain tumors in adults.1,2 The clinical outcomes for GBM patients have remained unsatisfactory because of disease relapse and late diagnosis. Despite current treatments of surgical resection, radiotherapy, and chemotherapy, the median survival of patients is less than 15 months.3,4 Thus, there is an urgent need to identify novel targeted therapies that improve the survival of these patients.
Long noncoding RNAs (lncRNAs) are RNAs that have more than 200 nucleotides (nt) but do not code for proteins.5–7 Increasing evidence suggests that lncRNAs have critical functions in a variety of biological processes related to tumor growth, including cell cycle regulation, cell proliferation, cell invasion, and the epithelial-mesenchymal transition (EMT).8–10 Highly Up-regulated in Liver Cancer (HULC) is a lncRNAs that was identified in 2007.11 Subsequent studies showed that this lncRNA also had high expression and played roles in the pathogenesis of other malignancies, including lung cancer,12 gastric cancer,13 and colon cancer.14 We previously reported that lncRNA HULC was up-regulated in GBM tissues and cell lines (SHG44 and U251) relative to healthy brain tissues, and that its expression negatively correlated with overall survival (OS) in these patients.15 Zhu et al found that lncRNA HULC promoted angiogenesis by upregulating vascular endothelial growth factor (VEGF) and endothelial cell-specific molecule-1 (ESM-1) in GBM, and that inhibition of lncRNA HULC blocked the cell cycle at the G1/S phase.16 These results indicated that lncRNA HULC has an important role in the oncogenesis of GBM, and may also be useful for diagnosis.
The present study examined the potential role of lncRNA HULC in GBM cells and whether lncRNA HULC upregulation promotes the progression of GBM. Previous studies have used proteomics strategies to examine the molecular mechanism of lncRNAs because the proteome is directly related to cell function and phenotype.17–19 Thus, we used a quantitative proteomic approach consisting of liquid chromatography–mass spectrometry (LC-MS/MS) with labeling by Tandem Mass Tags (TMT) to examine the effect of lncRNA HULC overexpression in GBM cells. We also used bioinformatics analyses to examine the many differentially expressed proteins (DEPs) that appeared after HULC overexpression and that may function in cancer-related signaling pathways. We sought to confirm our DEP results using parallel reaction monitoring (PRM) analysis, and used additional functional studies to examine the impact of HULC on the expression of Ras-related protein (RRAS). Our general purpose is to provide new insights regarding the mechanism of HULC in GBM, and a theoretical basis for further in-depth research and clinical targeted therapy.
Materials and Methods
Reagents and Materials
Dulbecco’s modified Eagle’s medium (DMEM) with high glucose and fetal bovine serum (FBS) were obtained from Biological Industries (Israel). TMT Mass Tagging Kits were purchased from Thermo Fisher Scientific (Waltham, MA, USA). Iodoacetamide (IAA), dithiothreitol (DTT), urea, ethylene diamine tetraacetic acid (EDTA), and tetraethylammonium borohydride (TEAB) were obtained from Sigma (St. Louis, MO, USA). Formic acid (FA) was obtained from Fluka (Buches, Germany).
Cell Lines, Cell Culture and Cell Transfection
The human GBM U87 cell line was purchased from China Center for Type Culture Collection (Wuhan, China). The cells were cultured in a DMEM high glucose medium supplemented with 10% FBS and 1% penicillin/streptomycin at 37°C in a 5% CO2 incubator.
To produce U87 cell lines that stably overexpressed lncRNA HULC, cells were transfected with a plasmid using Lipofectamine 2000 (GenePharma, Shanghai, China) according to the manufacturer’s instructions. Then, stable cells were obtained through lentiviral packaging, virus infection, and selection by puromycin. A kill curve test indicated that the optimal concentration of puromycin was 2 to 3 μg/mL. U87 cells transfected with an empty vector were used as mock controls. Overexpressed sequences of lncRNA HULC were synthesized by GenePharma (Shanghai, China). The efficiency was confirmed by quantitative real-time reverse transcription-PCR (qRT-PCR).
Quantitative Real-Time Polymerase Chain Reaction
The total RNA was extracted from transfected cells using the TRIzol reagent (Invitrogen, USA). Complementary DNA (cDNA) synthesis was performed using a Thermo Scientific RevertAid First Strand cDNA Synthesis Kit (Thermo Fisher Scientific, USA). qRT-PCR was performed using a Power SYBR Green Master Mix (Applied Biosystems, USA) and an ABI 7500 Fast Real-Time PCR System (Applied Biosystems, USA). All data were quantified using the 2−ΔΔCT method. GAPDH was used as an internal reference, and all experiments were performed 3 times.
Cell Proliferation, Invasion and Migration
The Cell Counting Kit-8 (CCK-8; Biosharp, China) assay was used to evaluate cell proliferation. Transfected cells were seeded on 96-well plates (2000 cells per well), and the CCK-8 reagents were then added according to the manufacturer’s instructions. A cell plate reader was used to measure absorbance at 450 nm after 24 h, 48 h, 72 h, and 96 h.
Cell invasion was determined using the Transwell assay. A total of 1×10⁵ transfected cells were transferred to the upper Matrigel-coated Transwell chamber (Corning Incorporated, USA) with DMEM (no serum); DMEM containing 10% FBS was added to the lower chamber. After 48 h, non-invasive cells were removed, and the remaining cells were fixed with 4% paraformaldehyde for 30 min. Then, the fixed cells were stained with 0.1% crystal violet and 5 randomly chosen microscopic fields were scored to measure invasion of transfected cells.
Cell migration was determined using the wound-scratch assay. Transfected cells were seeded at a concentration of 3.5×10⁵ cells/well in a 6-well plate, and a pipette tip was used to make a straight scratch in each well after the cells reached 100% confluence. The scratch was recorded using an inverted microscope (Olympus, Japan) equipped with a camera at 0 h, 24 h and 48 h. ImageJ software was used to estimate the wound area.
Western Blot Analysis
Total protein was extracted using a RIPA lysis buffer (Beyotime Biotechnology, China) and quantitated using a BCA Protein Assay Kit (Beyotime Biotechnology, China). The primary antibody against RRAS was purchased from Abcam (1:1000, ab191399) and a β-actin antibody was used as an internal reference. After the membranes incubated with the secondary antibody (Cell Signaling Technology, USA), an electro-chemiluminescence (ECL) system (Thermo Fisher Scientific, USA) was used for detection. At least three independent replicates were performed.
Protein Extraction, Trypsin Digestion and TMT Labeling
Cells were sonicated three times on ice (4 to 6 s each) using a high intensity ultrasonic processor (Scientz, China) in a lysis buffer (8 M urea, 1% protease inhibitor cocktail, 2 mM EDTA). Remaining cell debris were removed by centrifugation at 12,000 g at 4°C for 10 min, the supernatant was collected, and the protein concentration was determined using the BCA kit according to the manufacturer’s instructions.
For digestion, the protein solution was first reduced with 5 mM dithiothreitol (30 min at 56°C) and then incubated with 11 mM iodoacetamide (15 min at room temperature in darkness). The protein sample was then diluted so that the urea concentration was less than 2 M. Finally, the proteins were digested overnight at 37°C with trypsin using a trypsin: protein ratio of 1:50, and then at a ratio of 1:100 for an additional 4 h.
After trypsin digestion, peptides were desalted using a Strata X C18 SPE column (Phenomenex) and vacuum-dried. The peptides were reconstituted in 0.5 M TEAB and processed using the TMT kit according to the manufacturer’s protocol. Briefly, one unit of TMT reagent was thawed and reconstituted in acetonitrile, the peptide mixtures were incubated for 2 h at room temperature, and the mixture was then pooled, desalted, and dried by vacuum centrifugation.
High-Performance Liquid Chromatography (HPLC) Fractionation
The tryptic peptides were fractionated using high-pH reverse-phase HPLC with an Agilent 300 Extend C18 column (5 μm particles, 4.6 mm ID, 250 mm length). Briefly, peptides were first separated with a gradient of 8% to 32% acetonitrile (pH 9.0) over 60 min into 60 fractions. Then, the peptides were combined into 9 fractions and dried by vacuum centrifugation.
Liquid Chromatography–Mass Spectrometry (LC-MS/MS) Analysis
The peptides were dissolved in solvent A (0.1% formic acid and 2% acetonitrile) and separation was performed using an EASY-nLC 1000 system (Thermo Fisher Scientific, USA). Solvent B contained 0.1% formic acid and 90% acetonitrile, and the liquid phase gradient setting was: 0 to 30 min: 8 to 6% B; 30 to 55 min: 16 to 30% B; 55 to 57 min: 30 to 80% B; 57 to 60 min: 80% B. The flow rate was a constant 400 nL/min.
The peptides were separated using ultra-performance liquid chromatography (UPLC) and subjected to a nanoelectrospray ion (NSI) source followed by mass spectrometry (MS) in Orbitrap Fusion Lumos system (Thermo Fisher Scientific, USA). The electrospray voltage was 2.0 kV, and the peptide precursor ions and secondary fragments were detected and analyzed using the high-resolution Orbitrap. The m/z scan range was 350 to 1550 for an MS scan at a resolution of 60,000, and the MS/MS scan range had a fixed starting point of 100 m/z and resolution of 15,000. The data acquisition mode used a data-dependent scanning (DDA) program. The 20 major precursor ions with the highest signal intensity were selected to enter the HCD collision cell, and 32% of the fragmentation energy was used for fragmentation after the MS scan. Sequential MS/MS was also performed. To improve performance, the automatic gain control (AGC) was set at 5E4, the signal threshold at 50,000 ions/s, the maximum injection time at 70 ms, and the dynamic exclusion time for tandem mass spectrometry at 30 s (to avoid repeated scans of the precursor ion).
Database Searches
The resulting MS/MS data were processed using the Maxquant search engine (v.1.5.2.8). For proteome analysis, tandem mass spectra were searched against SwissProt Human database (which contains 20,317 sequences) that was concatenated with a reverse decoy database. At the same time, a database of common contaminants was added to eliminate the influence of contaminating proteins in the identifications. Trypsin/P was specified as a cleavage enzyme, and up to 2 missing cleavages were allowed. The mass tolerance for precursor ions was 20 ppm in the first search and 5 ppm in the main search, and the mass tolerance for fragment ions was 0.02 Da. Alkylation of Cys was specified as a fixed modification, and oxidation of Met and acetylation of the N-terminus as variable modifications. The quantitative method was set to TMT-6plex, and the thresholds used for the false detection rate (FDR) in protein identification and the peptide-to-spectrum match (PSM) were below 1%.
Bioinformatics Analysis
The Gene Ontology (GO) annotation proteome was derived from the UniProt-GOA database (http://www.ebi.ac.uk/GOA). Any identified proteins not annotated by this database were analyzed using InterProScan software to annotate the GO function based on sequence alignment. Then, proteins were classified by GO annotation into three categories: biological process, cellular component, and molecular function. Subcellular localization was predicted using WoLF PSORT software. The Kyoto Encyclopedia of Genes and Genomes (KEGG) database was used to annotate protein pathways. Functional enrichment analysis of identified proteins was used with Fisher’s two-tailed exact test to determine statistical significance. A GO and pathway with a corrected p-value below 0.05 was considered significant.
PRM Analysis
The peptide samples were prepared for PRM using the results of whole-cell proteome analysis described above. Cells were sonicated 3 times on ice (4 to 6 s each) using a high intensity ultrasonic processor in a lysis buffer (8 M urea, 1% Triton-100, 10 mM dithiothreitol, 1% protease inhibitor cocktail). Cell debris were removed by centrifugation at 20,000 g at 4 °C for 10 min. Finally, proteins were precipitated using cold 20% TCA for 2 h at –20 °C. After centrifugation at 12,000 g at 4 °C for 10 min, the supernatant was discarded and the remaining precipitate was washed 3 times with cold acetone. The protein was redissolved in 8 M urea, and protein concentration was determined using a BCA kit according to the manufacturer’s instructions. Proteins were alkylated and digested as described above. The tryptic peptides were dissolved in 0.1% formic acid (solvent A) and directly loaded onto a home-made reversed-phase analytical column. Solvent B consisted of 0.1% formic acid in 98% acetonitrile and increased from 6% to 23% for 38 min, 23% to 35% for 14 min, 80% for 4 min, and was then held at 80% for an additional 4 min. The flow rate was a constant 700 nL/min on an EASY-nLC 1000 UPLC system.
The peptides were subjected to the NSI source followed by tandem mass spectrometry (MS/MS) in Q ExactiveTM Plus (Thermo) system that was coupled online to the UPLC. The electrospray voltage was 2.0 kV, the m/z scan range was 350 to 1000 (full scan), and intact peptides were detected in the Orbitrap at a resolution of 35,000. Peptides were then selected for MS/MS using a normalized collision energy (NCE) of 27, and the fragments were detected in the Orbitrap at a resolution of 17,500. A data-independent procedure alternated between one MS scan followed by 20 MS/MS scans. The AGC was 3E6 for full MS and 1E5 for MS/MS. The maximum IT was 20 ms for full MS and automatic for MS/MS. The isolation window for MS/MS was 2.0 m/z.
The resulting MS data were processed using Skyline (ver. 3.6). For peptide settings, the enzyme was Trypsin [KR/P], and the maximum missed cleavage set was as 2. The peptide length was 8 to 25, variable modification was carbamidomethyl on Cys and oxidation on Met, and max variable modifications were 3. For transition settings, the precursor charges were 2 and 3, the ion charges 1 and 2, and the ion types were b, y, and p. The product ions were from ion 3 to last ion, the ion match tolerance was 0.02 Da.
Statistical Analysis
For all experiments, at least three independent replicates were performed and data were analyzed using GraphPad Prism 7 software (GraphPad, USA). The significance of differences between experimental groups was analyzed using Student’s t-test, and a P-value below 0.05 was considered significant.
Results
HULC Expression in Stably Transfected U87 Cells
We constructed a gain-of-function model by transfecting U87 cells with lncRNA HULC and transfecting control U87 cells with an empty vector. Our qRT-PCR results indicated that transfection with lncRNA HULC led to significant upregulation of HULC (Figure 1A).
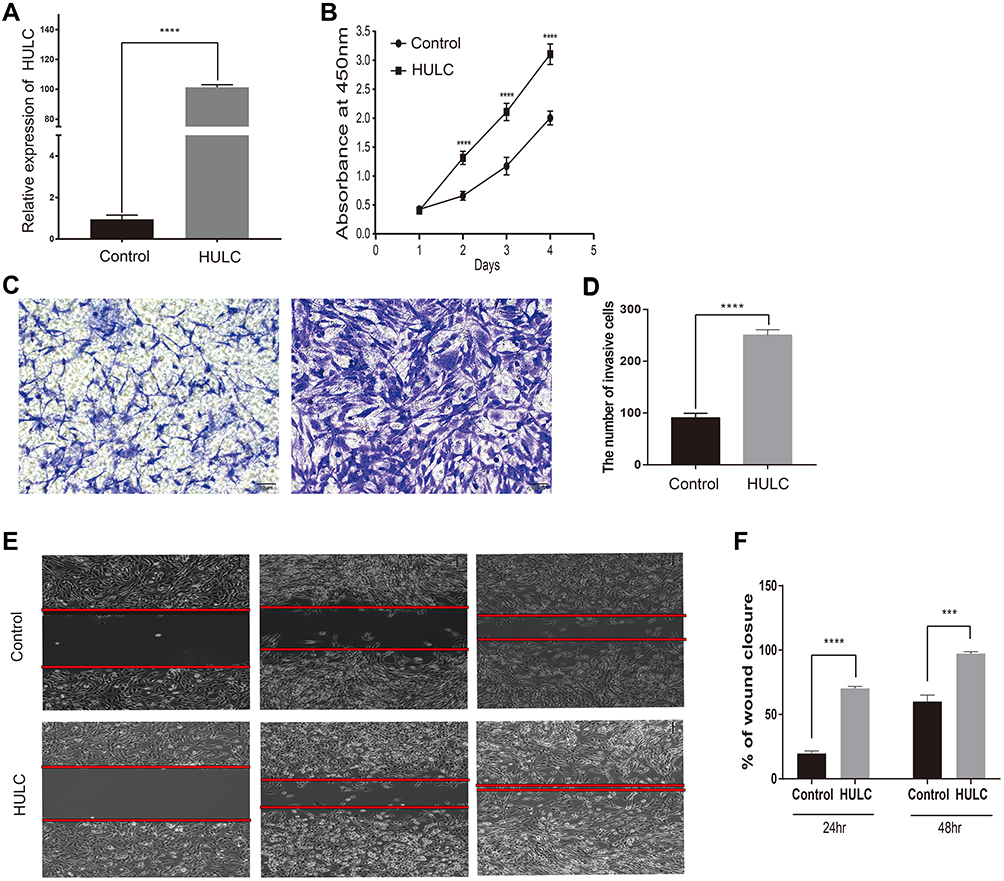 |
Figure 1 LncRNA HULC promoted the malignant behaviors of GBM cells. Notes: (A) U87 cells were used to construct gain-of-function model, and the overexpression level of lncRNA HULC was detected by qRT-PCR. (B) Overexpressing HULC promoted proliferation rates of U87 cells reflected by CCK-8 assay. (C–D) Overexpressing HULC promoted invasion of U87 cells reflected by Transwell assay. (E–F) Overexpressing HULC promoted migration of U87 cells reflected by Transwell assay. Three independent experiments were performed. (P<0.05, Student’s t-test) (***P < 0.001, ****P < 0.0001). Abbreviations: LncRNA, long noncoding RNA; HULC, highly upregulated in liver cancer; qRT-PCR, quantitative reverse transcription polymerase chain reaction; CCK-8, Cell Counting Kit-8. |
Functional Effects of HULC Overexpression
Previous studies reported upregulation of HULC in GBM cell lines and tissues, but the mechanism and impact of HULC on GBM pathophysiology are still unclear. Thus, we analyzed the effect of HULC overexpression on the proliferation of U87 cells using the CCK-8 assay. The results showed that overexpression of HULC significantly increased cell proliferation (Figure 1B). We performed the transwell assay and the wound-scratch assay to evaluate the effect of HULC on invasion and migration of these cells. The results showed that cells with HULC overexpression had significantly increased invasion (91.00 ± 2.65 vs 254.30 ± 4.33, P < 0.05; Figure 1C and D) and more rapid wound closure (ie, increased migration; Figure 1E and F). These data indicate that HULC upregulation in U87 cells promoted cell proliferation, invasion, and migration.
Screening of HULC-Regulated Proteins Using Quantitative Proteomics
We further examined the molecular mechanism of lncRNA HULC in regulating GBM by using quantitative proteomics to profile the DEPs in cells with HULC upregulation. The results of the LC-MS/MS analysis identified 5312 proteins, and quantitative data were available for 4630 proteins. Cells with upregulation of HULC had 115 proteins with significantly altered expression (at least 1.5-fold increase or 0.67-fold decrease, P < 0.05), with 37 upregulated proteins and 78 downregulated proteins (Figure 2).
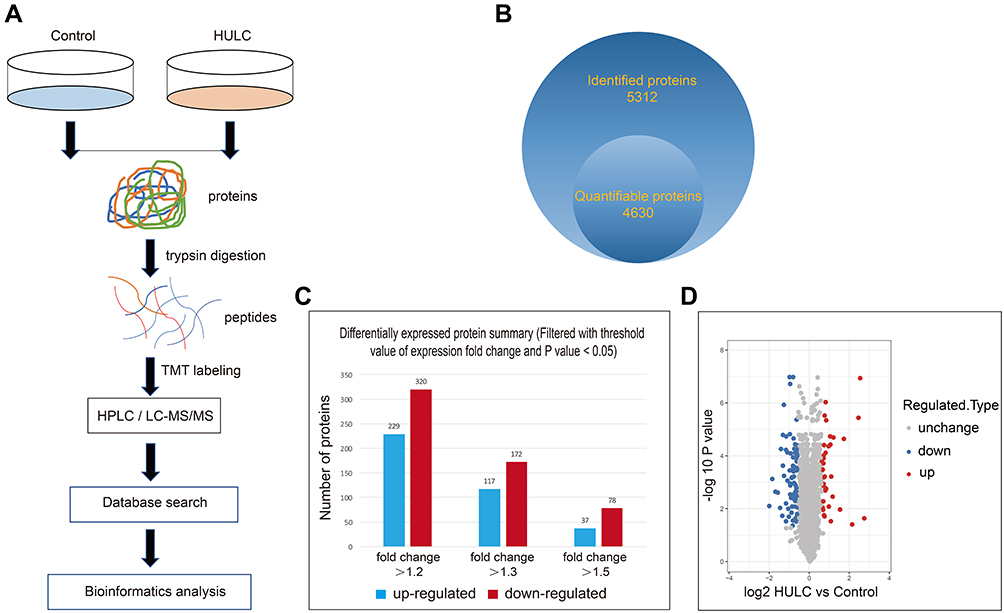 |
Figure 2 Quantitative proteomic identification of HULC-regulated proteins in U87 cells. Notes: (A) Workflow for quantitative proteomic identification of HULC-regulated proteins. (B) The Venn diagram showed the number of proteins quantified. (C) The number of DEPs at different multiples. (D) The volcano plot showed the relationship between the up-regulated DEPs and down-regulated DEPs (>1.5-fold change). Abbreviations: HULC, highly upregulated in liver cancer; DEPs, differentially expressed proteins. |
Functional Classification and Annotation of DEPs
We next evaluated the biological functions of these 115 DEPs by analysis of subcellular localization, Clusters of Orthologous Groups/EuKaryotic Orthologous Groups (COG/KOG) functional classification, and GO analysis. Analysis of subcellular localization showed that the DEPs were widely distributed in the nucleus, cytoplasm, plasma membrane, and extracellular space (Figure 3A). COG/KOG classification indicated the top five functions were signal transduction mechanisms, general function prediction only, cytoskeleton, nucleotide transport, and metabolism and extracellular structures (Figure 3B). GO analysis and annotation classified these 115 proteins into three categories: biological process, cellular component, and molecular function. These results indicate that the proteins resulted by HULC participate in multiple foundational biological processes and have a wide range of molecular functions (Figure 3C).
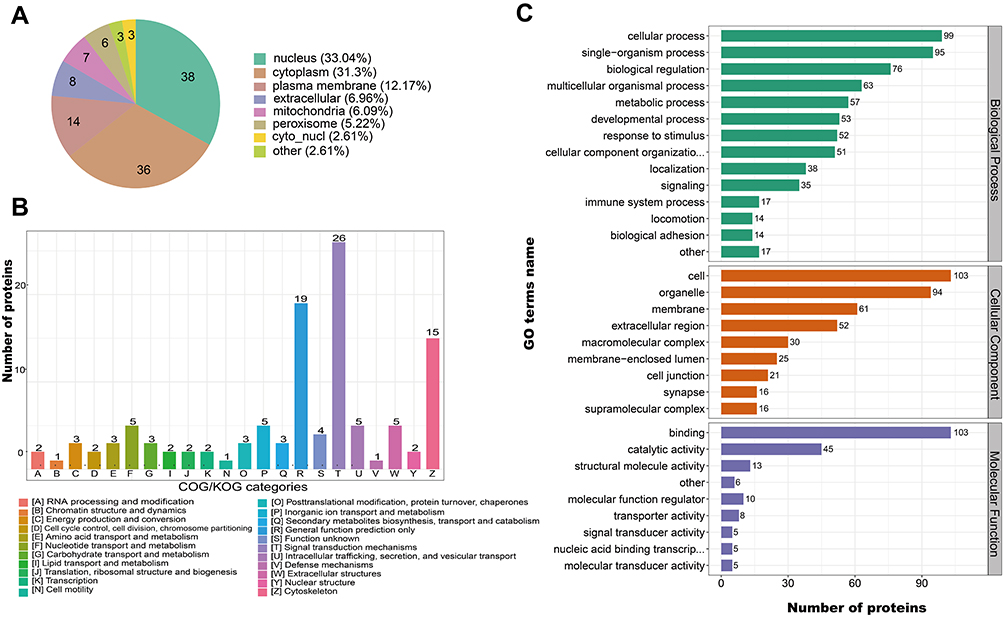 |
Figure 3 Subcellular localization, COG/KOG and GO analysis of DEPs to classify and annotate it. Notes: (A) Subcellular localization of DEPs after HULC overexpression; (B) COG/KOG functional classification of DEPs after HULC overexpression; (C) GO analysis of DEPs after HULC overexpression. Abbreviations: HULC, highly upregulated in liver cancer; DEPs, differentially expressed proteins; COG/KOG, Clusters of Orthologous Groups/Clusters of orthologous groups for euKaryotic complete genomes; GO, Gene Ontology. |
Functional Enrichment Analysis of HULC-Interacting Proteins
We compared the correlation of differential protein functions in cells with overexpression of HULC using clustering analysis based on GO enrichment. The results for biological process indicated that the upregulated proteins were related to fatty acid derivative transport, and the downregulated proteins were related to nervous system development, regulation of neural precursor cell proliferation, and regulation of nervous system development (Figure 4A and B). The results for analysis cellular components indicated that the upregulated proteins were related to vesicle and the extracellular region, and the downregulated proteins were related to the plasma membrane and myofibrils (Figure 4C and D). The results for molecular function indicated that the upregulated proteins were related to oxidoreductase activity and catalytic activity, and the down-regulated proteins were related to actin binding and cytoskeletal protein binding (Figure 4E and F). Moreover, KEGG pathway analysis demonstrated that these 115 DEPs function in some fundamental biological pathways, including regulation of the actin cytoskeleton, the Ras signaling pathway, and the PI3K/Akt signaling pathway (Figure 5A and B). Taken together, these results suggest that ncRNA HULC has important regulatory roles in multiple fundamental biological processes of GBM cells.
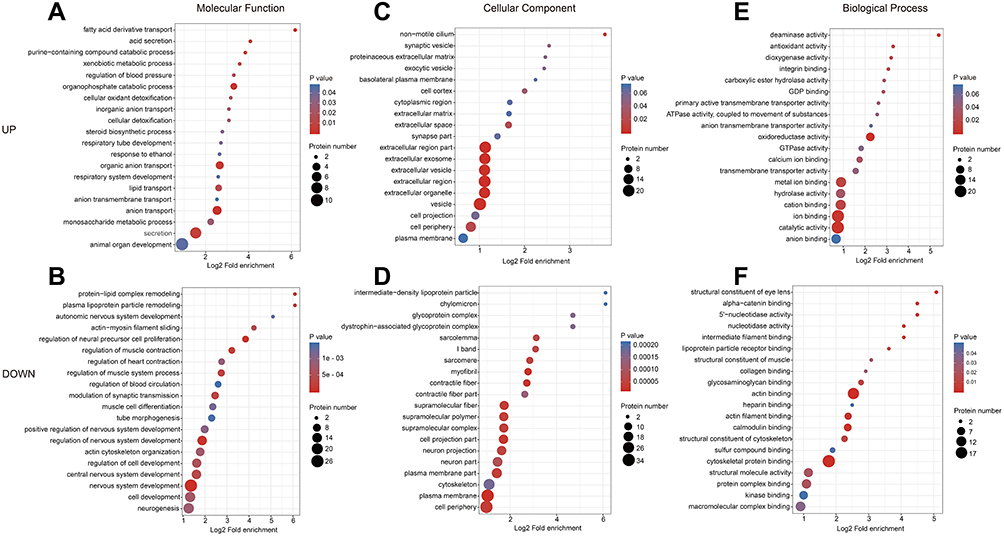 |
Figure 4 GO enrichment analysis of the DEPs in response to lncRNA HULC overexpression in U87 cells. Notes: A comprehensive bubble plot for enrichment analysis of the GO functional categories: (A–B) enrichment of biological process; (C–D) enrichment of cellular compartment; (E–F) enrichment of molecular function. Abbreviations: HULC, highly upregulated in liver cancer; DEPs, differentially expressed proteins; GO, Gene Ontology. |
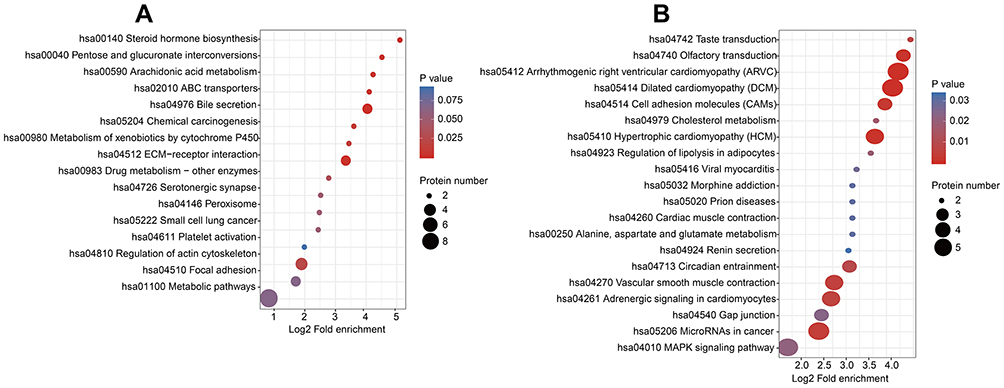 |
Figure 5 KEGG pathway enrichment analysis of DEPs in lncRNA HULC-overexpressed U87 cells. Notes: A comprehensive bubble plot for enrichment analysis of the KEGG pathway: (A) Pathways enrichment of upregulated DEPs; (B) Pathways enrichment of downregulated DEPs. Abbreviations: HULC, highly upregulated in liver cancer; DEPs, differentially expressed proteins; KEGG, Kyoto Encyclopedia of Genes and Genomes. |
Validation of Quantitative Proteomics Results Using PRM and Western Blotting
We then performed PRM analysis to validate the DEPs identified by quantitative proteomics.20 We selected 10 proteins for this analysis, and successfully quantitated and confirmed 8 proteins; 4 proteins were downregulated and 4 were upregulated (Table 1). We selected these proteins for their functional significance based on proteome analysis, and included proteins such as RRAS, which are related to tumor growth and invasion. The PRM and TMT-label quantification results were highly consistent, and the PRM results had good correlation with the proteomics results. Our Western blotting examination of the expression of RRAS in GBM U87 cells indicated that HULC overexpression led to upregulation of this protein, corresponding to the quantitative proteomics data (Table 1 and Figure 6).
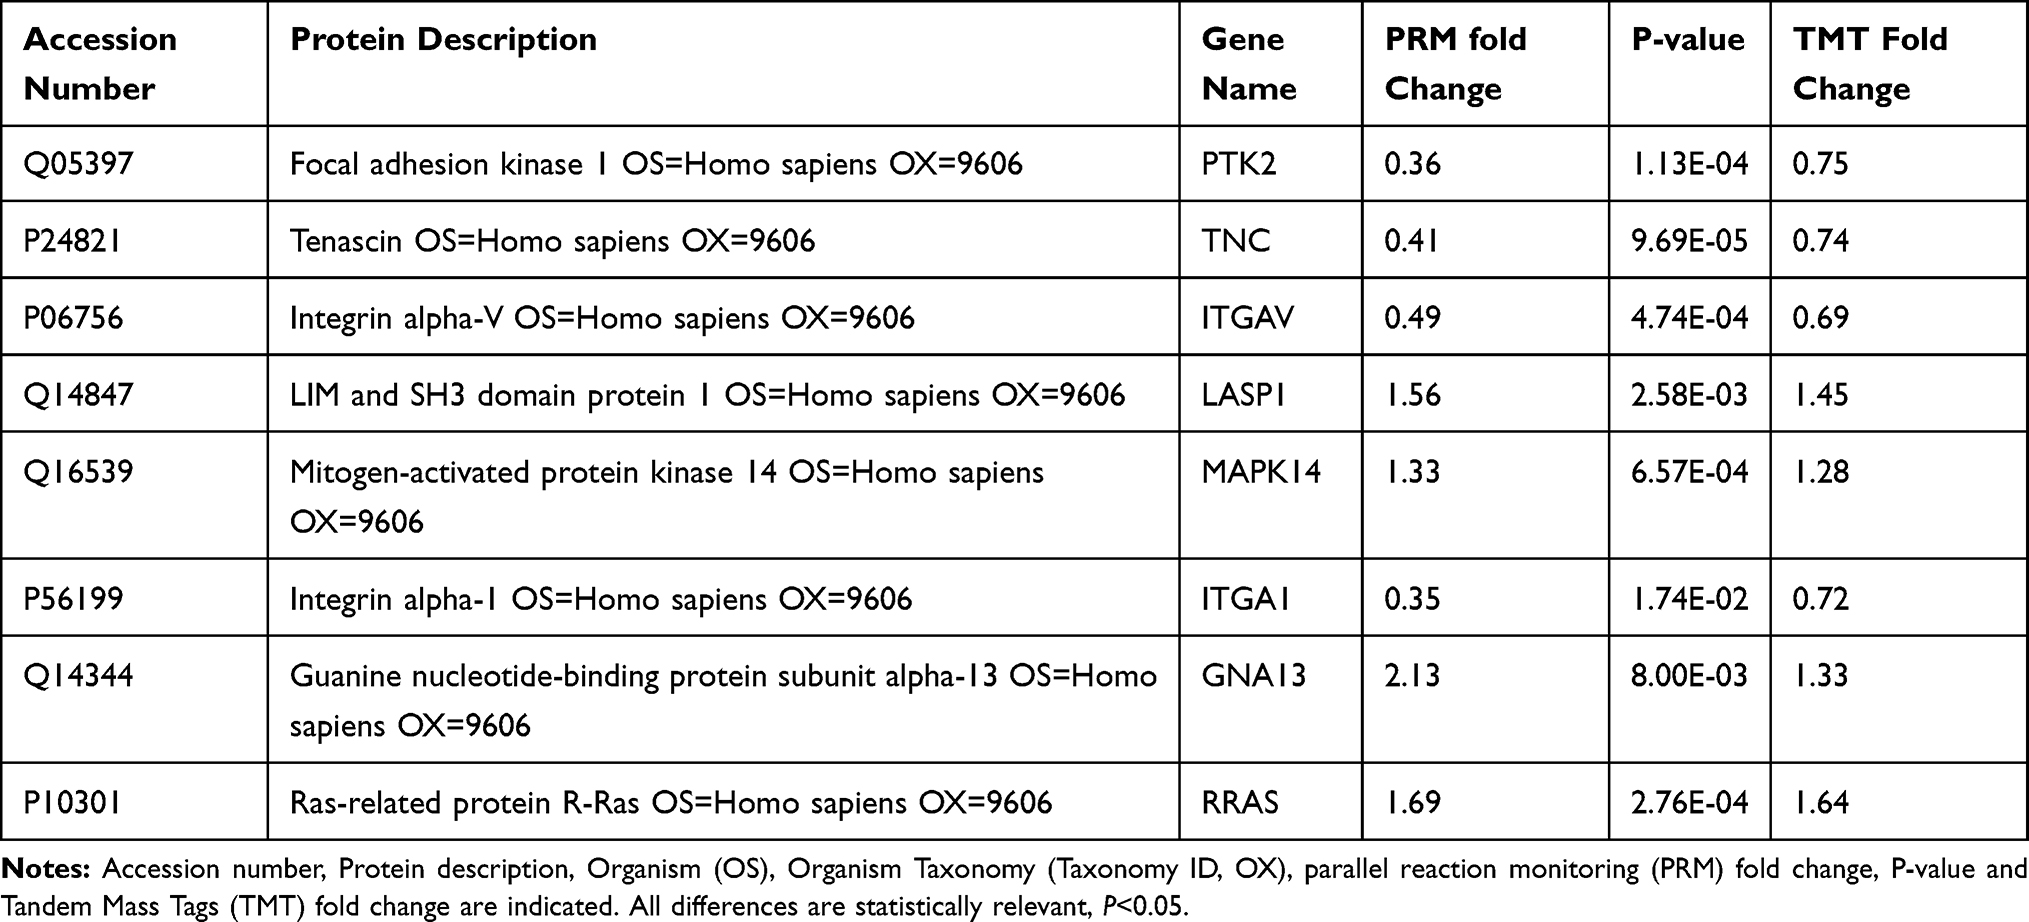 |
Table 1 Quantitative Results of Differentially Expressed Proteins by PRM and TMT-Label |
 |
Figure 6 lncRNA HULC upregulated protein levels of RRAS in U87 cells. Notes: Western blot analysis of RRAS protein level in U87 cells transfected with HULC or empty vector (Control). (P<0.05, Student’s t-test) (**P <0.01). Abbreviations: HULC, highly upregulated in liver cancer; RRAS, ras-related protein. |
Discussion
There is substantial evidence that dysregulation of lncRNAs promotes the tumorigenesis of multiple cancers, including GBM, and increasing evidence suggests that that lncRNA upregulation promotes GBM growth, apoptosis, migration, and invasion.21,22 Recent research indicated that lncRNA HULC plays important roles in the tumorigenesis of multiple human cancers. In particular, lncRNA HULC promotes lung squamous cell carcinoma by upregulating the PTPRO/NF-κB signaling pathway23 and it promotes the progression of osteosarcoma via the “sponging” function of miR-215.24 Other research indicated that downregulation of lncRNA HULC inhibited the proliferation, migration, and hormone secretion of GH3 cells in rat pituitary adenomas by interacting with miR-130b, downregulating FOXM1, and suppressing the PI3K/AKT pathways.25 Therefore, a systematic analysis of changes in protein expression after lncRNA HULC overexpression can provide insight into the mechanism of its downstream effects in GBM.
In the present study, we found that upregulation of lncRNA HULC significantly promoted the proliferation, migration, and invasion of GBM cells, consistent with our previous study.14 However, the mechanisms underlying these effects were heretofore unknown. Therefore, we determined global proteome profiles of GBM cells that had lncRNA HULC overexpression to screen for the potential regulatory targets of this lncRNA. Our results indicated the differential expression of 115 proteins in U87 cells that had HULC overexpression. Bioinformatic analyses indicated that many of these DEPs functioned in biological processes, cellular components, molecular functions, subcellular locations, and signaling pathways.
Our GO and KEGG pathway enrichment analysis indicated that the DEPs identified here were enriched in several fundamental molecular functions and biological regulatory pathways, some of which are closely related to the malignant phenotype. Analysis of subcellular locations showed that the DEPs were mainly in the cytoplasm and nucleus. GO analysis showed that these DEPs were associated with vesicles and extracellular regions and functioned in catalytic activity and ion binding. KEGG pathway analysis showed that the DEPs functioned in a variety of important signaling pathways (MAPK signaling and Ras signaling), in metabolic pathways, in regulation of the actin cytoskeleton, in extracellular matrix (ECM) -receptor interactions, and in conjunction with cell adhesion molecules. The ECM provides a niche for tumorigenesis, in that it provides mechanical support and mediates cell-microenvironment interactions.26 Genetic alterations and epigenetic modifications of cancer cells lead to abnormal regulation of cellular metabolic pathways.27 Our activation of these signaling pathways by lncRNA HULC allowed identification of the role of this lncRNA in several important pathological responses of GBM cells, including migration, invasion and proliferation.
Although we did not directly determine activation of the PI3K/AKT pathway by overexpression of HULC, we identified the presence of activation upstream and downstream of this pathway. Thus, our results are consistent with the interpretation that lncRNA HULC regulates the PI3K/AKT pathway, although we agree with Liu et al that most studies of HCC diagnosis have examined small samples size, and the analyzing method even in same platforms still varies.28 Activation of PI3K/AKT signaling occurs in a variety of cancer cells, including GBM. Miao et al concluded that PI3K/AKT signaling was the key driver of abnormal cell proliferation, differentiation, and invasion of GBM tumor cells.29 Activation of AKT phosphorylates a variety of downstream targets, such as the Bcl-2 family proteins and cyclin G1, which have important effects on cell survival, proliferation, and apoptosis.30
Our in-depth proteomics study focused on RRAS, which was obviously upregulated in GBM cells that had HULC overexpression. Our enrichment analysis suggested that RRAS plays a regulatory role in biological functions and pathways in GBM cells. Further, we confirmed the identity of proteins with differential expression by PRM and Western blotting, thus validating our quantitative proteomics results. RRAS is a small guanosine triphosphate hydrolase (GTPase) of the Ras family that regulates cell survival and integrin activity,31 but is less well-characterized than the classical RAS proteins (KRAS, HRAS, and NRAS).32 The role of RRAS in cancer is controversial, in that some researchers consider RRAS to be a tumor suppressor33 and others reported that it promotes tumor cell proliferation, migration, and invasion.34 RRAS may inhibit VEGF receptor activation and lead to the normalization of tumor vasculature.34 RRAS activates the PI3K/AKT pathway and promotes tumor growth in cervical epithelial cells.35 Another study showed that MAPK phosphorylated the C-terminal serine (Ser-201) of RRAS and activates this protein, indicating that RRAS promotes oncogenesis.36 RRAS also regulates integrin and cell adhesion as defining biological functions,37 plays a key role in regulation of the actin cytoskeleton and membrane protrusion between cancer cell diffusion and migration, and also appears to regulate vesicle trafficking and mediate cell migration by regulating Rac and Rho activity via the integrins.38 Lysine fatty acylation promotes the plasma membrane localization of R-Ras2 and its interaction with PI3K, leading to activated Akt and increased cell proliferation.39 These multiple effects of RRAS are closely associated with tumorigenesis and tumor progression, and confirm the role of this protein in carcinogenesis.
There were a few limitations in our study. First, we only used Western blotting to detect RRAS, and these results may not apply to all of the DEPs identified here. However, we used PRM to validate 10 DEPs, and the results for 8 of these proteins were highly consistent with TMT-label quantification results, confirming their reliability. Second, the goal of the current study was to examine the overall impact of upregulation of lncRNA HULC on GBM cells. Therefore, a subsequent in-depth study of the effects of HULC knockdown on downstream pathways and cell functions is needed to confirm our interpretations. Nonetheless, our results provide a foundation for further research and a more in-depth analysis of these targets. We are currently planning a series of lncRNA HULC knockdown experiments to more specifically address these issues.
Conclusion
We performed a quantitative proteomics analysis to identify the downstream effectors of lncRNA HULC in GBM cells. Our data showed that GBM cells which overexpressed lncRNA HULC had increased expression of RRAS. This suggests that lncRNA HULC has a critical role in promoting the progression of GBM by upregulation of RRAS, and indicates the complexity of the response to lncRNA HULC upregulation. Our proteomics results suggest new possible strategies for the diagnosis and treatment of GBM.
Acknowledgments
The present study was supported by the National Natural Science Foundation of China (no. 81872055).
Disclosure
The authors report no conflicts of interest in this work.
References
1. Gupta MK, Polisetty RV, Sharma R, et al. Altered transcriptional regulatory proteins in glioblastoma and YBX1 as a potential regulator of tumor invasion. Sci Rep. 2019;9(1):10986. doi:10.1038/s41598-019-47360-9
2. Towner RA, Smith N, Saunders D, et al. OKN-007 Increases temozolomide (TMZ) sensitivity and suppresses TMZ-resistant glioblastoma (GBM) tumor growth. Transl Oncol. 2019;12(2):320–335. doi:10.1016/j.tranon.2018.10.002
3. Tang X, Xu P, Wang B, et al. Identification of a specific gene module for predicting prognosis in glioblastoma patients. Front Oncol. 2019;9:812. doi:10.3389/fonc.2019.00812
4. Tang C, Wang Y, Zhang L, et al. Identification of novel LncRNA targeting Smad2/PKCα signal pathway to negatively regulate malignant progression of glioblastoma. J Cell Physiol. 2020;235(4):3835–3848. doi:10.1002/jcp.29278
5. Wang B, Tang D, Zhang Z, Wang Z. Identification of aberrantly expressed lncRNA and the associated TF‐mRNA network in hepatocellular carcinoma. J Cell Biochem. 2020;121(2):1491–1503. doi:10.1002/jcb.29384
6. Zhang J, Zhang X, Piao C, et al. A long non-coding RNA signature to improve prognostic prediction in clear cell renal cell carcinoma. Biomed Pharmacother. 2019;118:109079. doi:10.1016/j.biopha.2019.109079
7. Zhang L, Wang H, Xu M, et al. Long noncoding RNA HAS2‐AS1 promotes tumor progression in glioblastoma via functioning as a competing endogenous RNA. J Cell Biochem. 2019;121(1):661–671. doi:10.1002/jcb.29313
8. Liao K, Lin Y, Gao W, et al. Blocking lncRNA MALAT1/miR-199a/ZHX1 axis inhibits glioblastoma proliferation and progression. Mol Ther Nucleic Acids. 2019;18:388–399. doi:10.1016/j.omtn.2019.09.005
9. Zhang T, Wan C, Mei X, Jia P, Wang M. Long non-coding RNA HULC promotes progression of bone neoplasms. Med Sci Monit. 2018;24:5754–5760. doi:10.12659/MSM.910220
10. Huang L, Wang Y, Chen J, et al. Long noncoding RNA PCAT1, a novel serum-based biomarker, enhances cell growth by sponging miR-326 in oesophageal squamous cell carcinoma. Cell Death Dis. 2019;10(7):513. doi:10.1038/s41419-019-1745-4
11. Panzitt K, Tschernatsch MMO, Guelly C, et al. Characterization of HULC, a novel gene with striking up-regulation in hepatocellular carcinoma, as noncoding RNA. Gastroenterology. 2007;132(1):330–342. doi:10.1053/j.gastro.2006.08.026
12. Liu L, Zhou X, Zhang J, et al. LncRNA HULC promotes non-small cell lung cancer cell proliferation and inhibits the apoptosis by up-regulating sphingosine kinase 1 (SPHK1) and its downstream PI3K/Akt pathway. Eur Rev Med Pharmacol. 2018;22(24):8722.
13. Xin L, Zhou Q, Yuan Y, et al. METase/lncRNA HULC/FoxM1 reduced cisplatin resistance in gastric cancer by suppressing autophagy. J Cancer Res Clin. 2019;145(10):2507–2517. doi:10.1007/s00432-019-03015-w
14. Dong Y, Wei M, Lu J, Bi C. Long non-coding RNA HULC interacts with miR-613 to regulate colon cancer growth and metastasis through targeting RTKN. Biomed Pharmacother. 2019;109:2035–2042. doi:10.1016/j.biopha.2018.08.017
15. Yan H, Tian R, Zhang M, Wu J, Ding M, He J. High expression of long noncoding RNA HULC is a poor predictor of prognosis and regulates cell proliferation in glioma. Onco Targets Ther. 2017;10:113–120. doi:10.2147/OTT.S124614
16. Zhu Y, Zhang XB, Qi LS, et al. HULC long noncoding RNA silencing suppresses angiogenesis by regulating ESM-1 via the PI3K/Akt/mTOR signaling pathway in human gliomas. Oncotarget. 2016;7(12):14429–14440. doi:10.18632/oncotarget.7418
17. Wu Y, Xiong Q, Li S, Yang X, Ge F. Integrated proteomic and transcriptomic analysis reveals long noncoding RNA HOX transcript antisense intergenic RNA (HOTAIR) promotes hepatocellular carcinoma cell proliferation by regulating opioid growth factor receptor (OGFr). Mol Cell Proteomics. 2018;17(1):146–159. doi:10.1074/mcp.RA117.000277
18. Cui Y, He L, Yang C, Ye Q. iTRAQ and PRM-based quantitative proteomics in early recurrent spontaneous abortion: biomarkers discovery. Clin Proteom. 2019;16(1):36. doi:10.1186/s12014-019-9256-y
19. Chen R, Liu Y, Zhuang H, et al. Quantitative proteomics reveals that long non-coding RNA MALAT1 interacts with DBC1 to regulate p53 acetylation. Nucleic Acids Res. 2017;45(17):9947–9959. doi:10.1093/nar/gkx600
20. Meneses-Romero E, Hernández-Orihuela L, Pando-Robles V, et al. Quantitative proteomic analysis reveals high interference on protein expression of H9c2 cells activated with glucose and cardiotonic steroids. J Proteomics. 2020;211:103536. doi:10.1016/j.jprot.2019.103536
21. Ji Y, Gu Y, Hong S, Yu B, Zhang JH, Liu JN. Comprehensive analysis of lncRNA‐TF crosstalks and identification of prognostic regulatory feedback loops of glioblastoma using lncRNA/TF‐mediated ceRNA network. J Cell Biochem. 2019;121(1):755–767. doi:10.1002/jcb.29321
22. Tian S, Liu W, Pan Y, Zhan S. Long non-coding RNA Linc00320 inhibits glioma cell proliferation through restraining Wnt/β-catenin signaling. Biochem Bioph Res Co. 2019;508(2):458–464. doi:10.1016/j.bbrc.2018.11.101
23. Xu Y, Li J, Wang P, Zhang Z, Wang X. LncRNA HULC promotes lung squamous cell carcinoma by regulating PTPRO via NF‐κB. J Cell Biochem. 2019;120(12):19415–19421. doi:10.1002/jcb.29119
24. Kong DL, Wang Y. Knockdown of lncRNA HULC inhibits proliferation, migration, invasion and promotes apoptosis by sponging miR-122 in osteosarcoma. J Cell Biochem. 2018;119(1):1050–1061. doi:10.1002/jcb.26273
25. Rui QH, Ma JB, Liao YF, Dai JH, Cai ZY. Effect of lncRNA HULC knockdown on rat secreting pituitary adenoma GH3 cells. Braz J Med Biol Res. 2019;52(4):e7728. doi:10.1590/1414-431x20197728
26. Han B, Yang X, Zhang P, et al. DNA methylation biomarkers for nasopharyngeal carcinoma. PLoS One. 2020;15(4):e0230524. doi:10.1371/journal.pone.0230524
27. Petchampai N, Isoe J, Horvath TD, et al. Mass spectrometry-based stable-isotope tracing uncovers metabolic alterations in pyruvate kinase-deficient Aedes aegypti mosquitoes. Insect Biochem Mol Biol. 2020;121:103366. doi:10.1016/j.ibmb.2020.103366
28. Liu XN, Cui DN, Li YF, et al. Multiple “Omics” data-based biomarker screening for hepatocellular carcinoma diagnosis. World J Gastroenterol. 2019;25(30):4199–4212. doi:10.3748/wjg.v25.i30.4199
29. Miao L, Jiang Z, Wang J, et al. Epithelial membrane protein 1 promotes glioblastoma progression through the PI3K/AKT/mTOR signaling pathway. Oncol Rep. 2019;42(2):605–614. doi:10.3892/or.2019.7204
30. Yang Z, Li G, Ding C, et al. Long non-coding RNA HULC exerts oncogenic activity on papillary thyroid cancer and. Artif Cells Nanomed Biotechnol. 2020;48(1):326–335. doi:10.1080/21691401.2019.1703730
31. Sanz-Rodriguez M, Gruart A, Escudero-Ramirez J, et al. R-ras1 and r-ras2 are essential for oligodendrocyte differentiation and survival for correct myelination in the central nervous system. J Neurosci. 2018;38(22):5096–5110. doi:10.1523/JNEUROSCI.3364-17.2018
32. Arora PD, He T, Ng K, et al. The leucine-rich region of Flightless I interacts with R-ras to regulate cell extension formation. Mol Biol Cell. 2018;29(20):2481–2493. doi:10.1091/mbc.E18-03-0147
33. Liu WN, Yan M, Chan AM. A thirty-year quest for a role of R-Ras in cancer: from an oncogene to a multitasking GTPase. Cancer Lett. 2017;403:59–65. doi:10.1016/j.canlet.2017.06.003
34. Perrot CY, Sawada J, Komatsu M. Prolonged activation of cAMP signaling leads to endothelial barrier disruption via transcriptional repression of RRAS. FASEB J. 2018;32(11):5793–5812. doi:10.1096/fj.201700818RRR
35. Mora N, Rosales R, Rosales C. R-Ras promotes metastasis of cervical cancer epithelial cells. Cancer Immunol. 2007;56(4):535–544. doi:10.1007/s00262-006-0205-z
36. Frémin C, Guégan J, Plutoni C, et al. ERK1/2-induced phosphorylation of R-Ras GTPases stimulates their oncogenic potential. Oncogene. 2016;35(43):5692–5698. doi:10.1038/onc.2016.122
37. Chiara SFCD. The R-Ras/RIN2/Rab5 complex controls endothelial cell adhesion and morphogenesis via active integrin endocytosis and Rac signaling. Cell Res. 2012;22(10):1479–1501. doi:10.1038/cr.2012.110
38. Ada Nguema AS, Xenias H, Hofman JM, et al. The small GTPase R-Ras regulates organization of actin and drives membrane protrusions through the activity of PLC. J Cell Sci. 2006;119(Pt 7):1307–1319. doi:10.1242/jcs.02835
39. Zhang X, Spiegelman NA, Nelson OD, Jing H, Liu H. SIRT6 regulates Ras-related protein R-Ras2 by lysine defatty-acylation[J]. eLife. 2017;6:
 © 2020 The Author(s). This work is published and licensed by Dove Medical Press Limited. The
full terms of this license are available at https://www.dovepress.com/terms
and incorporate the Creative Commons Attribution
- Non Commercial (unported, 3.0) License.
By accessing the work you hereby accept the Terms. Non-commercial uses of the work are permitted
without any further permission from Dove Medical Press Limited, provided the work is properly
attributed. For permission for commercial use of this work, please see paragraphs 4.2 and 5 of our Terms.
© 2020 The Author(s). This work is published and licensed by Dove Medical Press Limited. The
full terms of this license are available at https://www.dovepress.com/terms
and incorporate the Creative Commons Attribution
- Non Commercial (unported, 3.0) License.
By accessing the work you hereby accept the Terms. Non-commercial uses of the work are permitted
without any further permission from Dove Medical Press Limited, provided the work is properly
attributed. For permission for commercial use of this work, please see paragraphs 4.2 and 5 of our Terms.