Back to Journals » Clinical Ophthalmology » Volume 16
Quantitative OCT Angiography Assessment of the Effect of Peribulbar Anesthesia on Retinal Microvasculature in Primary Open-Angle Glaucoma Patients Undergoing Cataract Surgery
Authors Awwad MA ![]() , Masoud M
, Masoud M ![]() , Elhadad MA
, Elhadad MA ![]()
Received 13 April 2022
Accepted for publication 10 June 2022
Published 20 June 2022 Volume 2022:16 Pages 2011—2024
DOI https://doi.org/10.2147/OPTH.S369969
Checked for plagiarism Yes
Review by Single anonymous peer review
Peer reviewer comments 3
Editor who approved publication: Dr Scott Fraser
Mohamed A Awwad,1 Mohamed Masoud,1 Mona Ahmed Elhadad2
1Department of Ophthalmology, Benha University Hospital, Benha, Qualubia, Egypt; 2Department of Anesthesia and Surgical Intensive Care, Benha University Hospital, Benha, Qualubia, Egypt
Correspondence: Mohamed A Awwad, Department of Ophthalmology, Benha University Hospital, Benha, Qualubia, Egypt, Tel +20 1017014208, Email [email protected]; [email protected]
Objective: To assess the effect of peribulbar anesthesia on retinal microvasculature in primary open-angle glaucoma (POAG) patients undergoing cataract surgery using OCT Angiography.
Participants: Forty-nine patients undergoing cataract surgery were divided into two groups. Group I included patients with no history of glaucoma, while group II included patients previously diagnosed as POAG with controlled IOP. Each participant received 6 mL of peribulbar anesthetic injection of 4 mL lidocaine 2% containing 150 IU hyaluronidase and 2 mL bupivacaine 0.5%. They were scanned with the OCT-A 10 minutes before and 10 minutes after injection for foveal deep (DCP), superficial (SCP) capillary plexuses density and total vessel density, foveal avascular zone (FAZ) diameter, optic disc total vessel density, and radial peripapillary capillary (RPC) network density. In addition, IOP was checked before and 10 minutes after injection.
Results: Median percent change in DCP post-injection was significantly greater in group II (− 43%) than in group I (− 2.5%) (P < 0.001). Also, DCP total density median percent change post-injection was significantly higher in group II (− 21%) than in group I (− 0.9%) (P < 0.001). Foveal SCP vessel density and total vessel density median percent change post-injection were − 62.6% and − 16.2%, respectively, in group II and were − 2.6% and − 1.1%, respectively, in group I, which are statistically significant (P < 0.001). The FAZ diameter median percentage change post-injection was higher in group II (40.6%) than in group I (2.5%) (P < 0.001). Optic disc total vessel density and radial peripapillary capillary (RPC) network density post-injection median percent change were significantly higher in group II (− 13.6%) and (− 13.1%) respectively than in group I (− 1.1%) and (− 1.25%) respectively (P < 0.001).
Conclusion: Peribulbar anesthesia harbors a deleterious ischemic effect on the retinal vascular tree of glaucoma patients, which could harmfully affect the vision and the visual field in those vulnerable patients.
Keywords: peribulbar, anesthesia, glaucoma, IOP, OCT-A, retinal blood flow
Summary
Primary Outcome: We aimed to evaluate the effect of local peribulbar anesthesia on the retinal microvascular tree using the OCT-A. We compared that effect in patients with glaucoma to those without glaucoma.
Secondary Outcome: We monitored the change in IOP pre- and post-peribulbar anesthesia injection. We also monitored patients’ heart rate, blood pressure, and respiratory rate during anesthesia injection.
Introduction
Local anesthesia techniques are widely used for ophthalmic surgeries all over the world. Those techniques include peribulbar, retrobulbar and sub-tenon blocks.1,2 Several studies have shown that the peribulbar anesthesia injection increases the intraocular pressure (IOP) with simultaneous reduction of ocular blood flow.3,4 That effect could be credited to the direct mechanical compression and the pharmacological actions of the peribulbar anesthesia.5
Glaucoma patients are known to have a reduced ocular blood flow compared to normal individuals.6 They are more vulnerable to hemodynamic alterations due to impaired retinal vessel autoregulation, which plays a significant role in the pathology of glaucoma optic neuropathy.7
Researchers used many techniques to assess the ocular blood flow. For instance, laser Doppler flowmetry (LDF), retinal function imager (RFI), laser speckle contrast imaging (LSCI), magnetic resonance imaging (MRI), optical coherence tomography angiography (OCT-A), pulsatile ocular blood flowmeter (POBF), fundus pulsation amplitude (FPA), color Doppler imaging (CDI), and Doppler optical coherence tomography (DOCT) are among those tools.8
Optical coherence tomography angiography (OCT-A) is a non-invasive technique that can provide angiographic images of the retinal blood vessels.9–12 OCT-A can detect the movement of blood, using motion contrast to detect blood flow signal, by performing rapidly repeated scans at the exact location.13,14
In this study, we used the OCT-A to assess the effect of peribulbar anesthesia on retinal microvasculature in primary open-angle glaucoma patients undergoing cataract surgery by measuring the intraocular pressure (IOP) and retinal blood flow and vascularity.
Patients and Methods
This is an observational, cross-sectional, comparative study performed on patients undergoing cataract surgery at Benha University Hospital, Ophthalmology Department, between August 2021 and February 2022. We divided participants into two groups. Group I included patients with no history of glaucoma, while group II included patients previously diagnosed with primary open-angle glaucoma controlled with topical anti-glaucoma medications. We confirmed the diagnosis of primary open angle glaucoma in Group II patients by reviewing the visual field and OCT optic disc images recorded in their files. The regional institutional ethics review board of Benha University Hospital approved the study plan. Patient data remained confidential in compliance with HIPAA regulations and the Declaration of Helsinki.
All patients included in this study were aged 18 years or older and were planned to undergo cataract surgery. All patients in group II were confirmed to have controlled levels of IOP measured by the Goldmann applanation tonometer before surgery. In addition, they were known to be compliant with topical anti-glaucoma medications in the previous follow-up visits. The patient’s general condition was assessed against fitness for peribulbar anesthesia before participation in this study. Informed consent was obtained from each patient. We excluded patients with a known allergic reaction to the substances used in peribulbar injection, diabetic and hypertensive patients, patients with bleeding tendencies, and those with a coexisting ocular disorder that might influence the retinal vascular status, including high myopia, uveitis, infection, retinal degenerations, retinal dystrophies, and retinal vascular diseases. We also excluded patients with dense ocular media opacities and those with retinal images artifacts in which we could not get good quality OCT-A images.
All patients had cataract surgery under local peribulbar anesthesia. They received 6 mL of an anesthetic mixture of 4 mL lidocaine 2% containing 150 IU hyaluronidase and 2 mL bupivacaine 0.5%. The peribulbar injection was done by the anesthetist MAE through an inferior-temporal approach in all patients while monitoring pulse, blood pressure, respiratory rate, and oxygen saturation. Gentle digital ocular massage was done immediately for 5 minutes after injection. We used 1% tropicamide eye drops to dilate the pupil before capturing the OCT-A images. Each participant was scanned with the OCT-A (OptoVue OCT-A, Fremont, CA) 10 minutes before and 10 minutes after injection of the peribulbar anesthesia. For comparison, we selected the superficial capillary plexus (SCP) slab and the deep capillary plexus (DCP) slab in 6.00×6.00 mm macular area. We also measured the foveal avascular zone (FAZ) diameter and the radial peripapillary capillary (RPC) network density in a 4.5×4.5 mm area.
Blood flow was detected by the split-spectrum amplitude-decorrelation angiography (SSADA) algorithm. In addition, Intraocular pressure (IOP) was measured for each eye 10 minutes before and 10 minutes after injection using the Goldmann applanation tonometer.
Setting: Ophthalmology department, Benha University, Egypt.
Study design: Observational, cross-sectional, comparative study.
Results
This study was conducted on patients undergoing cataract surgery at Benha University Hospital, Ophthalmology Department, between August 2021 and February 2022. Participants were divided into two groups. Group I included 26 eyes with no history of glaucoma, while group II had 23 eyes previously diagnosed as primary open-angle glaucoma controlled with topical anti-glaucoma medications.
General Characteristics
As shown in Table 1, no significant differences were observed between both groups regarding age (P = 0.258), sex (P = 0.509), spherical equivalent (P = 0.382), axial length (P = 0.482), and side (P = 0.934).
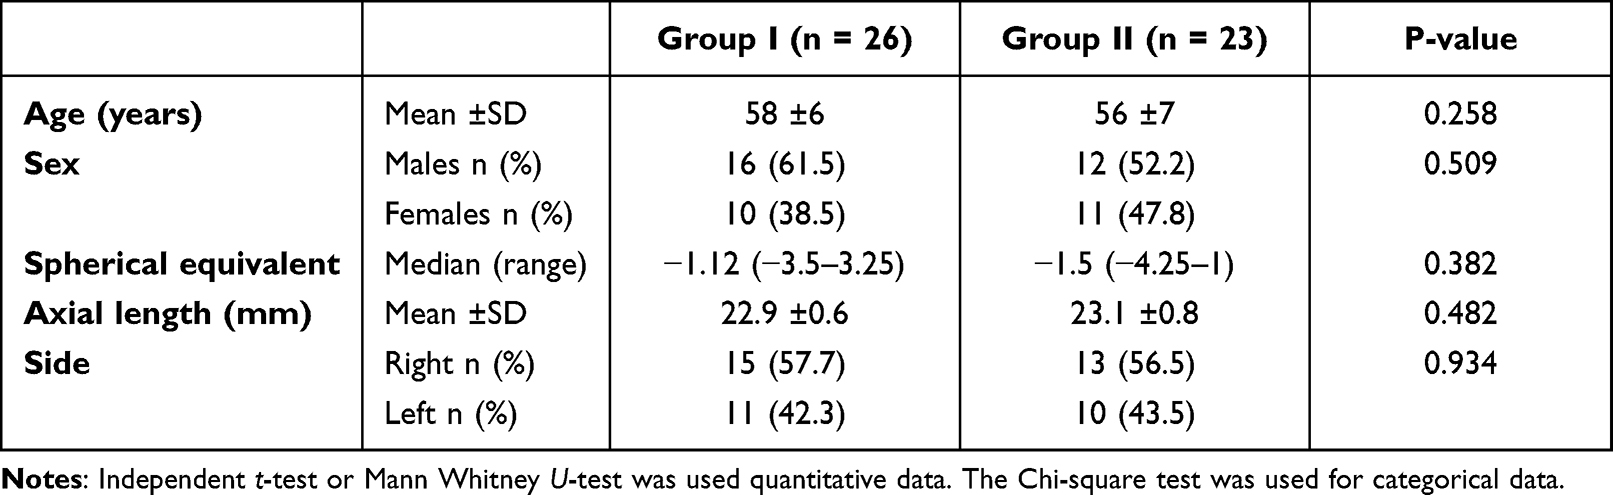 |
Table 1 General Characteristics of the Studied Groups |
Intraocular Pressure
No significant differences were noted between both groups regarding pre and post-injection IOP (P = 0.093 and 0.071, respectively). Also, the median post-injection percent change in both groups was comparable (P = 0.864) (Table 2) (Figure 1).
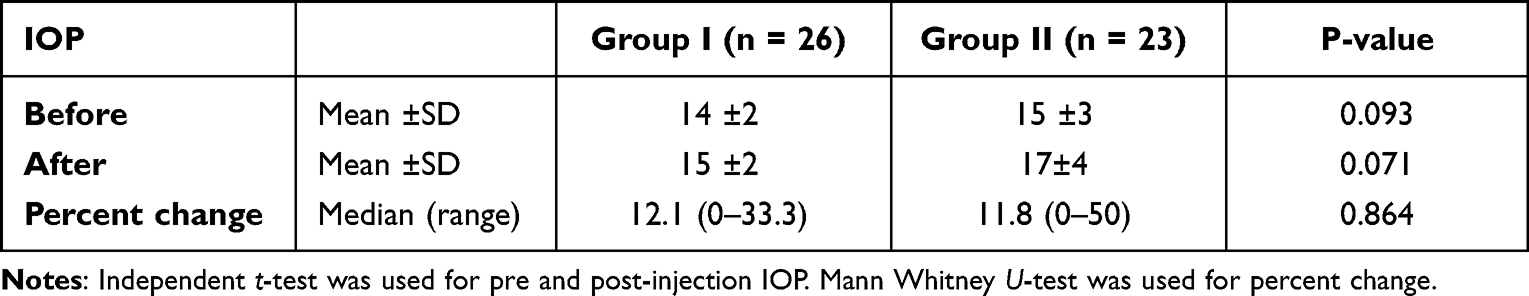 |
Table 2 Intraocular Pressure Before and After Injection |
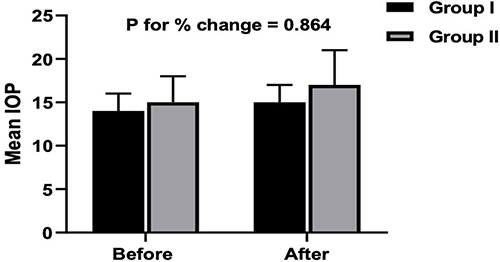 |
Figure 1 Intraocular pressure before and after anesthesia injection in both groups. |
OCT-A Parameters
No significant difference was reported in the median DCP fovea before injection (P = 1.0), while after injection, it was significantly higher in group I (11.6) than in group II (7.1) (P < 0.001). The median percent change post-injection was significantly higher in group II (−43%) than in group I (−2.5%) (P < 0.001) (Figures 2 and 3).
 |
Figure 2 OCT-A of the DCP in patient number 4 in group II before injection of peribulbar anesthesia. |
 |
Figure 3 OCT-A of the DCP of patient number 4 in group II after injection of peribulbar anesthesia. |
DCP total density was comparable in both groups before injection (P = 0.053). After injection, it was significantly higher in group I (38.6 ±3.7) than in group II (27.8 ±5.7) (P < 0.001), and the median percent change post-injection was significantly higher in group II (−21%) than in group I (−0.9%) (P < 0.001).
Before injection, FAZ showed no significant difference between both groups (P = 0.061). However, after injection, it was significantly higher in group II (0.572 ±0.042 mm2) than in group I (0.454 ±0.046 mm2), with a significantly higher median percent change post-injection in group II (40.6%) than group I (2.5%) (P < 0.001) (Figures 4 and 5).
 |
Figure 4 OCT-A of the FAZ of patient number 4 in group II before injection of peribulbar anesthesia. |
 |
Figure 5 OCT-A of the FAZ of patient number 4 in group II after injection of peribulbar anesthesia. |
Pre and post-injection ONH total vessel density were significantly higher in group I (32.1 ±2.4 and 30.7 ±6.1, respectively) (Figures 6 and 7) than in group II (29 ±1.9 and 25.3 ±4.4, respectively) (Figures 8 and 9). In addition, the median percent change post-injection was significantly higher in group II (−13.6%) than in group I (−1.1%) (P < 0.001).
 |
Figure 6 OCT-A of the ONH and peripapillary area of patient number 6 in group I before injection of peribulbar anesthesia. |
 |
Figure 7 OCT-A of the ONH and peripapillary area of patient number 6 in group I after injection of peribulbar anesthesia. |
 |
Figure 8 OCT-A of the ONH and peripapillary area of patient number 4 in group II before injection of peribulbar anesthesia. |
 |
Figure 9 OCT-A of the ONH and peripapillary area of patient number 4 in group II after injection of peribulbar anesthesia. |
In both groups, ONH peripapillary density was comparable before injection (P = 0.637). However, after surgery, it was significantly higher in group I (27.4 ±2.5) than in group II (23.4 ±3.7) (P < 0.001), with a significantly higher median percent change post-injection in group II (−13.1%) than group I (−1.25) (P < 0.001).
The median pre-injection SCP fovea was significantly higher in group I (9.4) than in group II (7.3) (P = 0.017). Also, post-injection, it was significantly higher in group I (9.3) than in group II (1.9) (P < 0.001). The median percent change post-injection was significantly higher in group II (−62.6%) than in group I (−2.6%) (P <0.001) (Figures 10 and 11).
 |
Figure 10 OCT-A of the SCP of patient number 4 in group II before injection of peribulbar anesthesia. |
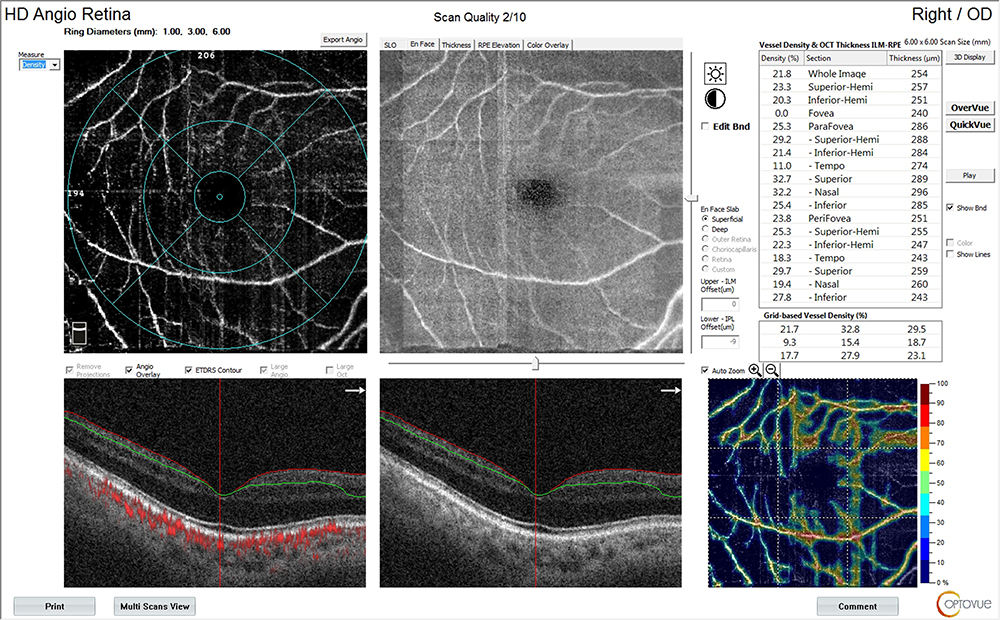 |
Figure 11 OCT-A of the SCP of patient number 4 in group II after injection of peribulbar anesthesia. |
Before injection, SCP total density was significantly higher in group II (32 ±3) than in group I (29.3 ±2.6) (P = 0.001). After injection, it was significantly higher in group I (28.9 ±2.6) than in group II (27 ±3.4) (P = 0.031) (Figures 12 and 13). In addition, the median percent change post-injection was significantly higher in group II (−16.2%) than in group I (−1.1%) (P < 0.001). Table 3 and Figure 1 show OCT findings in both groups.
 |
Table 3 Pre and Post-Injection OCT Parameters in Both Groups |
 |
Figure 12 OCT-A of the SCP of patient number 7 in group I before injection of peribulbar anesthesia. |
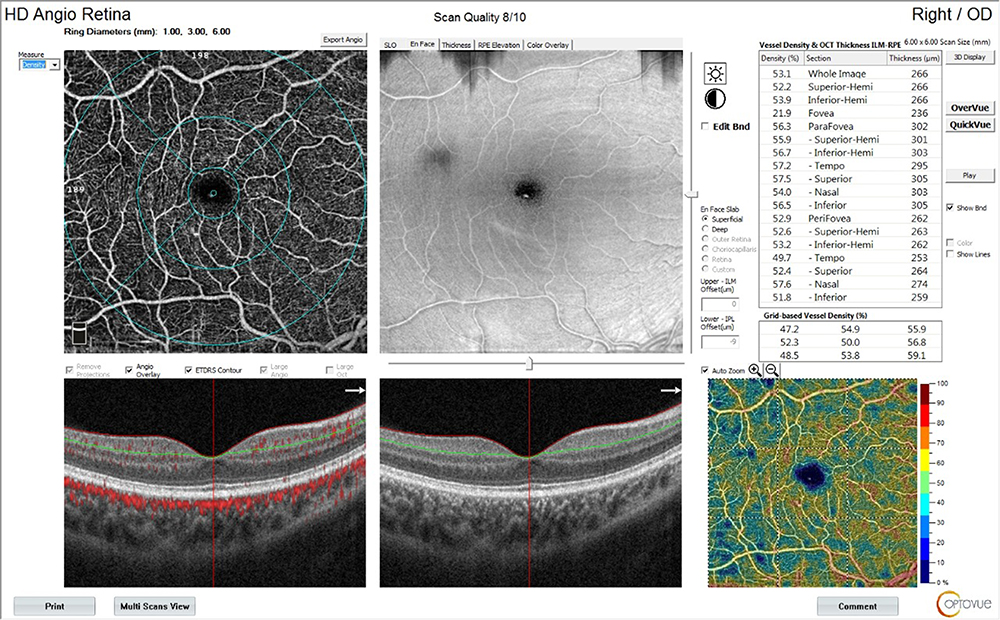 |
Figure 13 OCT-A of the SCP of patient number 7 in group I after injection of peribulbar anesthesia. |
Statistical Methods
Data management and statistical analysis were done using SPSS version 28 (IBM, Armonk, New York, United States). Quantitative data were assessed for normality using the Shapiro–Wilk test and direct data visualization methods. According to normality testing, quantitative data were summarized as means and standard deviations or medians and ranges. Categorical data were summarized as numbers and percentages. Quantitative data were compared between the study groups using an independent t-test or Mann–Whitney U-test for normally and non-normally distributed quantitative variables. Categorical data were compared using the Chi-square test. All statistical tests were two-sided. P values less than 0.05 were considered significant.
Discussion
The effect of glaucoma on the retinal vascular tree has been extensively studied.15 Researches proved that the retinal vessel caliber reduction is positively correlated with thinning in the retinal nerve fiber layer with a subsequent negative effect on the visual field. Moreover, treatment with vasodilators like Calcium Channel Blockers improves ocular perfusion and provides neuroprotection for the optic nerve.15,16 Therefore, it is of utmost importance to preserve a stable ocular perfusion in such vulnerable glaucoma patients.
OCT-A is a dye-free, non-invasive, reliable, and easy to interpret tool used to assess the retinal microvascular tree. It has been widely used to detect the effect of glaucoma on superficial and deep retinal capillary plexuses.17,18
In 1999, Findl et al proved a fall in retinal blood flow following peribulbar anesthesia injection.5 They used laser interferometry to measure the pulsatile choroidal blood flow. They also used Doppler sonography to check the mean blood flow velocity and resistive index in the ophthalmic artery and the central retinal artery. However, they did not categorize patients into glaucoma and non-glaucoma ones. Watkins et al also used an Ocular Blood Flow tonometer to measure the pulsatile ocular blood flow after retro- and peribulbar anesthesia injection. They declared a fall in ocular blood flow following both methods of injection. They excluded glaucoma patients from their study, and they recommended using other anesthetic techniques in patients with ocular vascular compromise.19
Chang et al claimed that subconjunctival anesthesia does not affect the pulsatile ocular blood flow, while peribulbar anesthesia significantly reduces it, but again, they excluded glaucoma patients from their study.20
The effect of anesthesia on ocular blood flow could be related to the direct mechanical compression or the pharmacological effects of local anesthetics.5,21 In our study, the ischemic change in the retinal superficial and deep retinal capillary plexuses was more significant in glaucoma patients than in those without glaucoma. Peripapillary ischemia was significantly greater after peribulbar injection in the glaucoma group. The FAZ diameter got significantly wider in the glaucoma group as well (Figure 14) (Table 3).
 |
Figure 14 Pre and post-injection OCT-A parameters in both groups. |
In both groups, the IOP did not significantly change after the peribulbar injection, which points to the pharmacological effect of the anesthetics on the compromised vascular tree of glaucoma patients. Although lidocaine and bupivacaine are known for their vasodilator effect, they interfere with the local vascular control mechanisms, especially the endothelial-derived nitrous oxide production. That would eventually result in vasoconstriction.22 Several studies have reported a disturbance in the vascular autoregulation mechanism in glaucoma patients.6,7,23,24 Researchers claimed an elevated ocular endothelin-1 level with subsequent retinal vascular dysregulation in POAG patients. The retinal vascular tree in those patients demonstrates a faulty response to various stimuli.25 An exaggerated vasoconstriction response to the peribulbar anesthetic medications could explain the ischemic changes in the peripapillary area, SCP, DCP, and FAZ, which were more pronounced in the glaucoma group.
We conclude that the peribulbar anesthesia harbors a deleterious ischemic effect on the retinal vascular tree of glaucoma patients. That could harmfully affect the vision and the visual field in those vulnerable patients. Further studies are needed to determine the long-term effect of peribulbar anesthesia on glaucoma patients. Perhaps ophthalmologists should consider other local anesthesia techniques like sub-tenon and topical anesthesia for glaucoma patients. Anesthetists should also consider using other anesthetic agents that lessen the ischemic effects on the retina.
Strengths and Limitations of This Study
- To the best of our knowledge, this is the first study to use OCT-A to assess the effect of peribulbar anesthesia on the retinal vascular tree.
- This is also the first study to compare that effect on glaucoma versus non-glaucoma eyes.
- The relatively small sample size and the single-center setting of the study are the main limitations.
Data Sharing Statement
The datasets of this study are available from the corresponding author on reasonable request.
Ethics Approval and Consent to Participate
This study was approved by the ethical committee of Benha Faculty of Medicine, Benha University (Approval number: RC:11-2-2022). A written informed consent, including the aim of the study, detailed steps, and potential complications, was signed by each patient.
Consent for Publication
Consent for the publication of identifying patient/clinical data and identifying images was obtained from all relevant patients in writing.
Author Contributions
All authors made a significant contribution to the work reported, whether that is in the conception, study design, execution, acquisition of data, analysis and interpretation, or in all these areas; took part in drafting, revising or critically reviewing the article; gave final approval of the version to be published; have agreed on the journal to which the article has been submitted; and agree to be accountable for all aspects of the work.
Disclosure
The authors declare no conflicts of interest in this work.
References
1. Malik A, Fletcher EC, Chong V, Dasan J. Local anesthesia for cataract surgery. J Cataract Refract Surg. 2010;36(1):133–152. doi:10.1016/j.jcrs.2009.10.025
2. Carneiro HM, Teixeira KISS, de Ávila MP, Limongi RM, Magacho L. Comparison of needle path, anesthetic dispersion, and quality of anesthesia in retrobulbar and peribulbar blocks. Reg Anesth Pain Med. 2016;41(1):37–42. doi:10.1097/AAP.0000000000000340
3. Kelly DJ, Farrell SM. Physiology and role of intraocular pressure in contemporary anesthesia. Anesth Analg. 2018;126(5):1551–1562. doi:10.1213/ANE.0000000000002544
4. Ali H, Eissa S, Magdy H, Khashba M. Dexmedetomidine as an additive to local anesthesia for decreasing intraocular pressure in glaucoma surgery: a randomized trial. Anesth Pain Med. 2020;10(3):e100673. doi:10.5812/aapm.100673
5. Findl O, Dallinger S, Menapace R, et al. Effects of peribulbar anesthesia on ocular blood flow in patients undergoing cataract surgery. Am J Ophthalmol. 1999;127(6):645–649. doi:10.1016/S0002-9394(99)00066-5
6. Flammer J, Orgül S, Costa VP, et al. The impact of ocular blood flow in glaucoma. Prog Retin Eye Res. 2002;21(4):359–393. PMID: 12150988. doi:10.1016/s1350-9462(02)00008-3
7. Luo X, Shen YM, Jiang MN, Lou XF, Shen Y. Ocular blood flow autoregulation mechanisms and methods. Hindawi J Ophthalmol. 2015;2015:7. doi:10.1155/2015/864871
8. Grudzińska E, Modrzejewska M. Modern diagnostic techniques for the assessment of ocular blood flow in myopia: current state of knowledge. Hindawi J Ophthalmol. 2018;2018:8. doi:10.1155/2018/4694789
9. Spaide RF, Fujimoto JG, Waheed NK, Sadda SR, Staurenghi G. Optical coherence tomography angiography. Prog Retin Eye Res. 2018;64:1–55. doi:10.1016/j.preteyeres.2017.11.003
10. Borrelli E, Sarraf D, Freund KB, Sadda SR. OCT angiography and evaluation of the choroid and choroidal vascular disorders. Prog Retin Eye Res. 2018;67:30–55. doi:10.1016/j.preteyeres.2018.07.002
11. Borrelli E, Sadda SR, Uji A, Querques G. Pearls and pitfalls of optical coherence tomography angiography imaging: a review. Ophthalmol Ther. 2019;8(2):215–226. doi:10.1007/s40123-019-0178-6
12. Borrelli E, Sadda SR, Uji A, Querques G. OCT angiography: guidelines for analysis and interpretation. In: OCT and Imaging in Central Nervous System Diseases. Cham: Springer; 2020:41–54.
13. Kalra G, Zarranz-Ventura J, Chahal R, Bernal-Morales C, Lupidi M, Chhablani J. Optical coherence tomography (OCT) angiolytics: a review of OCT angiography quantitative biomarkers. Surv Ophthalmol. 2021;67:1118–1134.
14. Werner AC, Shen LQ. A review of OCT angiography in glaucoma. In. Seminars in Ophthalmology. Taylor & Francis; 2019. Vol. 34:279–286. doi:10.1080/08820538.2019.1620807
15. Chan KKW, Tang F, Tham CCY, Young AL, Cheung CY. Retinal vasculature in glaucoma: a review. BMJ Open Ophthalmol. 2017;1(1):e000032. doi:10.1136/bmjophth-2016-000032
16. Mayama C. Calcium channels and their blockers in intraocular pressure and glaucoma. Eur J Pharmacol. 2014;739:96–105. PMID: 24291107. doi:10.1016/j.ejphar.2013.10.073
17. Bussel II, Wollstein G, Schuman JS. OCT for glaucoma diagnosis, screening, and detection of glaucoma progression British. J Ophthalmol. 2014;98:ii15–ii19.
18. Rao HL, Pradhan ZS, Suh MH, Moghimi S, Mansouri K, Weinreb RN. Optical coherence tomography angiography in glaucoma. J Glaucoma. 2020;29(4):312–321. doi:10.1097/IJG.0000000000001463
19. Watkins R, Beigi B, Yates M, Chang B, Linardos E. Intraocular pressure and pulsatile ocular blood flow after retrobulbar and peribulbar anesthesia. Br J Ophthalmol. 2001;85(7):796–798. doi:10.1136/bjo.85.7.796
20. Chang BYP, Hee WCL, Ling R, Broadway DC, Beigi B. Local anesthetic techniques and pulsatile ocular blood flow. Br J Ophthalmol. 2000;84:1260–1263. doi:10.1136/bjo.84.11.1260
21. Cabral SA, Carraretto AR, Sousa AM, Gomez RS. Effect of adding clonidine to lidocaine on ocular hemodynamics during sub-Tenon’s anesthesia: randomized double-blind study. Braz J Anesthesiol. 2021;71(6):628–634. PMID: 34547340. doi:10.1016/j.bjane.2021.08.004
22. Meyer P, Flammer J, Lüscher TF. Local anesthetic drugs reduce endothelium-dependent relaxations of porcine ciliary arteries. Invest Ophthalmol Vis Sci. 1993;34(9):2730–2736. PMID: 8344795.
23. Puchner S, Schmidl D, Ginner L, et al. Changes in retinal blood flow in response to an experimental increase in IOP in healthy participants as assessed with Doppler optical coherence tomography. Invest Ophthalmol Vis Sci. 2020;61(2):33. doi:10.1167/iovs.61.2.33
24. Rommel F, Rothe M, Kurz M, et al. Evaluating diurnal variations in retinal perfusion using optical coherence tomography angiography. Int J Retin Vitr. 2020;6:22. doi:10.1186/s40942-020-00227-y
25. Mroczkowska S, Benavente-Perez A, Negi A, Sung V, Patel SR, Gherghel D. Primary open-angle glaucoma vs normal-tension glaucoma: the vascular perspective. JAMA Ophthalmol. 2013;131(1):36–43. doi:10.1001/2013.jamaophthalmol.1
 © 2022 The Author(s). This work is published and licensed by Dove Medical Press Limited. The
full terms of this license are available at https://www.dovepress.com/terms
and incorporate the Creative Commons Attribution
- Non Commercial (unported, 3.0) License.
By accessing the work you hereby accept the Terms. Non-commercial uses of the work are permitted
without any further permission from Dove Medical Press Limited, provided the work is properly
attributed. For permission for commercial use of this work, please see paragraphs 4.2 and 5 of our Terms.
© 2022 The Author(s). This work is published and licensed by Dove Medical Press Limited. The
full terms of this license are available at https://www.dovepress.com/terms
and incorporate the Creative Commons Attribution
- Non Commercial (unported, 3.0) License.
By accessing the work you hereby accept the Terms. Non-commercial uses of the work are permitted
without any further permission from Dove Medical Press Limited, provided the work is properly
attributed. For permission for commercial use of this work, please see paragraphs 4.2 and 5 of our Terms.