Back to Journals » International Journal of General Medicine » Volume 19
Quantitative CT Pulmonary Angiography and Echo Cardiography Analysis for Enhanced Cardiovascular Assessment of Right Ventricular Failure in Pulmonary Hypertension
Authors Hajiahmadi S, Mirdamadi A, Tajmirriahi M, Fadavi S, Moradi M, Rasti S, Elhaie M ![]()
Received 28 March 2026
Accepted for publication 8 June 2026
Published 10 June 2026 Volume 2026:19 612693
DOI https://doi.org/10.2147/IJGM.S612693
Checked for plagiarism Yes
Review by Single anonymous peer review
Peer reviewer comments 2
Editor who approved publication: Dr Redoy Ranjan
Somayeh Hajiahmadi,1 Ahmad Mirdamadi,2 Marzieh Tajmirriahi,3 Somayeh Fadavi,1 Maryam Moradi,1 Sina Rasti,1 Mohammadreza Elhaie1
1Department of Radiology, School of Medicine, Isfahan University of Medical Sciences, Isfahan, Iran; 2Department of Cardiology, Najafabad Branch, Islamic Azad University, Najafabad, Isfahan, Iran; 3Hypertension Research Center, Isfahan Cardiovascular Research Institute, Isfahan University of Medical Sciences, Isfahan, Iran
Correspondence: Mohammadreza Elhaie, Department of Radiology, School of Medicine, Isfahan University of Medical Sciences, Isfahan, 8174673461, Iran, Tel +9809016190079, Email [email protected] Sina Rasti, Department of Radiology, School of Medicine, Isfahan University of Medical Sciences, Isfahan, 8174673461, Iran, Tel +9809016190079, Email [email protected]
Background: Pulmonary hypertension (PH) with concomitant right ventricular (RV) dysfunction presents major clinical challenges. Computed tomography pulmonary angiography (CTPA) is a widely available, non-invasive tool for PH assessment. This study evaluated the diagnostic performance of selected CTPA-derived metrics for detecting RV dysfunction and severe PH.
Methods: A cross-sectional study included 39 adults (mean age 51.46 ± 2.71 years; 53.8% female) with newly diagnosed non-cardiogenic PH (World Health Organization groups 1, 3, 4, and 5). Key CTPA parameters were entered into backward stepwise logistic regression to predict RV dysfunction and severe PH (systolic pulmonary artery pressure > 60 mmHg), using echocardiography as the reference standard. Adjusted odds ratios (ORs) with 95% confidence intervals (CIs) were calculated; statistical significance was set at P< 0.05.
Results: RV dysfunction was present in 28 patients (71.8%) and severe PH in 20 (51.3%). Independent predictors of RV dysfunction were anteroposterior right atrial (AP RA) diameter (OR 1.135; 95% CI 1.032– 1.248; P=0.009) and short-axis ascending aortic (AA) diameter (OR 0.723; 95% CI 0.572– 0.915; P=0.007), achieving combined sensitivity 92.9%, specificity 72.7%, and accuracy 87.2% (95% CI 76.7– 97.7). Contrast medium reflux into the inferior vena cava or hepatic veins was the only independent predictor of severe PH (OR 6.857; 95% CI 1.627– 28.899; P=0.009; accuracy 71.8%).
Conclusion: CTPA-derived AP RA and AA diameters are useful markers for RV dysfunction in non-cardiogenic PH, while contrast reflux reliably indicates severe disease. Larger prospective studies and right atrial shape analysis are warranted to confirm and refine these findings.
Keywords: computed tomography angiography, echocardiography, pulmonary hypertension, right ventricular dysfunction
Background
Pulmonary hypertension (PH), characterized by a mean pulmonary artery pressure (PAP) exceeding 20 mmHg.1 Within the realm of PH, right heart failure emerges as the principal cause of mortality, often preceded by right ventricle (RV) dysfunction.2 While catheterization remains the gold standard for PH diagnosis, its invasiveness and associated health risks restrict its routine use in clinical practice.3 Consequently, various radiological imaging modalities have emerged as viable alternatives for assessing PH and RV function, including echocardiography, cardiac magnetic resonance (CMR), computed tomography (CT), and positron emission tomography (PET).3 Echocardiography, the primary method for monitoring PH and RV function, does have limitations such as time consumption, operator-dependent variability, and limited availability.4 Moreover, the complex geometry and retrosternal location of the RV, coupled with reduced ultrasound quality in specific patient populations (eg, obese or dyspneic individuals), often hinder the acquisition of comprehensive information regarding right heart function.5 Conversely, CT stands as a swift and accessible tool capable of not only assessing PH and RV function but also capturing concurrent comorbidities or potential underlying causes.6 Consequently, many healthcare professionals routinely complement echocardiography with chest CT to formulate the most precise treatment strategies for PH patients.7 In our clinical experience, we have observed frequent disparities between CT and echocardiography reports concerning the severity of PH or the presence of RV dysfunction among patients. These discrepancies, which have also been reported in prior studies,8 have resulted in delayed medical assessments and necessitated additional paraclinical studies to ensure an accurate evaluation of patient health. Despite the clinical significance of these disparities, limited and sparse evidence exists regarding the utility of CT findings in detecting RV dysfunction or estimating the disease severity among PH patients. Therefore, our study endeavors to examine various chest CT measurements to ascertain their potential as indicators of RV dysfunction and severe PH, as confirmed by echocardiography (our gold standard), within this patient population. The novelty of this study lies in its focus on non-cardiogenic PH and the identification of AP RA diameter and short-axis AA diameter as independent CTPA predictors of RV dysfunction—metrics that are less phase-dependent and more reproducible than conventional RV/LV ratio in routine non-gated CTPA.
Materials and Methods
Sampling and Design
We conducted a cross-sectional study using data from consecutive referrals to the echocardiography section of Al zahra Hospital, affiliated with Isfahan University of Medical Sciences, a tertiary care center. The study included records belonging to adults aged 18 years and older, newly diagnosed with non-cardiogenic pulmonary hypertension (PH), falling into World Health Organization (WHO) classes 1, 3, 4, and 5. The study period was from April 2019 to April 2021, and eligible participants provided informed written consent to participate.
Inclusion Criteria
Adults ≥18 years with newly diagnosed non-cardiogenic PH (WHO groups 1, 3, 4, or 5) confirmed by echocardiography and referred for CTPA.
Exclusion Criteria
Cardiogenic PH (WHO group 2), CTPA performed >14 days from echocardiography, insufficient image quality (motion artifacts), or incomplete clinical data.
Diagnoses were confirmed by hospital cardiologists following the guidelines outlined in the European Society Guideline on PH.9 Key patient information, including age, sex, echocardiography date, and National IDs, was recorded to facilitate the retrieval of CT pulmonary angiography (CTPA) images from our institution’s Picture Archiving and Communication System (PACS). In our healthcare setting, cardiologists routinely order CTPA to identify the underlying cause of PH and diagnose comorbidities in PH patients without verified left heart failure, which explains our rationale for not including class 2 PH cases. Patients were excluded from the study if their CTPA images were not located within 14 days of the echocardiography date or were of insufficient quality for interpretation. Importantly, CT interpreters remained unexposed to echocardiography results until after the interpretation of CTPAs. The study protocol received approval from the Research Ethics Committee of Isfahan University of Medical Sciences, adhering to the ethical principles outlined in the Declaration of Helsinki.
Echocardiography
Two-dimensional and continuous wave Doppler transthoracic echocardiography (TTE) was conducted on each participant, capturing images in apical four-chamber and subcostal views (Figure 1). The assessments were carried out using a 2–4MHz sector probe affixed to the Affiniti 50 Epiq 7 ultrasound device (Philips Medical Systems, Cleveland, OH, USA). Patients were positioned supine and remained in a calm and relaxed state throughout the procedure.
 |
Figure 1 Transthoracic Echocardiograms of a Typical Patient with Pulmonary Hypertension. (a) In the apical four-chamber view, a peak tricuspid regurgitation velocity (PTRV) of 3.6 m/s was measured, resulting in an estimated systolic pulmonary artery pressure (sPAP) of 52 mmHg according to the simplified Bernoulli equation. Albeit, the indicated estimation of sPAP here does not consider the resting atrial pressure (RAP), which was later added to estimate the final sPAP in this study. (b) In the subcostal view, a congested inferior vena cava (IVC), also known as IVC plethora, is obvious. This sign is indicative of an increased RAP. |
Data pertaining to systolic PAP (sPAP) and RV myocardial function were retrieved from available records. The calculation of sPAP relied on the peak tricuspid regurgitation velocity (PTRV) and resting atrial pressure (RAP), utilizing the simplified Bernoulli equation  , with ruled out pulmonary artery stenosis. RAP was estimated based on the inferior vena cava (IVC) diameter and its collapsibility during respiration as observed in the subcostal view.9 PH was defined as an sPAP exceeding 37 mmHg, with an sPAP surpassing 60 mmHg indicative of severe PH.10 The criteria for identifying RV dysfunction included operator assessments of RV myocardial hypokinesia/dyskinesia, an end-diastolic mid-cavity RV/left ventricle (LV) diameter ratio of ≥ 1, or bowing of the interventricular septum (IVS).11,12
All examinations were carried out by two board-certified cardiologists with specialized training in echocardiography and more than five years of practical experience in the field. The measurements and assessments were performed and reported in consensus by this expert team (See Figures 1a and b and 2a–d).
 |
Figure 2 Implemented Measurements in Axial Sections of a CT Pulmonary Angiogram in a Sixty-Year-Old Female with an Echocardiography-Approved Systolic Pulmonary Artery Pressure of 50 mmHg. (a) The short-axis diameters of ascending aorta (AA) and pulmonary trunk (PT) were measured at the level of PT bifurcation. (b) Diameters of the right ventricle (RV) and left ventricle (LV) at mid-ventricle portions are depicted. (c) RV myocardial thickness was measured at its thickest portion in the free wall. Moreover, a straightened interventricular septum (IVS) is obvious. (d) A four-chamber view illustrates the anteroposterior (AP) and transverse diameters of the right atrium (RA). |
CTPA
Axial images from CTPA were meticulously interpreted utilizing a dedicated image processing workstation (GE AW 4.7) (Figure 2). This interpretive process involved the collaboration of an experienced, board-certified radiologist with over a decade of expertise, working in a pair with a senior radiology resident. Ultimately, an experienced cardiothoracic radiologist approved or modified all the measurements and annotations. CTPA was performed on a 64- or 128-slice multidetector CT scanner using standard institutional pulmonary embolism protocol (120 kVp, 100–300 mAs, 1–1.25 mm slice thickness, 0.5–0.8 s rotation time). Intravenous contrast (80–100 mL non-ionic iodinated contrast at 4–5 mL/s) was injected via antecubital vein followed by saline chaser. Images were reconstructed at 1 mm thickness with standard lung and mediastinal kernels. All measurements were performed independently by two readers (board-certified radiologist + senior resident); discrepancies were resolved by the cardiothoracic radiologist. Inter-observer agreement was not formally quantified in this pilot study but will be addressed in future validation work.
Key measurements, all in axial view, included the short-axis diameters of the pulmonary trunk (PT) and ascending aorta (AA), both assessed at the level of PT bifurcation. Additionally, the widest distances between the endocardia of the ventricular free wall and interventricular septum, measured in parallel to the tricuspid and mitral valves, represented the diameters of the RV and LV, respectively. The thickest portion of the free-wall RV myocardium was noted as the RV myocardial thickness, and the morphology of the IVS was categorized as either straight, bowing to the right, or bowing to the left. Visual detection of contrast media within the inferior vena cava (IVC) or hepatic veins was considered a positive finding.
Anteroposterior (AP) and transverse right atrial (RA) diameters were determined as the maximal dimensions of the RA cavity (endocardium to endocardium) in parallel to the interatrial septum and the tricuspid valve anulus, respectively.13
Statistical Analysis
We entered and further analyzed the gathered data utilizing IBM SPSS for Windows software package (v.26, SPSS Inc., Chicago, IL, USA). Receiver operating curves (ROC) were generated and analyzed using MedCalc Statistical Software version 20.218 (MedCalc Software Ltd, Ostend, Belgium).
Quantitative variables were reported as mean ± standard deviation (SD) or median (quartile 1, quartile 3), based on the normality of their distributions. Categorical data were presented as percentages and counts. To assess the normality of each quantitative variable’s distribution, in total or across each outcome category, we employed the Kolmogorov–Smirnov or Shapiro–Wilk test. Depending on the results of the normality tests, either an independent sample t-test or Mann–Whitney U-test was utilized to compare quantitative variables between two categories. Proportions of categorical variables were compared using the χ2 test. The significance level for all analyses was set at 0.05.
To predict the outcomes, whether the presence of RV dysfunction or the severity of PH, we employed backward stepwise binary logistic regression models, considering the significance of Wald statistics. Backward stepwise logistic regression was chosen to identify the most parsimonious set of independent predictors while minimizing overfitting in our modest sample size, using Wald statistics for variable selection (P<0.05). These models included demographic variables and measurements derived from the interpretation of CTPA images. The strength of association between each predictor and the outcome was reported as Odds ratios (ORs) with corresponding 95% confidence intervals (CIs). The post hoc power of the final regression model was assessed by the Hosmer and Lemeshow goodness-of-fit test.
ROC curve analysis was performed to identify optimal cutoff values for significant predictors of RV dysfunction. We reported sensitivity, specificity, positive predictive value (PPV), negative predictive value (NPV), positive likelihood ratio (PLR), and negative likelihood ratio (NLR) for these cutoff values. Additionally, we compared the area under the curves (AUCs) of these predictors using the DeLong et al method.14
Results
After including a total of 108 consecutive patient records, we identified that 66 participants had no CTPA within the 14-day timeframe following TTE. Additionally, three acquisitions were excluded due to motion artifacts, resulting in a final sample size of 39 participants. These individuals had a mean age of 51.46 ± 2.71 years, with ages ranging from 24 to 83, and 21 of them (53.8%) were female.
Table 1 provides an overview of the participants’ demographics and presents the results of univariate analyses concerning RV functional status and the severity of PH in TTE. Notably, RA dimensions (both AP and transverse) and the short-axis diameter of the AA exhibited significant differences between patient groups with and without RV dysfunction. On the other hand, participants with severe PH, as compared to those without severe PH, demonstrated higher maximum RV myocardial thickness and a greater prevalence of contrast medium reflux.
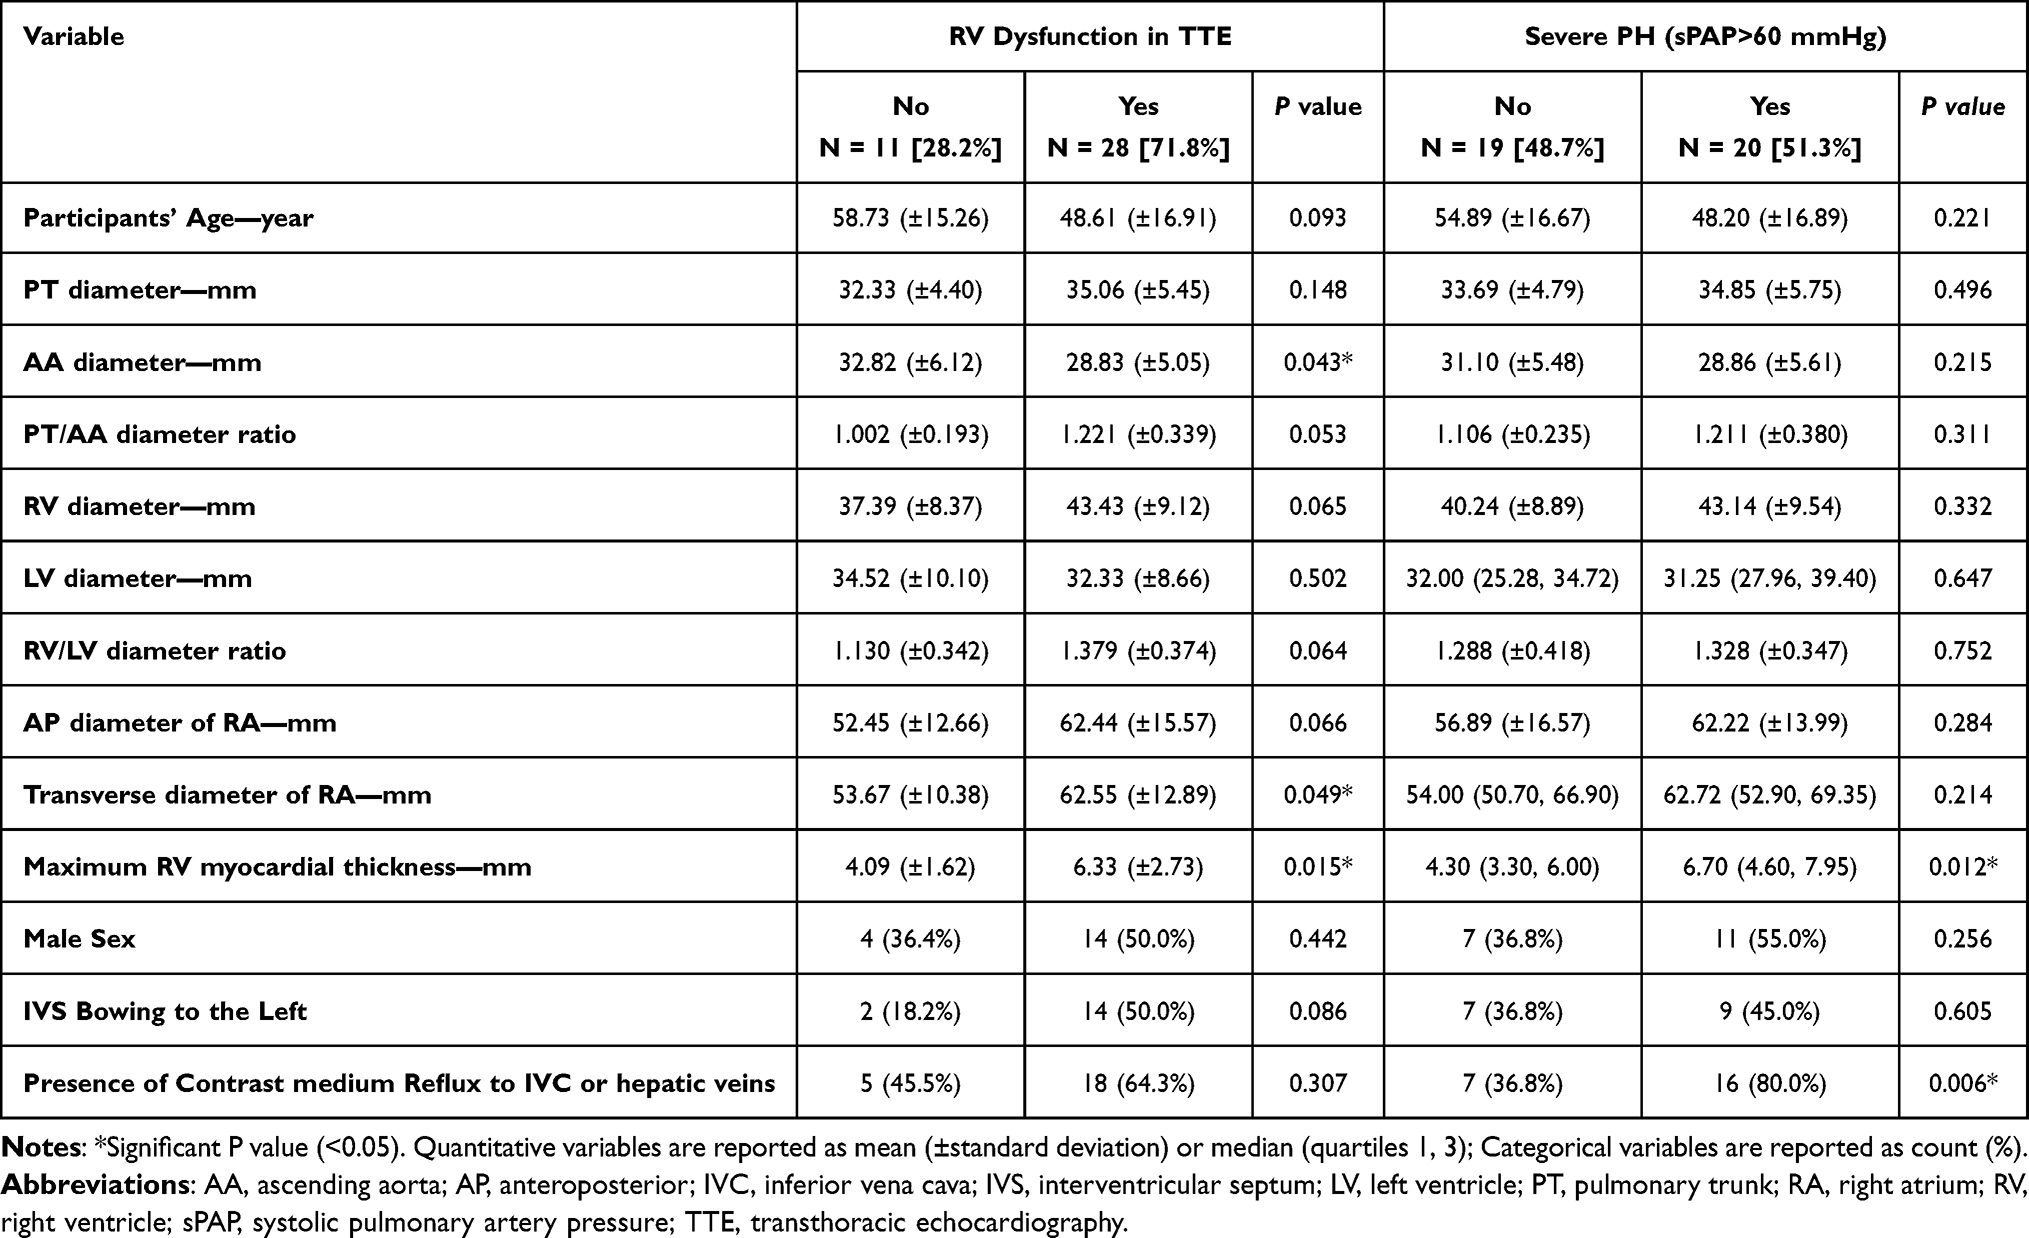 |
Table 1 Demographic Data and Their Univariate Analysis |
In the stepwise logistic regression model, both AA and AP RA diameters emerged as independently significant predictive variables for RV dysfunction, with ORs of 0.723 (95% CI: 0.572–0.915, P=0.007) and 1.135 (95% CI: 1.032–1.248, P=0.009), respectively. Equation 1 shows the model that incorporated these two variables, which achieved an accuracy of 87.18% (95% CI: 76.69–97.67) in predicting RV dysfunction. The Hosmer and Lemeshow test demonstrated a P=0.548, denoting a well-fitted model.

A  is the ideal cutoff more than which indicates RV dysfunction.
AA: short-axis diameter of ascending aorta in mm, P: probability of the event, RAAP: right atrium anteroposterior diameter in mm, RV: right ventricle.
Table 2 presents the ROC curve analysis of this model along with separate analyses for each of the significant predictors individually. Although the final model’s AUC did not significantly exceed that of RA AP diameter (P=0.079), it did outperform the AUC of AA diameter (P=0.011). Notably, the classification performance of AA and RA AP diameters did not significantly differ.
 |
Table 2 Diagnostic Function of Each Variable for RV Dysfunction |
In the logistic regression analysis aimed at predicting severe PH, the presence of contrast medium reflux to the IVC or hepatic veins emerged as the sole significant and independent predictor, with an OR of 6.857 (95% CI: 1.627–28.899, P=0.009). This predictor demonstrated an accuracy of 71.79% (95% CI: 57.67–85.92), sensitivity of 80.00% (95% CI: 67.45–92.55), and specificity of 63.16% (95% CI: 48.02–78.30) in detecting severe PH.
Discussion
Our investigation demonstrates that a composite metric comprising the anteroposterior (AP) diameter of the right atrium (RA) and the short-axis diameter of the ascending aorta (AA), as derived from computed tomography pulmonary angiography (CTPA), exhibits robust predictive utility for right ventricular (RV) dysfunction in patients with pulmonary hypertension (PH), achieving an accuracy of 87.18% (95% CI: 76.69–97.67), sensitivity of 92.9%, and specificity of 72.7%. Furthermore, the visualization of contrast medium reflux into the inferior vena cava (IVC) or hepatic veins emerged as the sole independent predictor of severe PH (systolic pulmonary artery pressure >60 mmHg), with an adjusted odds ratio (OR) of 6.857 (95% CI: 1.627–28.899, p=0.009) and an accuracy of 71.79%. Notably, other CTPA-derived parameters, including the RV/left ventricle (LV) diameter ratio, pulmonary trunk (PT) diameter, PT/AA ratio, RV myocardial thickness, interventricular septum (IVS) morphology, and demographic factors, did not retain independent associations with either outcome in multivariate backward stepwise logistic regression analyses. The main contribution of this study is the identification of two readily available, non-gated CTPA measurements (AP RA diameter and short-axis AA diameter) as independent predictors of echocardiographic RV dysfunction in non-cardiogenic PH, together with confirmation of contrast reflux as a marker of severe disease. Prior research has consistently highlighted the prognostic relevance of RA dimensions in PH and RV dysfunction, often focusing on echocardiographic or CT-derived RA area or volume as surrogates for right heart strain. However, the morphological dynamics of RA remodeling in PH remain incompletely characterized. For instance, Medi et al (2012) reported regional variations in RA electrical conduction disturbances attributable to chronic PH, suggesting heterogeneous wall remodeling. Aligning with this, our findings indicate non-uniform RA enlargement, wherein the AP RA diameter outperforms the transverse diameter in predicting RV dysfunction. This differential dilation underscores the potential of RA shape analysis to augment diagnostic precision, particularly when incorporated into machine learning frameworks for multivariate modeling. Recent studies corroborate this emphasis on RA metrics; for example, a 2025 guideline update on echocardiographic assessment of the right heart in PH emphasizes RA size as a key indicator of adaptive responses to elevated pulmonary pressures, though it primarily addresses echocardiographic rather than CT modalities. Similarly, a 2023 meta-analysis by Liu et al linked increased RA area to adverse outcomes in pulmonary arterial hypertension (PAH), but did not explore CTPA-specific shape variations, highlighting an opportunity for integration of our AP RA findings into future CT-based protocols.15–18 The identification of a reduced AA diameter as an independent predictor of RV dysfunction (OR: 0.723, 95% CI: 0.572–0.915, p=0.007) represents a novel observation in this context. Potential mechanisms include diminished LV output secondary to impaired RV function, thereby constraining AA expansion. While a pediatric study by Truong et al (2020) attributed AA compression to PT dilation in PH, extrapolating this to adults warrants caution. Recent investigations provide contextual support; a 2025 study on the pulmonary artery diameter (PAD) to AA diameter ratio demonstrated its association with historical hemodynamic burden and cardiac dysfunction in a broader cardiovascular cohort, suggesting that relative AA narrowing may reflect chronic right-left heart interplay in PH. Additionally, a 2023 analysis by Granot et al found no direct link between AA diameter and PH severity in isolation, but when combined with other metrics, it enhanced predictive models, consistent with our multivariate approach.19–21 These interpretations regarding the ascending aortic diameter remain speculative and should be viewed with caution until confirmed in larger prospective studies. In contrast to our results, several parameters such as the RV/LV ratio, RV diameter, PT/AA ratio, RV myocardial thickness, IVS bowing, and contrast reflux did not independently predict RV dysfunction. This diverges from earlier literature, predominantly in acute pulmonary embolism (PE) cohorts, where these metrics have shown prognostic value. The discrepancy may stem from population differences, as our sample comprised non-cardiogenic PH patients without acute PE. Moreover, variability in cardiac cycle phase during non-gated CTPA acquisition could confound ventricular and septal assessments. Our AP RA and AA measurements, being less phase-dependent, may offer greater reproducibility. Although the RV/LV diameter ratio did not reach independent statistical significance in our multivariate model, this may reflect limited statistical power due to the modest sample size rather than a true lack of biological relevance. A 2023 study on right heart strain assessment via CTPA in acute PE reported high inter-observer agreement for RV/LV and PT/AA ratios but emphasized their limitations in chronic PH settings, aligning with our null findings for these in non-acute contexts.19,22–25 Regarding severe PH, contrast medium reflux into the IVC or hepatic veins was a robust indicator, attributable to elevated right heart filling pressures. This concurs with established evidence; a 2012 study by Aviram et al associated IVC reflux with tricuspid regurgitation and right heart dysfunction, while more recent work, including a 2025 analysis, reaffirms its specificity as a marker of pulmonary hypertension and congestive states, though sensitivity remains moderate. A 2022 prognostic evaluation in PE patients extended this to hepatic vein involvement, reporting enhanced risk stratification for adverse outcomes, which parallels our accuracy for severe PH detection. However, Granot et al (2021) identified PT diameter as an additional predictor in machine learning models, differing from our results possibly due to inclusion of all-cause PH and volumetric analyses.21,26 Methodological strengths include expert consensus in measurements, exclusion of cardiogenic PH to mitigate LV confounders, and focus on reconciling CTPA-echocardiography discrepancies. While our study relied on conventional echocardiography as the reference standard, recent advances in artificial intelligence for echocardiography interpretation may further improve diagnostic accuracy. For example, Zhang et al in 2024 proposed cross-space consistency learning for multi-dimensional echocardiographic analysis, and Holste et al in 2025 developed PanEcho, a multitask deep-learning model for complete automated echocardiography interpretation.27,28 Nonetheless, limitations merit acknowledgment. Retrospective data collection may introduce selection bias, as only non-cardiogenic PH patients referred for CTPA were included, potentially enriching for severe cases. The relatively small sample size (n=39) increases the risk of overfitting in the regression model and contributes to the wide confidence intervals observed, thereby reducing the precision of our estimates. The absence of external validation further limits the generalizability of the predictive models.22 Future work should include external validation in larger multicenter cohorts, incorporation of automated RA shape analysis, and integration with AI-enhanced echocardiography. Automated software leveraging RA shape analysis could refine diagnostics, as suggested by emerging imaging advances. Integrating multimodal data (eg, CTPA with AI-enhanced echocardiography) may further bridge diagnostic gaps in RV dysfunction assessment.29
Conclusion
This study demonstrates that CTPA-derived anteroposterior right atrial (AP RA) diameter and short-axis ascending aortic (AA) diameter serve as effective, independent predictors of right ventricular (RV) dysfunction in non-cardiogenic pulmonary hypertension, with combined sensitivity of 92.9% and specificity of 72.7%. Additionally, contrast medium reflux into the inferior vena cava or hepatic veins is a reliable independent indicator of severe PH (sPAP >60 mmHg). While the modest sample size and lack of external validation limit generalizability, these simple, reproducible CTPA metrics may help bridge diagnostic discrepancies between CT and echocardiography in routine clinical practice. Larger prospective, multicenter studies are warranted to validate these findings and explore automated RA shape analysis.
Data Sharing Statement
The datasets analyzed during the current study are available from the corresponding authors upon reasonable request.
Ethics Approval and Consent to Participate
This study was performed in line with the principles of the Declaration of Helsinki. Approval was granted by the Research Ethics Board of the Radiology Department at Isfahan University of Medical Sciences and Iran’s national research ethics committee (code: IR.MUI.MED.REC.1399.042). Informed verbal and written consent were obtained from every eligible participant.
Consent to Participate
Written informed consent to participate was obtained.
Acknowledgments
The authors appreciate the Isfahan University of Medical Sciences for providing the required equipment to conduct this study.
Author Contributions
All authors made a significant contribution to the work reported, whether that is in the conception, study design, execution, acquisition of data, analysis and interpretation, or in all these areas; took part in drafting, revising or critically reviewing the article; gave final approval of the version to be published; have agreed on the journal to which the article has been submitted; and agree to be accountable for all aspects of the work.
Funding
This work was supported by Isfahan University of Medical Sciences, Isfahan, Iran [grant number 3981023]. The university provided the required equipment for this study; no other financial or non-financial support was received from this or any other institution.
Disclosure
The authors report no conflicts of interest in this work.
References
1. Humbert M, Kovacs G, Hoeper MM, et al. ESC/ERS Guidelines for the diagnosis and treatment of pulmonary hypertension. Eur Heart J. 2022;43(38):3618–9. doi:10.1093/eurheartj/ehac237
2. Sanders JL, Koestenberger M, Rosenkranz S, Maron BA. Right ventricular dysfunction and long-term risk of death. Cardiovasc Diagn Ther. 2020;10(5):1646–1658. doi:10.21037/cdt-20-450
3. Hewes JL, Lee JY, Fagan KA, Bauer NN. The changing face of pulmonary hypertension diagnosis: a historical perspective on the influence of diagnostics and biomarkers. Pulm Circ. 2020;10(1):2045894019892801. doi:10.1177/2045894019892801
4. Henzler T, Roeger S, Meyer M, et al. Pulmonary embolism: CT signs and cardiac biomarkers for predicting right ventricular dysfunction. Eur Respir J. 2012;39(4):919–926. doi:10.1183/09031936.00088711
5. Goldhaber SZ. Advanced treatment strategies for acute pulmonary embolism, including thrombolysis and embolectomy. J Thromb Haemost. 2009;7 Suppl 1:322–327. doi:10.1111/j.1538-7836.2009.03415.x
6. Ascha M, Renapurkar RD, Tonelli AR. A review of imaging modalities in pulmonary hypertension. Ann Thorac Med. 2017;12(2):61–73. doi:10.4103/1817-1737.203742
7. Wells JM, Dransfield MT. Pathophysiology and clinical implications of pulmonary arterial enlargement in COPD. Int J Chron Obstruct Pulmon Dis. 2013;8:509–521. doi:10.2147/COPD.S52204
8. Sharma S, Maligireddy A, Katayama M, Chaliki HP. Diagnostic accuracy of ct-reported right ventricular strain in acute pulmonary embolism. J Ame College Cardiol. 2022;79(9, Supplement):1794. doi:10.1016/S0735-1097(22)02785-1
9. Galiè N, Humbert M, Vachiery JL, et al. 2015 ESC/ERS Guidelines for the diagnosis and treatment of pulmonary hypertension: the Joint Task Force for the Diagnosis and Treatment of Pulmonary Hypertension of the European Society of Cardiology (ESC) and the European Respiratory Society (ERS): endorsed by: association for European Paediatric and Congenital Cardiology (AEPC), International Society for Heart and Lung Transplantation (ISHLT). Eur Heart J. 2016;37(1):67–119. doi:10.1093/eurheartj/ehv317
10. Granot Y, Rozenbaum Z, Ziv-Baran T, et al. Detection of severe pulmonary hypertension based on computed tomography pulmonary angiography. Int J Cardiovasc Imaging. 2021;37(8):2577–2588. doi:10.1007/s10554-021-02231-1
11. Rudski LG, Lai WW, Afilalo J, et al. Guidelines for the echocardiographic assessment of the right heart in adults: a report from the American Society of Echocardiography endorsed by the European Association of Echocardiography, a registered branch of the European Society of Cardiology, and the Canadian Society of Echocardiography. J Am Soc Echocardiogr. 2010;23(7):
12. Lang RM, Badano LP, Mor-Avi V, et al. Recommendations for cardiac chamber quantification by echocardiography in adults: an update from the American Society of Echocardiography and the European Association of Cardiovascular Imaging. J Am Soc Echocardiogr. 2015;28(1):1–39.e14. doi:10.1016/j.echo.2014.10.003
13. Nuffer Z, Baran TM, Krishnamoorthy V, Kaproth-Joslin K, Chaturvedi A. Accuracy of non-electrocardiographically gated thoracic CT angiography for right atrial and right ventricular enlargement. Radiol Cardiothorac Imaging. 2019;1(4):e190008. doi:10.1148/ryct.2019190008
14. DeLong ER, DeLong DM, Clarke-Pearson DL. Comparing the areas under two or more correlated receiver operating characteristic curves: a nonparametric approach. Biometrics. 1988;44(3):837–845. doi:10.2307/2531595
15. van Wezenbeek J, Kianzad A, van de Bovenkamp A, et al. Right ventricular and right atrial function are less compromised in pulmonary hypertension secondary to heart failure with preserved ejection fraction: a comparison with pulmonary arterial hypertension with similar pressure overload. Circulation. 2022;15(2):e008726. doi:10.1161/CIRCHEARTFAILURE.121.008726
16. Scarpato BM, Locke BW, Bledsoe J, et al. The association between pulmonary artery enlargement and mortality in an Emergency Department population undergoing computed tomography pulmonary angiography. Pulmonary Circul. 2023;13(2):e12225. doi:10.1002/pul2.12225
17. Wells JM, Iyer AS, Rahaghi FN, et al. Pulmonary artery enlargement is associated with right ventricular dysfunction and loss of blood volume in small pulmonary vessels in chronic obstructive pulmonary disease. Circ Cardiovasc Imaging. 2015;8(4):e002546. doi:10.1161/CIRCIMAGING.114.002546
18. Mukherjee M, Rudski LG, Addetia K, et al. Guidelines for the echocardiographic assessment of the right heart in adults and special considerations in pulmonary hypertension: recommendations from the American Society of Echocardiography. J Am Soc Echocardiograph. 2025;38(3):141–186. doi:10.1016/j.echo.2025.01.006
19. Samaranayake CB, Craigie M, Kempny A, et al. Right heart strain assessment on CTPA following acute pulmonary embolism: interobserver variability between expert radiologists and physicians. Respir Med. 2022;200:106928. doi:10.1016/j.rmed.2022.106928
20. Chimura M, Ohtani T, Sera F, et al. Ratio of pulmonary artery diameter to ascending aortic diameter and its association with right ventricular failure after left ventricular assist device implantation. Int J Cardiol. 2025;418:132596. doi:10.1016/j.ijcard.2024.132596
21. Miller AC. The failing right ventricle: an internist’s guide to the diagnosis and management of pulmonary hypertension. Am J Hosp Med. 2020;4(2). doi:10.24150/ajhm/2020.013
22. Kačar P, Prokšelj K, Ghonim S, et al. Advances in the imaging of pulmonary hypertension. Int J Cardiol Congenital Heart Dis. 2025;22:100619. doi:10.1016/j.ijcchd.2025.100619
23. Truong QA, Massaro JM, Rogers IS, et al. Reference values for normal pulmonary artery dimensions by noncontrast cardiac computed tomography. Circ Cardiovasc Imaging. 2012;5(1):147–154. doi:10.1161/CIRCIMAGING.111.968610
24. Liu A, Xu W, Xi L, et al. Cardiovascular metrics on CT pulmonary angiography in patients with pulmonary hypertension — re-evaluation under the updated guidelines of pulmonary hypertension. Insights Imag. 2023;14(1):179. doi:10.1186/s13244-023-01535-1
25. Chaosuwannakit N, Makarawate P. Prognostic value of right ventricular dysfunction and pulmonary obstruction index by computed tomographic pulmonary angiography in patients with acute pulmonary embolism. J Med Assoc Thailand. 2012;95(11):1457.
26. O’Corragain O, Alashram R, Millio G, et al. Pulmonary artery diameter correlates with echocardiographic parameters of right ventricular dysfunction in patients with acute pulmonary embolism. Lung India. 2023;40(4):306–311. doi:10.4103/lungindia.lungindia_357_22
27. Zhang Z, Yu C, Zhang H, Gao Z. Embedding tasks into the latent space: cross-space consistency for multi-dimensional analysis in echocardiography. IEEE Transactions Med Imag. 2024;43(6):2215–2228. doi:10.1109/TMI.2024.3362964
28. Holste G, Oikonomou EK, Khera R. AI-enabled echocardiography interpretation with multitask deep learning—reply. JAMA. 2025;334(21):1954–1955. doi:10.1001/jama.2025.16627
29. Ahmad A, Zou Y, Zhang P, et al. Non-invasive imaging techniques for early diagnosis of bilateral cardiac dysfunction in pulmonary hypertension: current crests, future peaks. Front Cardiovasc Med. 2024;11. doi:10.3389/fcvm.2024.1393580
 © 2026 The Author(s). This work is published and licensed by Dove Medical Press Limited. The
full terms of this license are available at https://www.dovepress.com/terms
and incorporate the Creative Commons Attribution
- Non Commercial (unported, 4.0) License.
By accessing the work you hereby accept the Terms. Non-commercial uses of the work are permitted
without any further permission from Dove Medical Press Limited, provided the work is properly
attributed. For permission for commercial use of this work, please see paragraphs 4.2 and 5 of our Terms.
© 2026 The Author(s). This work is published and licensed by Dove Medical Press Limited. The
full terms of this license are available at https://www.dovepress.com/terms
and incorporate the Creative Commons Attribution
- Non Commercial (unported, 4.0) License.
By accessing the work you hereby accept the Terms. Non-commercial uses of the work are permitted
without any further permission from Dove Medical Press Limited, provided the work is properly
attributed. For permission for commercial use of this work, please see paragraphs 4.2 and 5 of our Terms.