Back to Journals » Cancer Management and Research » Volume 13
Quantitative Analysis and Pathological Basis of Signal Intensity on T2-Weighted MR Images in Benign and Malignant Parotid Tumors
Authors Wei P, Shao C, Tian M, Wu M, Wang H, Han Z, Hu H
Received 14 May 2021
Accepted for publication 25 June 2021
Published 7 July 2021 Volume 2021:13 Pages 5423—5431
DOI https://doi.org/10.2147/CMAR.S319466
Checked for plagiarism Yes
Review by Single anonymous peer review
Peer reviewer comments 2
Editor who approved publication: Dr Chien-Feng Li
Peiying Wei,1,2,* Chang Shao,3,* Min Tian,4 Mengwei Wu,5 Haibin Wang,2 Zhijiang Han,2 Hongjie Hu1
1Department of Radiology, Sir Run Run Shaw Hospital, Zhejiang University School of Medicine, Hangzhou, People’s Republic of China; 2Department of Radiology, Affiliated Hangzhou First People’s Hospital, Zhejiang University School of Medicine, Hangzhou, People’s Republic of China; 3Department of Pathology, Affiliated Hangzhou First People’s Hospital, Zhejiang University School of Medicine, Hangzhou, People’s Republic of China; 4The Fourth Clinical Medical College, Zhejiang Traditional Chinese Medicine University, Hangzhou, People’s Republic of China; 5Department of Radiology, The Quzhou Affiliated Hospital of Wenzhou Medical University, Quzhou People’s Hospital, Quzhou, People’s Republic of China
*These authors contributed equally to this work
Correspondence: Zhijiang Han
Department of Radiology, Affiliated Hangzhou First People’s Hospital, Zhejiang University School of Medicine, No. 261, Huansha Road, Hangzhou, 310006, People’s Republic of China
Email [email protected]
Hongjie Hu
Department of Radiology, Sir Run Run Shaw Hospital, Zhejiang University School of Medicine, Hangzhou, 310016, People’s Republic of China
Email [email protected]
Objective: To investigate the value of the signal intensity on T2-weighted magnetic resonance (MR) imaging using quantitative analysis in the differentiation of parotid tumors.
Materials and Methods: MR data of 80 pleomorphic adenomas (PAs), 68 Warthin tumors (WTs), and 34 malignant tumors (MTs) confirmed by surgery and histology were retrospectively analyzed. The signal intensities of tumor, normal parotid gland, spinal cord, and buccal subcutaneous fat were measured, and the signal intensity ratios (SIRs) between the tumor and the three references were calculated. Receiver operating characteristic curve was used to determine the optimal threshold and diagnostic efficiency of SIR for differentiating PAs, WTs, and MTs.
Results: The area under the curve (AUC) of tumor to parotid gland SIR (SIRP), tumor to spinal cord SIR (SIRC), and tumor to buccal subcutaneous fat SIR (SIRF) for differentiating PAs and WTs was 0.922, 0.918, and 0.934, respectively. The sensitivity and specificity at an optimal SIR threshold were 86.3% and 91.2%, 80.0% and 97.1%, and 85.0% and 94.1%, respectively. The AUC of SIRP, SIRC, and SIRF for distinguishing PAs from MTs was 0.793, 0.802, and 0.774, respectively. The sensitivity and specificity at an optimal SIR threshold was 86.3% and 61.8%, 80.0% and 73.5%, and 82.5% and 73.5%, respectively. The AUC of SIRP, SIRC, and SIRF for distinguishing WTs from MTs was 0.716, 0.709, and 0.759, respectively. The sensitivity and specificity at an optimal SIR threshold were 61.8% and 82.4%, 55.9% and 82.4%, and 64.7% and 86.8%, respectively.
Conclusion: SIRP, SIRC, and SIRF on T2-weighted MR images had high diagnostic efficiency for differentiating between PAs and WTs, while SIRP and SIRC for differentiating between PAs and MTs, and SIRF for differentiating between WTs and MTs had relatively high diagnostic efficiency.
Keywords: parotid tumor, signal intensity ratio, pathology, magnetic resonance imaging, T2-weighted imaging
Introduction
Parotid tumors account for 70–80% of salivary gland tumors.1,2 Pleomorphic adenoma (PA) and Warthin tumor (WT) are the two most common benign tumors of parotid gland. However, the biological behaviors, treatment decisions and outcomes are different. The recurrence rate of PA is 6.7–45%, and the malignant transformation rate is 1.5% in the first 5 years and increases thereafter.3,4 Therefore, radical surgery is recommended in clinical practice.5,6 However, WTs do not recur and less than 0.1–0.3% of these tumors become malignant.1,7 Limited partial parotidectomy, enucleation, or conservative management are common approaches used for WTs.6,8 Compared with PA and WT, parotid malignant tumor (MT) warrant a total parotidectomy, which does not always allow for facial nerve preservation if the facial nerve is damaged during the operation.9 Therefore, an accurate differential diagnosis of parotid tumors is important for determining the proper treatment approach.
Preoperative ultrasound for diagnosis has some disadvantages, including strong operator dependence and poor ability to display the relationship between a deep lobe parotid tumor and surrounding structures.10 Computed tomography has low soft tissue resolution, ionizing radiation, and requires an iodine contrast agent,1,11 which contributes to limited application in parotid gland diseases. Although fine needle aspiration cytology (FNAC) is often used to evaluate parotid tumors, it shows variable sensitivity (47–90%) and specificity (82–100%),12–14 and small lesions or deep lobe lesions often provide insufficient specimen for analysis.9,15 In addition, the procedure involved with FNAC creates a risk of facial nerve palsy and also has the potential to cause tumor cells spread along the needle path.9,16,17 Compared with ultrasound and computed tomography, magnetic resonance (MR) imaging provides higher soft tissue resolution and multiparameter imaging and, in recent years, has been more commonly used for parotid tumor diagnosis. Conventional MR imaging, and advanced methods such as dynamic contrast-enhanced perfusion-weighted imaging (DCE-PWI) and diffusion-weighted imaging (DWI) have been reported in previous studies. Although DCE-PWI and DWI can respectively differentiating parotid tumors by semi-quantitative and quantitative analyses of time-intensity curve pattern and apparent diffusion coefficient values, there are relatively large inter-study differences in results, or standardization is still lacking.7,14,17–19 Besides, the interobserver variation and limited availability of the examinations seem to be potential obstacles to their widespread use.13,14 T2-weighted imaging, as a conventional sequence, can be used in all field strength equipment. The signal intensity on T2-weighted images is primarily judged by comparing the signal intensity of the lesion with that of normal parotid gland or adjacent muscles, and the observer subjectively evaluates the signal as high, equal, or low. Compared with the parotid gland with high signal intensity due to more fat in stroma, most parotid tumors show hypointense on T2-weighted images. While compared with the muscle with low signal intensity because of rich fibrous tissue, most tumors are iso- or slightly hyperintense. Thus, the judgment of signal intensity on tumor is completely different with different references. Therefore, there is a great need to develop a standard approach for quantifying the signal intensity on T2-weighted images.
To the best of our knowledge, there are only six prior reports on the use of signal intensity ratio (SIR) for differentiating parotid tumors.2,17,20–23 The references selected in these studies were cerebrospinal fluid (CSF), parotid gland, and spinal cord. Although these studies retrieved meaningful results, none could successfully differentiate PAs, WTs, and MTs in all cases. The use of CSF, parotid gland, and spinal cord as references has advantages and disadvantages, and there is no relevant literature to confirm the diagnostic efficacy of these different references. In this study, in addition to parotid gland and spinal cord, we also used buccal subcutaneous fat with stable and easily measured signal as a reference for the first time to obtain the SIRs of PAs, WTs, and MTs on T2-weighted images. This study aimed to assess the efficacy of SIR using various references and pathological basis on T2-weighted MR imaging for the differentiation of parotid tumors.
Materials and Methods
Patient Selection
This study was completed between January 2018 and March 2021 with a total of 278 consecutive cases. All cases were confirmed by surgery and histology. Inclusion criteria were as follows: (1) patients who had a definitive biopsy- or surgery-proven pathological diagnosis of PAs, WTs, and MTs, (2) patients underwent MRI examination. Exclusion criteria were as follows: (1) no non-fat-suppressed T2-weighted imaging, (2) no contrast-enhanced MR imaging, (3) the cystic area of tumor exceeding 90%, (4) presence of diffuse parotid disease, and (5) unqualified T2-weighted image quality. A flow diagram summarizing the initial candidates and each exclusion procedure is shown in Figure 1. Ultimately, 182 nodules from 165 patients were enrolled in the study. This retrospective study was approved by the Ethics Committee of the Affiliated Hangzhou First People’s Hospital, Zhejiang University School of Medicine (Hangzhou, Zhejiang Province, People’s Republic of China). Due to the retrospective nature of the study and the use of anonymized patient data, written informed consent for participation was waived. The work has been carried out in accordance with the Declaration of Helsinki.
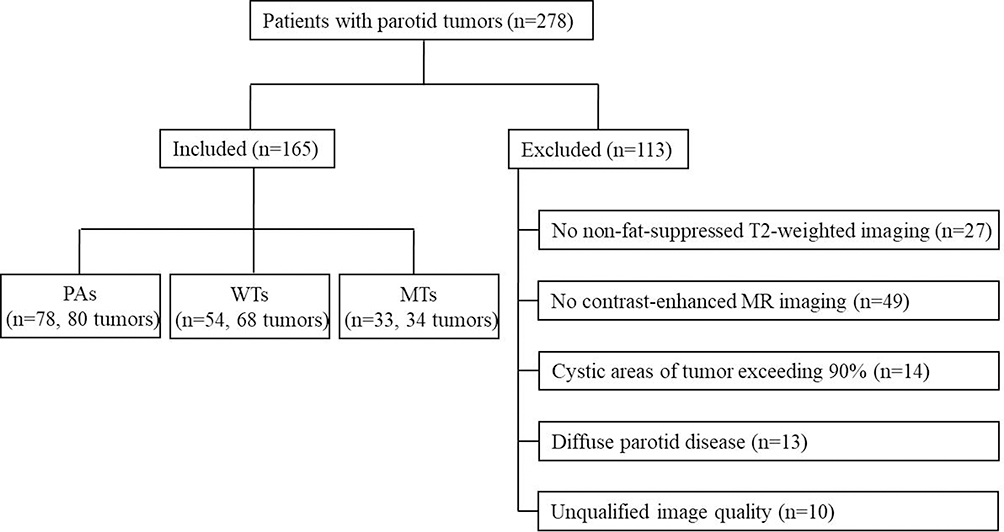 |
Figure 1 Flow diagram of patient selection and exclusion criteria for the initial study. |
Histopathology
All parotid tumors had a conclusive histopathological diagnosis confirmed by senior pathologists. Tissue specimens were cut into sections (4-μm thick) and fixed in 10% neutral formalin. All sections were stained using the haematoxylin and eosin method. The tissue sections were then examined under a light microscope.
MR Imaging
MR examinations were performed within 2 weeks before surgery in all patients. A 3.0T superconducting MR imaging system (Verio, Siemens Medical Systems, Erlangen, Germany) was used for MR imaging. The patient was placed in the supine position with head and neck coils, and transverse MR images were obtained using the parallel imaging technique. Transverse MR images were obtained using the parallel imaging technique. Non-fat-suppressed T2-weighted fast spin-echo imaging (TR/TE, 3000/96 ms; matrix, 320 ×320; field of view, 23×23 cm; section thickness, 4 mm; intersection gap, 0.8 mm) and non-fat-suppressed T1-weighted spin-echo imaging (TR/TE, 500/20 ms; matrix, 320 ×320; field of view, 23×23 cm; section thickness, 4 mm; intersection gap, 0.8 mm) were obtained.
Image and Histopathological Analysis
Two radiologists with 6 and 19 years of experience analyzed and measured the included MR data while blinded to the pathological results. The solid and cystic/necrotic areas on axial T2-weighted MR images were determined by referring to the enhancement amplitude of the tumor on axial pre- and post-contrast T1-weighted MR images. The areas with enhancement corresponded to the solid components, on the contrary, the areas without enhancement represented cystic/necrotic components. The solid areas were measured by placing the largest possible round or oval region of interest, while cystic/necrotic areas and blood vessels were avoided. The signal intensity of parotid gland, spinal cord, and buccal subcutaneous fat were preferentially measured at the same level as the tumor (Figures 2–4). When measuring the signal intensity of normal parotid tissue, the residual normal gland surrounding the tumor on the same side was used when available. For large tumors with few residual normal gland surrounding the tumor, the normal gland on the opposite side was measured and the blood vessels were avoided (Figure 4, Figure 5, Figure 6, Figure 7). When measuring the signal intensity of spinal cord, the central canal of spinal cord was avoided if it dilated. The maximum diameter of parotid tumours were measured. All measurements were made twice with a time interval of one week, and the average value of the two measurements was taken as the final measurement value. A pathologist with 9 years of working experience together with the two radiologists analysed the histopathological sections. The components of tumors were observed and correlated with the MR images.
 |
Figure 2 Pleomorphic adenoma of the right parotid gland in a 48-year-old woman. (A) T2-weighted image showed that SIRP, SIRC and SIRF were 1.38 (847.18/613.80), 2.32 (848.18/365.16), and 0.89 (848.18/951.89), respectively. (B) Pathological image (original magnification × 200) revealed large amounts of mucus areas (black pentagram) and cell-rich areas (black arrow). |
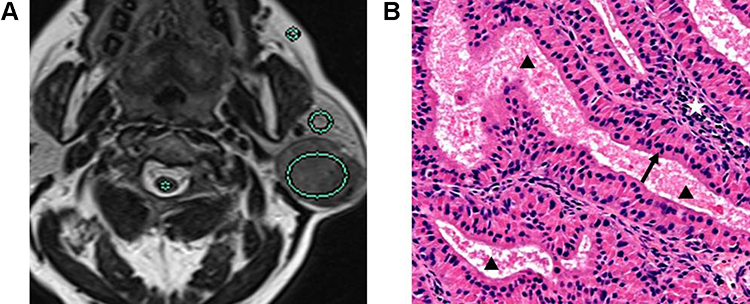 |
Figure 3 Warthin tumor of the left parotid gland in a 71-year-old man. (A) T2-weighted image showed that SIRP, SIRC and SIRF were 0.54 (304.32/563.56), 1.19 (304.32/255.73), and 0.35 (304.32/869.49), respectively. (B) Pathological image (original magnification × 200) revealed plenty of cysts mainly composed of eosinophilic proteinaceous secretions (black triangle). The cysts were lined with papillary proliferation of pseudostratified columnar epithelia (black arrow) and supporting stroma containing lymphoid tissue (white pentagram). |
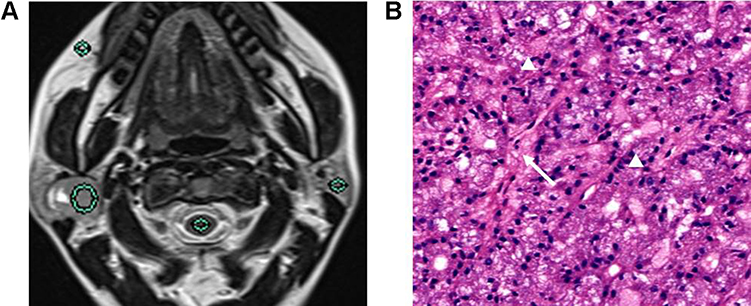 |
Figure 4 Acinic cell carcinoma of the right parotid gland in a 38-year-old woman. (A) T2-weighted image showed that SIRP, SIRC and SIRF were 1.09 (553.21/507.53), 1.71 (553.21/323.51), and 0.53 (553.21/1035.02), respectively. (B) Pathological image (original magnification × 200) revealed the tumor was filled with lots of solid tumor cells (white triangle) and a little mucus in the stroma (white arrow). |
Statistical Analysis
Variables with normal distribution were expressed as mean ± standard deviation, and variables with non-normal distribution were expressed as median [interquartile range (IQR, ie, P25–P75)]. Categorical variables were analyzed using the chi-squared test or exact Fisher test, and continuous variables were compared using the independent samples t-test or the Wilcoxon rank sum test. Receiver operating characteristic curve was used to analyze the performance of tumor to parotid gland (SIRP), tumor to spinal cord (SIRC), and tumor to buccal subcutaneous fat (SIRF) in the differential diagnosis of PAs, WTs and MTs. The optimal SIR threshold, sensitivity, specificity, and area under the curve (AUC) were calculated. Differences with P < 0.05 were considered to be statistically significant.
Results
Distribution of General Characteristics
A total of 165 patients [95 males and 67 females; aged range 14–87 years; mean 55.0 (38.5, 64.0) years] were included in the final analysis for this study. There were 80 PAs in 78 patients, 68 WTs in 54 patients, and 34 MTs in 33 patients (including 12 lymphoepithelial carcinomas, 6 squamous cell cancers, 5 lymphomas, 4 salivary duct carcinomas, 3 acinic cell carcinomas, 2 mucoepidermoid carcinomas, 1 basal cell carcinomas, 1 adenoid cystic carcinomas). The distribution of age, sex, and maximum diameter were shown in Table 1. Patients with WTs showed significantly male predominance than those with PAs (P < 0.001) and MTs (P < 0.001), whereas there was no significant difference in sex distribution between patients with PAs and MTs (P = 0.700). Patients with WTs were significantly older than patients with PAs (P < 0.001) and MTs (P = 0.002). No significant differences in maximum diameter were observed between PAs and WTs (P = 0.077), PAs and MTs (P = 0.821), and WTs and MTs (P = 0.059). P values between the parotid tumors were shown in Table 2.
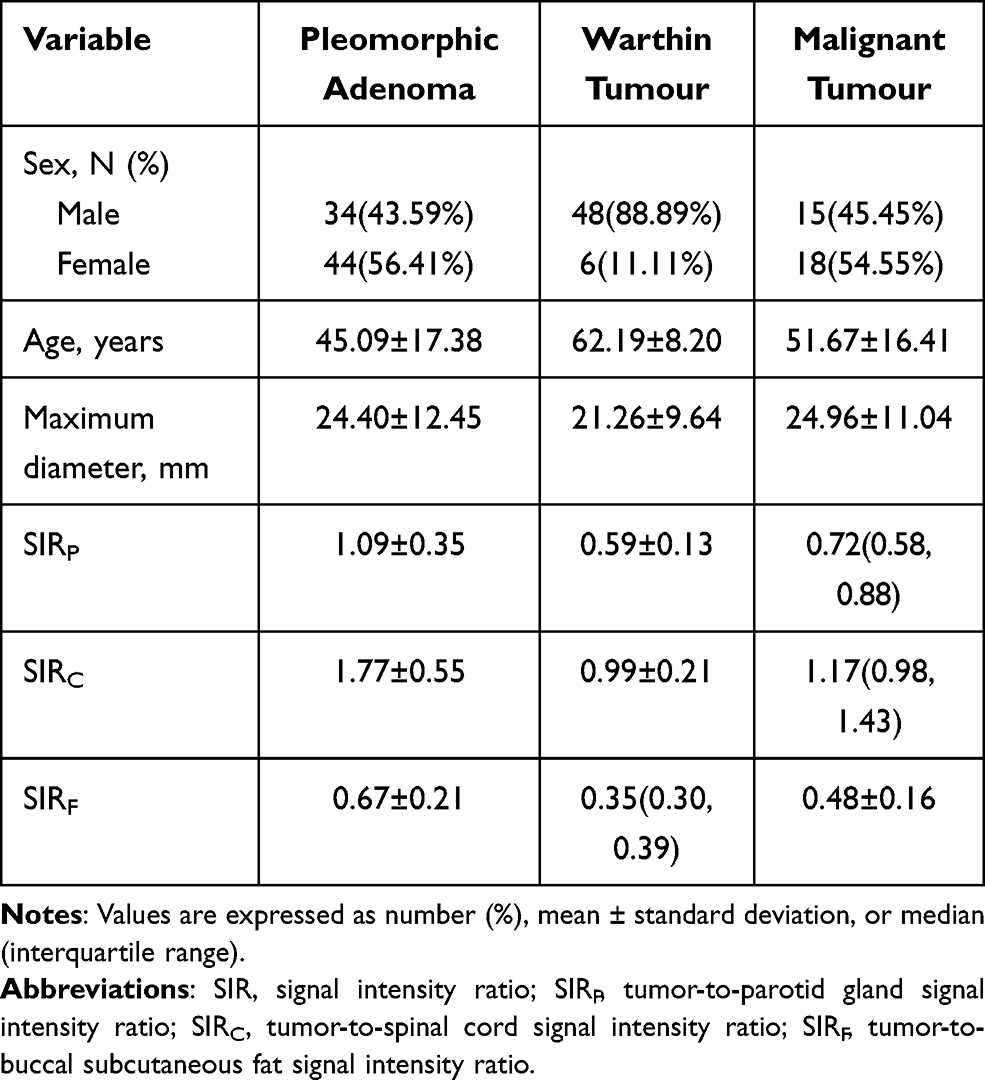 |
Table 1 General Characteristics and SIR Distributions |
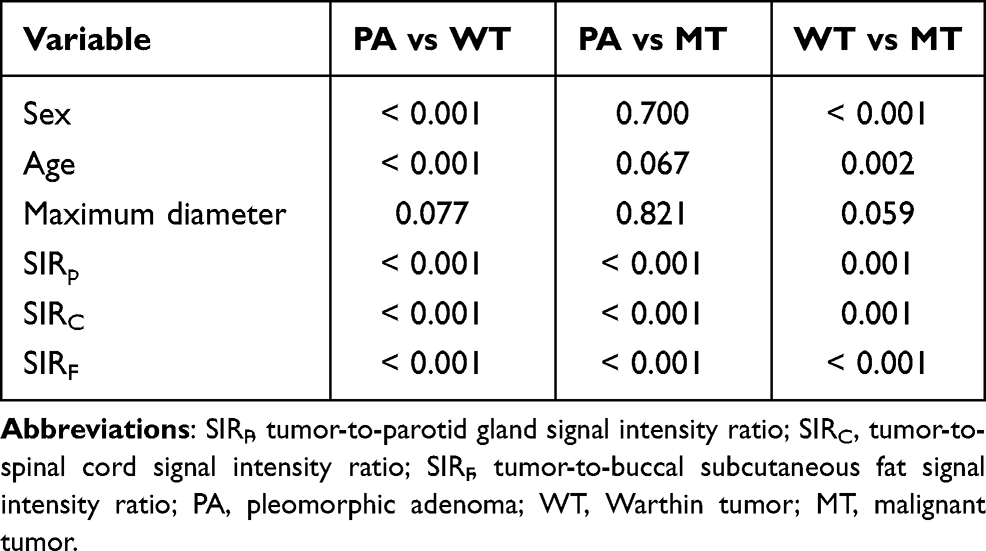 |
Table 2 P values Between the Parotid Tumors |
The Distribution and Diagnostic Efficacy of SIRP, SIRC, and SIRF
SIRP, SIRC, and SIRF of PAs, WTs, and MTs were shown in Table 1. The distribution of SIRP, SIRC, and SIRF in PAs, WTs, and MTs was statistically different (P < 0.001). SIRP, SIRC, and SIRF were significantly higher in PAs than in WTs (P < 0.001) and MTs (P < 0.001). SIRP, SIRC, and SIRF were significantly higher in MTs than in WTs (P = 0.001) (Table 2). The AUC, optimal threshold, sensitivity and specificity of SIRP, SIRC, and SIRF in differentiating between PAs and WTs, PAs and MTs, and WTs and MTs were shown in Table 3. The ROC curves of SIRP, SIRC, and SIRF for differentiating the parotid tumors were shown in Figures 5–7.
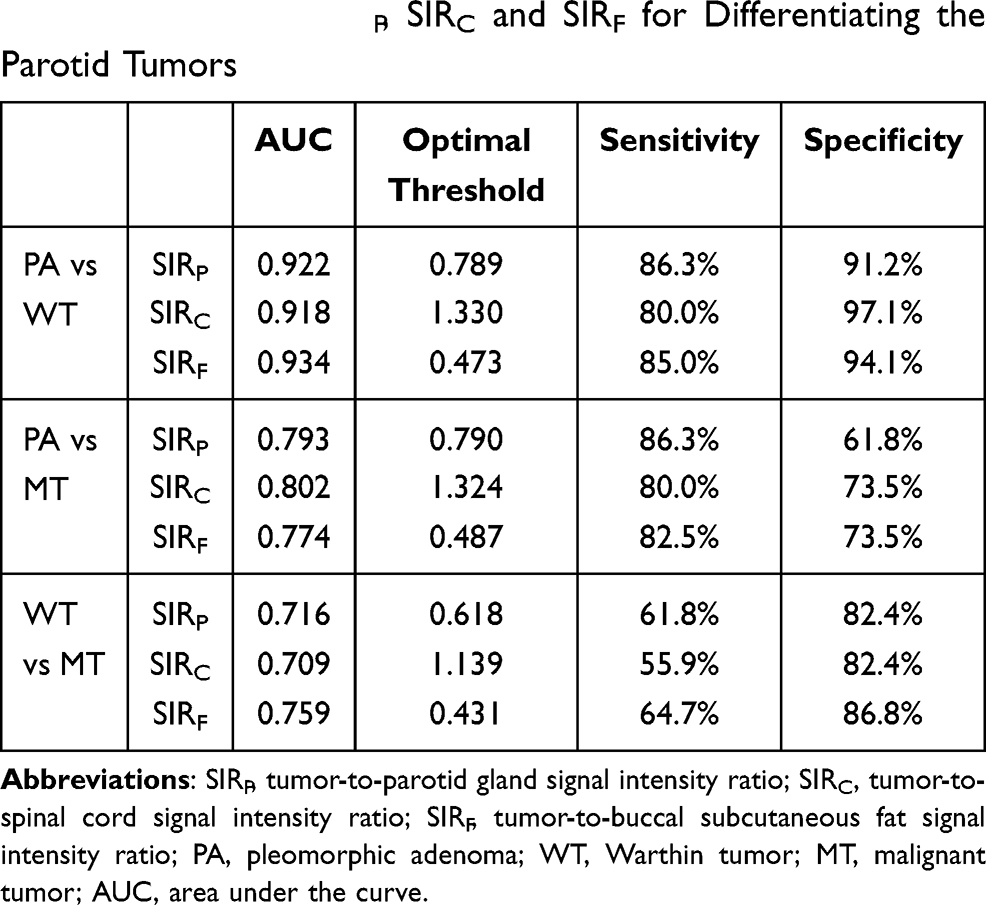 |
Table 3 Efficacy of SIRP, SIRC and SIRF for Differentiating the Parotid Tumors |
 |
Figure 5 ROC curve for differentiating between pleomorphic adenomas and Warthin tumors. |
 |
Figure 6 ROC curve for differentiating between pleomorphic adenomas and malignant tumors. |
 |
Figure 7 ROC curve for differentiating between Warthin tumors and malignant tumors. |
Comparison of Signal Intensity on T2-Weighted Images and histopathology
Among the 80 PAs, 74 PAs had high signal areas with different sizes and shapes on T2-weighted images, and the high signal areas of 38 cases were located at the edge and showed a “rimmed” shape. Correlation of the T2-weighted and contrast-enhanced images with the histological findings disclosed that these high signal areas were enhanced and corresponded to myxoid areas (Figure 2). Cystic and solid areas were observed microscopically in all 68 WTs. Most cysts of different sizes were filled with eosinophilic proteinaceous secretions, foamy cells, monocytes, neutrophils and nuclear fragmentations, and the solid areas were mainly composed of epithelial and lymphatic components (Figure 3). Although it was not possible to quantify cysts and lymphatic components on pathological sections, comparison with T2-weighted images suggested that more cysts and lymphatic components corresponded to lower signal intensity on T2-weighted images. Conversely, richer epithelial components corresponded to higher signal intensity on T2-weighted images. Among the 34 MTs, 28 cases showed low signal intensity on T2-weighted images with the following corresponding histological features: (1) a large number of cell components with large nucleocytoplasmic ratio, and (2) abundant collagen in stroma with large keratosis (Figure 4).
Discussion
We previously compared the maximum signal intensity on T1-weighted images of PAs, WTs, and MTs using the spinal cord in the same layer of the tumor as a reference, and concluded that SIRC on T1-weighted images was a valuable tool for differentiating WTs from PAs and MTs (AUCs were 0.901 and 0.851, respectively). However, it was unable to distinguish PAs from MTs.24 Based on our previous studies, we further explored the value of SIR in differentiating between the three parotid tumor types simultaneously. In this study, SIRP, SIRC, and SIRF were obtained by conventional T2-weighted imaging with parotid gland, spinal cord, and buccal subcutaneous fat as references, and the corresponding efficacies in the differential diagnosis of PAs, WTs, and MTs were evaluated. Our results demonstrated that the AUC of the three SIRs for identifying PAs and WTs all exceeded 0.918, with SIRF being the highest (AUC = 0.934). For identifying PAs and MTs, the AUC of SIRC and SIRP was 0.802 and 0.793, respectively; and for identifying WTs and MTs, the AUC of SIRF was the highest (AUC = 0.759). Therefore, we believed that SIRP, SIRC, and SIRF were valuable in the differential diagnosis of PAs, WTs, and MTs, particularly for differentiating PAs from WTs. While for differentiating MTs from PAs and WTs, relatively high diagnostic efficiencies could still be obtained if the appropriate references were used.
To date, there have been just five reports related to the quantitative study of the signal intensity of parotid tumors on T2-weighted images. Ikeda et al and Motoori et al previously used CSF as a reference to analyze the diagnostic value of SIR for parotid glands.21,23 The former concluded that the mean minimum SIR of WTs was lower than that of MTs,21 while the latter found that the minimum and maximum SIR was not able to distinguish PAs from MTs.23 Although both of these studies proposed SIR to differentiate parotid tumors, the use of CSF signal as a reference posed a challenge due to CSF fluctuation artifacts and limited CSF availability for measurement. Kato et al and Matsusue et al used the parotid gland and spinal cord as references respectively, and both concluded that SIR was higher in PAs than in WTs and MTs, with no statistical difference between WTs and MTs.2,17 Kato et al also used the spinal cord as a reference to compare the SIRs of WTs and oncocytomas, and showed that SIR was higher in WTs than in oncocytomas.22 However, using the parotid gland as a reference may be unreliable because the adipose tissues inside it increases with age. While the signal of the spinal cord at the level of parotid gland is often affected by the fluctuation artifacts of subdural CSF and central canal. In addition, none of these previous studies could identify PAs, WTs and MTs simultaneously by SIR on T2-weighted images, and only a single reference was selected for analysis, lacking the comparison of different references. In this study, in addition to using the parotid gland and spinal cord as references, we first proposed to use buccal subcutaneous fat as the reference to compare the value of SIRP, SIRC, and SIRF in differentiating parotid tumors. We found that SIRP, SIRC, and SIRF on T2-weighted images were able to distinguish between PAs, WTs, and MTs simultaneously, and the AUC of SIRF was the highest in differentiating WTs from PAs and MTs. Besides, the sample size in this study was larger than in previous studies.
The signal intensity on T2-weighted imaging was correlated with the concentration of free water molecules. Higher concentrations of free water molecules lead to stronger signal intensity on T2-weighted imaging, which histologically correspond to mucus or serous secretions, interstitial edema, cystic degeneration, etc. While lower concentrations of free water molecules lead to lower signal intensity on T2-weighted imaging, which histologically correspond to lymphoid tissue, fibrosis, collagenation, vitreous degeneration, calcification, and keratinizing beads, as well as eosinophilic proteinaceous secretions in the cysts of WTs.21,25 In this study, the SIR of PAs was the highest, while that of WTs was the lowest. Most PAs pathologically corresponded to more myxoid areas, and a few were mixed with myxoid areas and cystic areas, while WTs pathologically corresponded to numerous cysts mainly composed of eosinophilic proteinaceous secretions. The SIR of MTs was between that of PAs and WTs. Pathology showed that the tumors were mainly composed of cells with large nucleocytoplasmic ratio, and some were rich in collagen fiber stroma. However, some previous studies judged the cystic degeneration of PAs based on high signal intensity on T2-weighted images,7,17 which we believed was unreliable, as both cystic degeneration and mucus corresponded to high signal on T2-weighted images. This study combined contrast-enhanced MR images to avoided the non-enhanced cystic areas when measuring, thus the results were more reliable.
As we all know, DWI and DCE-PWI are also important quantitative parameters of differentiating between benign and malignant tumors, showing great potential. Mikaszewski et al used simultaneous DWI and DCE-PWI to identify parotid MTs and benign tumors, with sensitivity of 89.5% and specificity of 100%.14 Their team further differentiated MTs from PAs and WTs, with sensitivity of 88.9–94.4%, specificity of 88.9%–96.4%, and AUC of 0.949–0.969.18 However, in some other studies, DWI and DCE-PWI were difficult to distinguish MTs from WTs.2,7,17,20 It can be seen that these parameters have incomplete reproducibility and reliability, and a large sample size in more centers are needed. Although the diagnostic efficiency in our study was not as high as in that of Mikaszewski et al, T2-weighted imaging belongs to conventional sequence, which is easier to obtain due to no need for contrast agent and high field strength. It is conceivable that the combination of signal intensity quantization on T2-weighted images, DWI and DCE-PWI can be more helpful to differentiate benign and malignant parotid tumors.
The present study had several limitations. First, the study did not classify MTs according to the histological subtypes, while there are as many as 20 subtypes of MTs,26 and the incidence of single subtype is low and the sample size is small, making it difficult to classify MTs. Nearly all previous studies have faced the similar challenge.1,8–10,17,27,28 Sample size will be expanded for future studies through the combination of multiple medical centers to conduct a comparative study. Second, different parameters of MR imaging have certain value in the differential diagnosis of parotid tumors, and it is necessary to combine these parameters for comprehensive analysis in clinical practice. However, this study aimed to explore the diagnostic value of SIR with different references on T2-weighted images for parotid tumors. When the method is mature, it will be combined with other parameters for diagnosis. Third, inevitable MR technical issues such as magnetic field inhomogeneity and magnetic susceptibility artifacts may create differences in subcutaneous fat signals of different positions. The ipsilateral cheek has relatively stable signal and thick fat, and was therefore selected in this study as the region of interest to help avoid this discrepancy. Finally, this was a retrospective study and the cases were from the same medical center, thus selection bias was inevitable.
In conclusion, SIRP, SIRC and SIRF had high diagnostic efficiency in differentiating PAs from WTs, while SIRP and SIRC for differentiating PAs from MTs and SIRF for differentiating WTs from MTs had relatively high diagnostic efficiency. It was extremely important to select appropriate references for quantitative analysis of signal intensity in the differential diagnosis of benign and malignant parotid tumors.
Acknowledgments
This work was supported by the Medical Science Research Program of Zhejiang Province (2020RC091, 2021RC024).
Disclosure
The authors report no conflicts of interest in this work.
References
1. Elmokadem AH, Abdel Khalek AM, Abdel Wahab RM, et al. Diagnostic accuracy of multiparametric magnetic resonance imaging for differentiation between parotid neoplasms. Can Assoc Radiol J. 2019;70(3):264–272. doi:10.1016/j.carj.2018.10.010
2. Matsusue E, Fujihara Y, Matsuda E, et al. Differentiating parotid tumors by quantitative signal intensity evaluation on MR imaging. Clin Imaging. 2017;46:37–43. doi:10.1016/j.clinimag.2017.06.009
3. Rooker SA, Van Abel KM, Yin LX, et al. Risk factors for subsequent recurrence after surgical treatment of recurrent pleomorphic adenoma of the parotid gland. Head Neck. 2021;43(4):1088–1096. doi:10.1002/hed.26570
4. Antony J, Gopalan V, Smith RA, Lam AK. Carcinoma ex pleomorphic adenoma: a comprehensive review of clinical, pathological and molecular data. Head Neck Pathol. 2012;6(1):1–9. doi:10.1007/s12105-011-0281-z
5. Liu YJ, Lee YH, Chang HC, et al. Imaging quality of PROPELLER diffusion-weighted MR imaging and its diagnostic performance in distinguishing pleomorphic adenomas from Warthin tumors of the parotid gland. NMR Biomed. 2020;33(5):e4282. doi:10.1002/nbm.4282
6. Yabuuchi H, Matsuo Y, Kamitani T, et al. Parotid gland tumors: can addition of diffusion-weighted MR imaging to dynamic contrast-enhanced MR imaging improve diagnostic accuracy in characterization? Radiology. 2008;249(3):909–916. doi:10.1148/radiol.2493072045
7. Wang CW, Chu YH, Chiu DY, et al. JOURNAL CLUB: the warthin tumor score: a simple and reliable method to distinguish warthin tumors from pleomorphic adenomas and carcinomas. AJR Am J Roentgenol. 2018;210(6):1330–1337. doi:10.2214/AJR.17.18492
8. Takumi K, Nagano H, Kikuno H, Kumagae Y, Fukukura Y, Yoshiura T. Differentiating malignant from benign salivary gland lesions: a multiparametric non-contrast MR imaging approach. Sci Rep. 2021;11(1):2780. doi:10.1038/s41598-021-82455-2
9. Tartaglione T, Botto A, Sciandra M, Gaudino S, Colosimo C. Differential diagnosis of parotid gland tumours: which magnetic resonance findings should be taken in account? Acta Otorhinolaryngol Ital. 2015;35(5):314–320. doi:10.14639/0392-100X-693
10. Zhang D, Li X, Lv L, et al. A preliminary study of CT texture analysis for characterizing epithelial tumors of the parotid gland. Cancer Manag Res. 2020;12:2665–2674. doi:10.2147/CMAR.S245344
11. Zhang YF, Li H, Wang XM, Cai YF. Sonoelastography for differential diagnosis between malignant and benign parotid lesions: a meta-analysis. Eur Radiol. 2019;29(2):725–735. doi:10.1007/s00330-018-5609-6
12. Correia-Sá I, Correia-Sá M, Costa-Ferreira P, Silva Á, Marques M. Fine-needle aspiration cytology (FNAC): is it useful in preoperative diagnosis of parotid gland lesions? Acta Chir Belg. 2017;117(2):110–114. doi:10.1080/00015458.2016.1262491
13. Maraghelli D, Pietragalla M, Cordopatri C, et al. Magnetic resonance imaging of salivary gland tumours: key findings for imaging characterisation. Eur J Radiol. 2021;139:109716. doi:10.1016/j.ejrad.2021.109716
14. Mikaszewski B, Markiet K, Smugała A, Stodulski D, Szurowska E, Stankiewicz C. Diffusion- and perfusion-weighted magnetic resonance imaging-an alternative to fine needle biopsy or only an adjunct test in preoperative differential diagnostics of malignant and benign parotid tumors? J Oral Maxillofac Surg. 2017;75(10):2248–2253. doi:10.1016/j.joms.2017.03.018
15. Espinoza S, Felter A, Malinvaud D, et al. Warthin’s tumor of parotid gland: surgery or follow-up? Diagnostic value of a decisional algorithm with functional MRI. Diagn Interv Imaging. 2016;97(1):37–43. doi:10.1016/j.diii.2014.11.024
16. Zheng YM, Li J, Liu S, et al. MRI-based radiomics nomogram for differentiation of benign and malignant lesions of the parotid gland. Eur Radiol. 2020.
17. Kato H, Kanematsu M, Watanabe H, et al. Perfusion imaging of parotid gland tumours: usefulness of arterial spin labeling for differentiating Warthin’s tumours. Eur Radiol. 2015;25(11):3247–3254. doi:10.1007/s00330-015-3755-7
18. Mikaszewski B, Markiet K, Smugała A, Stodulski D, Szurowska E, Stankiewicz C. Clinical and demographic data improve diagnostic accuracy of dynamic contrast-enhanced and diffusion-weighted MRI in differential diagnostics of parotid gland tumors. Oral Oncol. 2020;111:104932. doi:10.1016/j.oraloncology.2020.104932
19. Yabuuchi H, Kamitani T, Sagiyama K, et al. Characterization of parotid gland tumors: added value of permeability MR imaging to DWI and DCE-MRI. Eur Radiol. 2020;30(12):6402–6412. doi:10.1007/s00330-020-07004-3
20. Jiang JS, Zhu LN, Chen W, et al. Added value of susceptibility- weighted imaging to diffusion-weighted imaging in the characterization of parotid gland tumors. Eur Arch Otorhinolaryngol. 2020;277(10):2839–2846. doi:10.1007/s00405-020-05985-x
21. Ikeda M, Motoori K, Hanazawa T, et al. Warthin tumor of the parotid gland: diagnostic value of MR imaging with histopathologic correlation. AJNR Am J Neuroradiol. 2004;25(7):1256–1262.
22. Kato H, Fujimoto K, Matsuo M, Mizuta K, Aoki M. Usefulness of diffusion-weighted MR imaging for differentiating between Warthin’s tumor and oncocytoma of the parotid gland. Jpn J Radiol. 2017;35(2):78–85. doi:10.1007/s11604-016-0608-5
23. Motoori K, Yamamoto S, Ueda T, et al. Inter- and intratumoral variability in magnetic resonance imaging of pleomorphic adenoma: an attempt to interpret the variable magnetic resonance findings. J Comput Assist Tomogr. 2004;28(2):233–246. doi:10.1097/00004728-200403000-00014
24. Wei PY, Shao C, Huan T, Wang HB, Ding ZX, Han ZJ. Diagnostic value of maximum signal intensity on T1-weighted MRI images for differentiating parotid gland tumours along with pathological correlation. Clin Radiol. 2021;76(6):
25. Minami M, Tanioka H, Oyama K, Itai Y, Sasaki Y. Warthin tumor of the parotid gland: MR-pathologic correlation. AJNR. 1993;14(1):209–214.
26. Choi SY, Lee E, Kim E, et al. Clinical outcomes of bulky parotid gland cancers: need for self-examination and screening program for early diagnosis of parotid tumors. BMC Cancer. 2021;21(1):178. doi:10.1186/s12885-021-07902-9
27. Xu Z, Zheng S, Pan A, Cheng X, Gao M. A multiparametric analysis based on DCE-MRI to improve the accuracy of parotid tumor discrimination. Eur J Nucl Med Mol Imaging. 2019;46(11):2228–2234. doi:10.1007/s00259-019-04447-9
28. Xu Y, Shu Z, Song G, et al. The role of preoperative computed tomography radiomics in distinguishing benign and malignant tumors of the parotid gland. Front Oncol. 2021;11:634452. doi:10.3389/fonc.2021.634452
 © 2021 The Author(s). This work is published and licensed by Dove Medical Press Limited. The
full terms of this license are available at https://www.dovepress.com/terms
and incorporate the Creative Commons Attribution
- Non Commercial (unported, 3.0) License.
By accessing the work you hereby accept the Terms. Non-commercial uses of the work are permitted
without any further permission from Dove Medical Press Limited, provided the work is properly
attributed. For permission for commercial use of this work, please see paragraphs 4.2 and 5 of our Terms.
© 2021 The Author(s). This work is published and licensed by Dove Medical Press Limited. The
full terms of this license are available at https://www.dovepress.com/terms
and incorporate the Creative Commons Attribution
- Non Commercial (unported, 3.0) License.
By accessing the work you hereby accept the Terms. Non-commercial uses of the work are permitted
without any further permission from Dove Medical Press Limited, provided the work is properly
attributed. For permission for commercial use of this work, please see paragraphs 4.2 and 5 of our Terms.