Back to Archived Journals » Research and Reports in Neonatology » Volume 8
Quantification of nutritive sucking among preterm and full-term infants
Authors Scherman A ![]() , Wiedrick J, Lang WC, Rdesinski RE
, Wiedrick J, Lang WC, Rdesinski RE ![]() , Lapidus J, McEvoy C, Abu-Shamsieh A, Buckley S, Rogers B, Buist N
, Lapidus J, McEvoy C, Abu-Shamsieh A, Buckley S, Rogers B, Buist N
Received 20 February 2018
Accepted for publication 13 July 2018
Published 8 October 2018 Volume 2018:8 Pages 53—63
DOI https://doi.org/10.2147/RRN.S165421
Checked for plagiarism Yes
Review by Single anonymous peer review
Peer reviewer comments 2
Editor who approved publication: Dr Carlo V Carlo bellieni
Video abstract presented by Ashley Scherman.
Views: 10141
Ashley Scherman,1,2 Jack Wiedrick,3 William C Lang,4 Rebecca E Rdesinski,5 Jodi Lapidus,3 Cynthia McEvoy,1 Aimee Abu-Shamsieh,6 Scott Buckley,7 Brian Rogers,1 Neil Buist1
1Department of Pediatrics, Oregon Health & Science University, Portland, OR, USA; 2Helfgott Research Institute, National University of Natural Medicine, Portland, OR, USA; 3Biostatistics and Design Program, Oregon Health & Science University, Portland, OR, USA; 4Department of Mathematics, Indiana University Southeast, New Albany, IN, USA; 5Department of Family Medicine, Oregon Health & Science University, Portland, OR, USA; 6Department of Pediatrics, University of California, San Francisco at Fresno, Fresno, CA, USA; 7Research Prototypes, Portland, OR, USA
Background: We developed summaries of oral bottle-feeding skills among preterm (<37 gestational weeks) and full-term (>37 gestational weeks) infants using a mechanical device (Orometer) to measure intraoral pressure changes, with accompanying automated software and analytics. We then compared the rates of change in feeding skills over several weeks (feeding trends) between preterm and full-term infants. We also compared group means at 40 weeks postmenstrual age (PMA).
Patients and methods: Healthy full-term and preterm infants capable of oral feeding were recruited from the Pediatric Outpatient Clinic at University of California, San Francisco, Fresno, and from the Oregon Health & Science University Doernbecher Neonatal Critical Care Unit, respectively. Feeding skill was quantified using an Orometer and automated suck-analysis software. Factor analysis reduced the >40 metrics produced by the Orometer system to the following seven factors that accounted for >99% of the sample covariance: suck vigor, endurance, resting, irregularity, frequency, variability, and bursting. We proposed that these factors represent feeding skills and that they served as the dependent variables in linear models estimating trends in feeding skills over time for full-term and preterm infants (maturation). At ~40 weeks PMA, we compared mean feedings skills between infants born preterm and those born full-term using predictions from our models.
Results: Feeding skills of 117 full-term infants and 82 preterm infants were first captured at mean PMA of 42.3 and 36.0 weeks, respectively. For some feeding skills, preterm and full-term infants showed different trends over time. At 37–40 weeks PMA, preterm infants took ~15% fewer sucks than infants born full-term (P=0.06) and generally had weaker suck vigor, greater resting, and less endurance than full-term babies. Preterm infants’ feeding skills appeared similar to those of full-term infants upon reaching ≥40 weeks PMA, although preterm infants showed greater variability for all factors.
Conclusion: The Orometer device, accompanying software, and analytic methods provided a framework for describing trends in oral feeding, thereby allowing us to characterize differences in maturation of feeding between healthy preterm and full-term infants.
Keywords: infant feeding, Orometer, neonatal, developmental, feeding problems, sucking patterns, sucking maturation
Plain language summary
Learning how to eat is a major challenge for preterm infants (infants born before 37 weeks of pregnancy). Feeding problems can cause longer hospital stays and are, at times, a sign of developmental concerns. We still diagnose many feeding problems by watching the infant eat. Measuring an infant’s sucking with a mechanical bottle-device and a computer software may help us to understand what normal and abnormal sucking look like. This then allows us to provide extra support to infants with abnormal sucking. We used a bottle (an Orometer) that measures the negative pressure in an infant’s mouth while they are drinking milk. We tested the feeding of 82 preterm and 117 full-term infants (those born after 37 weeks of pregnancy) over several weeks. The Orometer is attached to a computer that generates graphs of the infant’s sucking, known as sucking patterns. We observe factors such as how strong an infant’s sucking is, whether they show fatigue, and the number of sucks per feeding. Preterm infants had different sucking patterns over time compared to full-term infants. Similar to a growth chart, preterm infants’ change in feeding skills over time was different than that of infants born at term. When preterm infants reached term age, on an average, their feeding skills were similar to those of full-term infants, but with more variability. This could mean that preterm infants have a mix of mature and immature feeding patterns. The next step is to measure the feeding skills of infants at higher risk for developmental delays to see whether the Orometer can identify infants who will go on to have developmental delays.
Introduction
Nearly half a million infants in the United States are born preterm (<37 gestational weeks) per year,1 and oral feeding represents a critical challenge for these infants and their care providers. Neonatal oral feeding, which is a frequent problem, is implicated in delayed discharge from neonatal intensive care units (NICUs)2 and in hospital readmissions post-discharge.3 It is also frequently associated with poor growth and long-term development.4 Additionally, the inability to coordinate sucking, swallowing, and breathing – the major components of feeding – is a harbinger of nascent neurologic damage and may precede future impairment.5,6 While neonatal oral feeding is a major concern across NICUs and outpatient clinics, methods of identifying feeding problems are varied and predominantly subjective, with mixed ability to predict long-term developmental delays.7
Investigators, including Mizuno and Ueda,8 Lau et al,9 Medoff-Cooper et al,10 and ourselves11 have shown that objective quantification of infant feeding is possible and may reflect long-term developmental outcomes. A variety of parameters of infant feeding have been described, including quantifying the duration of individual sucks, recovery phase, interval suck burst length, pauses, and the average maximal suck pressures generated during a feeding session. Despite multiple reports of such studies, a review by Tamilia et al12 found major gaps across methods of measuring newborn feeding. In general, there is a paucity of standardized objective interpretations of data produced by suck quantification and in links between such interpretations and clinical significance.
Recently, Tamilia et al and Capilouto et al13,14 demonstrated that a device and an accompanying analytic system are capable of quantifying infant feeding and interpreted the metrics provided by these devices more objectively. Tamilia et al13 described a pilot study evaluating whether a mechanical device that measures infant feeding and automated analytical software could differentiate between the feeding patterns of four prematurely or low birth weight (LBW) infants (≤2,500 g) and five full-term (≥37 gestational weeks) infants weighing >2,800 g. Investigators found that the two groups differed on several parameters. They found that full-term infants had significantly higher suck pressures than preterm and LBW infants (80 vs 61 mmHg, P<0.001) and full-term infants had less variability per suck and per groups of sucks or bursts (P<0.001). Similarly, Capilouto et al14 found that, compared with healthy full-term infants (n=14), neonates deemed to be high-risk for developmental delays (n=28) had greater variability in two of the four measures at hospital discharge: length of sucking (coefficient of variation [CV]: 0.38 vs 0.35; P<0.05) and movement during sucking (smoothness) (CV: 0.85 vs 0.65; P<0.05). However, neonates defined as low-risk for developmental delays (n=12) were only significantly different from healthy full-term infants in variability of “smoothness” at testing prior to discharge (mean age of low-risk preterm infants was 35.6 weeks; CV: 0.9 vs 0.65 for low-risk preterm and full-term infants, respectively; P<0.05). Notably, while only the high-risk neonates showed significantly more variability in sucking metrics at discharge than full-term infants, both low- and high-risk neonates were of similar mean gestational ages at discharge: 36.4 (1.4) weeks and 37 (1.6) weeks, respectively. Although this suggests that the metrics may capture feeding that is discordant with age-related clinical expectations, the authors analyzed just four previously defined metrics of sucking.13 Evidence of quantification of neonatal feeding that limits bias would be enhanced by supporting data from different settings among larger samples, along with detailed descriptions of the analytic processes used.
We previously reported on a novel device (an Orometer; Figure 1) and a data analytical system (Suck Editor) that quantified intraoral negative pressure during feeding among healthy full-term infants by using a standard commercially available nipple and bottle.11 Herein, we describe, using a similar approach, the measurement of infant feeding among 117 healthy infants born at-term (≥37 gestational weeks) and 82 infants born preterm (<37 gestational weeks) tested over several weeks. Our current measurement system is enhanced by automated software to reduce subjectivity and is designed to quantify the coordination of events of sucking and swallowing using, in part, waveform analysis. Our goal was twofold: 1) to develop clinically meaningful summaries of the waveform data and 2) to compare the rates of change in feeding skills of otherwise healthy preterm infants with those of full-term infants over several weeks (feeding trends).
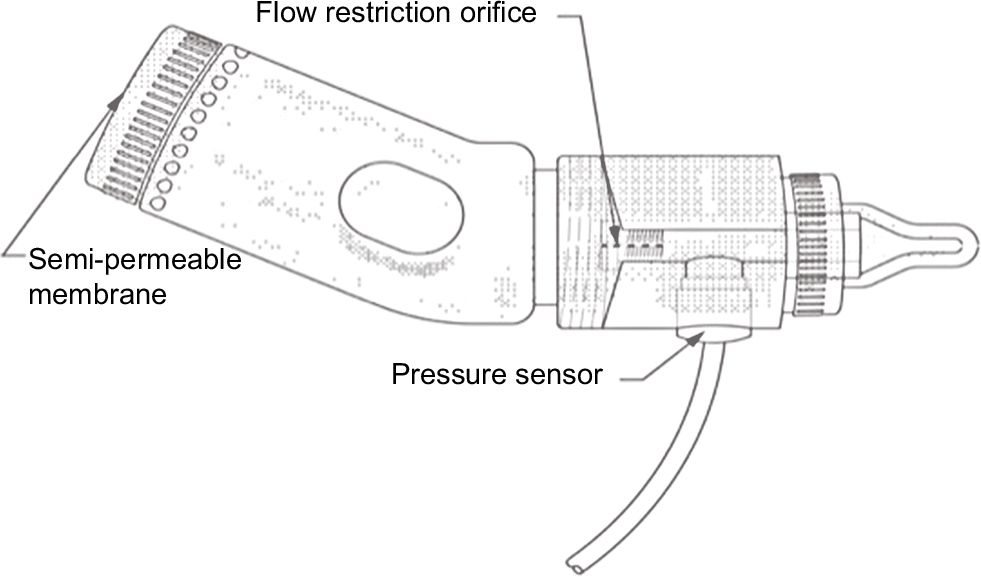 | Figure 1 Orometer. |
Materials and methods
Setting
Full-term infants were recruited and tested at the Children’s Health Center at Community Regional Medical Center at the University of California San Francisco Fresno (UCSF Fresno) campus in Fresno, California. Preterm infants were recruited and tested in the Doernbecher Neonatal Critical Care Unit (DNCC) at Oregon Health & Science University (OHSU) in Portland, Oregon. The institutional review boards of the respective universities approved the study.
Participants
As part of a larger study of 401 infants, 199 were selected as: 1) being healthy without significant morbidities and 2) having an Orometer tracing that did not meet technical exclusion. Out of the 199 infants, 117 were full-term and 82 were preterm. From these subjects, a total of 410 tests met the inclusion and exclusion criteria defined below (Figure 2).
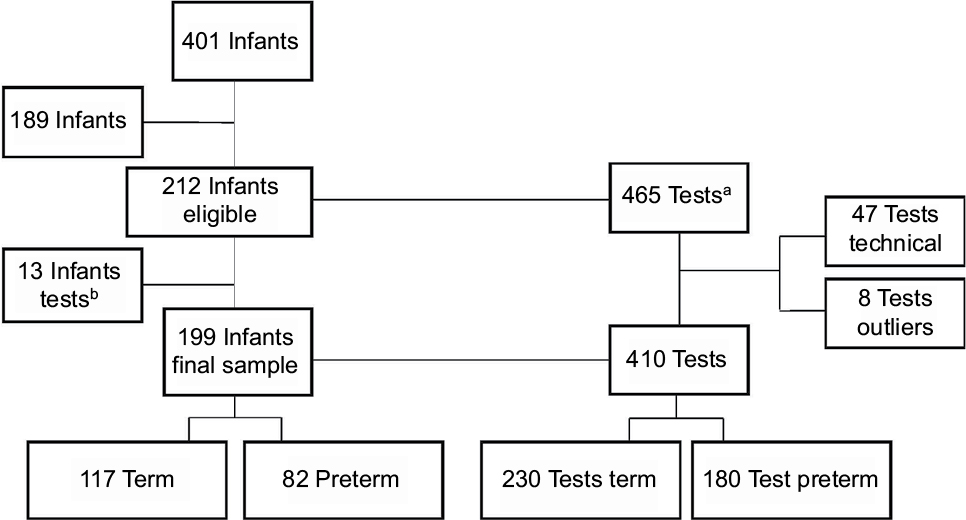 | Figure 2 Enrollment: inclusion and exclusion. Notes: aSome infants had more than one test sessions. bThese infants had only one test session and it was excluded. |
The parent or guardian of eligible infants provided written informed consent, and the study staff tested the infants. Infant and maternal medical histories were recorded, and determination of abnormal medical or abnormal maternal pregnancy history was made at the time of recruitment by clinician-authors McEvoy or Rogers at OHSU and by Abu-Shamsieh at UCSF Fresno.
Inclusion and exclusion criteria
Full-term infants deemed healthy in accordance with the eligibility criteria described above, as well as those currently bottle feeding and with a normal feeding history based on medical records or maternal reports were included. Preterm infants were included if they did not exhibit significant comorbidities and were able to consume 10 mL of fluid by mouth at least three times in 24 hours using the DNCC unit’s standard nipple and bottle system. Infants were ≤3 months of age at the initial study visit. We excluded 189 infants from this study owing to medical problems in the infant or mother. Examples of the latter included insulin-dependent diabetes and prenatal illicit drug intake. Significant infant medical complications included grades III–IV intraventricular hemorrhage or other major neurologic complications; multiple congenital abnormalities or known genetic syndromes; current infection; birth defects affecting facial, muscular, and/or the central nervous system; gastrointestinal tract abnormalities such as gastroschisis or omphalocele; or significant respiratory disease such as bronchopulmonary dysplasia.
Test device
This study used the Orometer and automated suck analysis software modified from our previous report.11 The Orometer consists of three parts: a 2-inch-long flow chamber with a restriction orifice at the inlet; a centrally located pressure sensor, and an anti-backflow valve placed just before the nipple (Figure 1). A VentAire® bottle (Playtex Corp., Westport, CT, USA) was the fluid reservoir and the nipples were medium flow Enfamil (Mead Johnson Nutrition, Glenview, IL, USA). As the outlet orifice is larger than the inlet, sucking creates a pressure differential that can be measured by strain gauges mounted inside the pressure sensor. An extremely low-noise, high-performance strain gauge signal conditioner amplifies the output of the pressure sensor. Continuous data on intraoral sucking pressure are recorded on a computerized data collection system. Variations in intraoral pressure during feeding are captured and displayed continuously in real time. Data generated by the device can be digitized, decimated, archived, stored, transmitted, or displayed as desired.
Feeding sessions
The tests coincided with an infant’s usual feeding schedule (every 2 or 3 hours). Consecutive testing occurred no more than once in 24 hours. Test sessions for full-term infants occurred at the pediatric outpatient clinic. Test sessions for preterm infants took place in the DNCC unit, except for one that was conducted after discharge.
Study personnel were registered nurses who used the DNCC feeding readiness guideline, adapted from the Infant-Driven Feeding Readiness Scales by Ludwig and Waitzman15 in which scoring is from 1 to 5, with “1” indicating the most readiness to feed and “5” indicating least readiness. Tests were not performed if the feeding readiness score was >3 (the universal cutoff for feeding attempts in the DNCC), or if potentially stressful events had occurred close to feeding time (ie, heel sticks or eye exams), or if the mother desired to breastfeed.
In both centers, the feeder was the infant’s primary caretaker – typically a nurse or parent – while study personnel operated the equipment. The feeder was instructed to feed the infant in a comfortable position using a premeasured amount of fluid (either formula or breast milk). Recording began when the nipple was placed in the infant’s mouth and was stopped when the fluid was emptied or the infant was tired, as indicated either by stopping sucking for >1 minute or at the caretaker’s discretion in the case of preterm infants in the DNCC unit. Study personnel documented pauses in feeding for burping or apneic events (no respiratory effort for ≥20 seconds). Volume consumed was measured by weighing the bottle before and at the end of the test. A suck was defined as having a deflection of at least 2 Torr (mmHg; Figure 3), a number chosen after observation showed that nutritive sucking commences at that threshold of pressure; only 1.2% of all deflection amplitudes are <2 Torr. To compensate for the natural variability in actual sucking commencement, the onset of feeding was defined as the beginning of the first 3-second interval where each second-long block contains at least 2 Torr-s of integrated area (Figure 3). The end of feeding activity was defined as the end of the last “activity burst,” a block of consecutive 1-second interval containing at least 1 Torr-s of integrated area and separated from other activity bursts by at least 3 seconds of no activity.
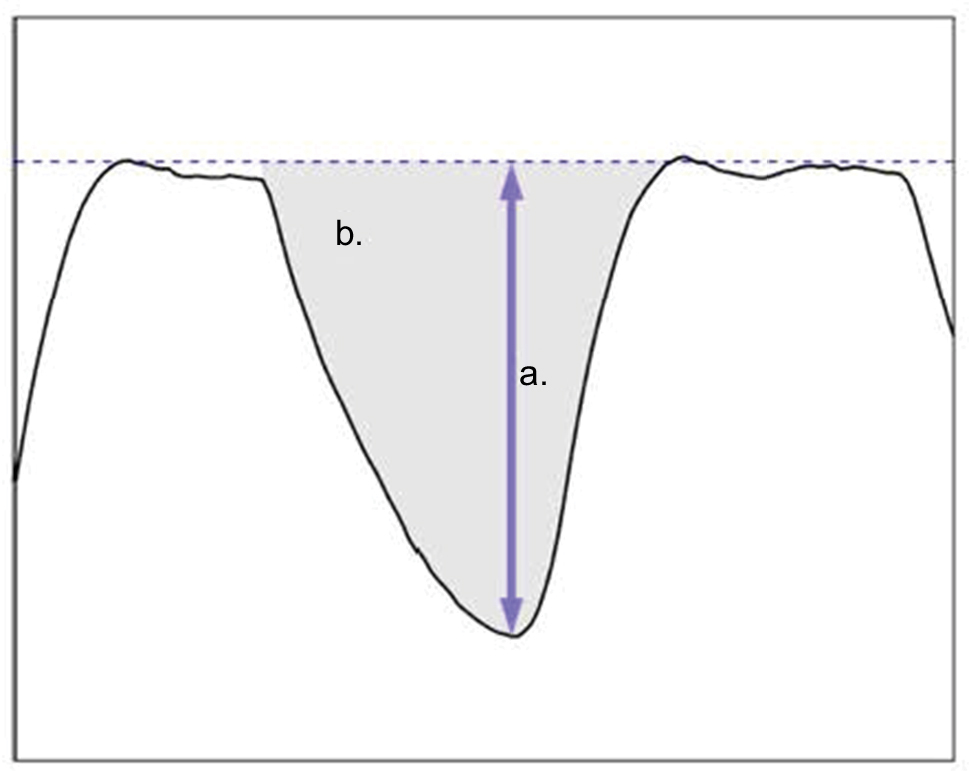 | Figure 3 Suck amplitude and integrated area. Notes: (a) This shows the tracing for subject 101, test 10105, from 106.5 to 107.9 seconds; this is the 95th suck in the tracing. The vertical axis goes from −65 to 5 mmHg, and the indicated amplitude is 43.9 mmHg. The dashed baseline is a proxy for the zero-pressure line. (b) The units are in seconds×Torr (mmHg). If an infant produces a pressure of 25 Torr for 0.6 seconds, the area would be 25×0.6=15 (the area of the suck shown is 15.3 Torr-s). |
Statistical analysis
Our goal was to estimate how feeding skills changed over time (feeding trends) for groups of preterm and full-term infants and how preterm infants’ change over time compared to the change over time of full-term infants. The progression from quantifying individual infant feeding to comparing feeding trends among the two groups of infants required the following steps:
- exclude questionable and outlier feeding tests (eg, very short feeding sessions, voltage issues with the Orometer, intervals where recording of feeding was disrupted per the tester’s notes, etc);
- reduce the >40 metrics produced by the Orometer to meaningful summaries called factors;
- estimate feeding trends for preterm and full-term infants using the factors defined in step 2, and then compare those estimated feeding trends between groups of preterm and full-term infants.
Questionable and outlier exclusions – Step (1)
Orometer tests were deemed questionable owing to technical failures affecting the output signal of the device (eg, severe baseline wander, artifact or degraded signals, anomalous spikes) and if the test sessions were <150 seconds in duration. The Orometer output variables are calculated based on the first 300 seconds of feeding session time, so attempting to use tests shorter than 150 seconds would have involved excessive extrapolation. In order to ensure fair comparisons for suck counts and other time-dependent measurements, such as integrated area, tests that lasted between 150 and 300 seconds were inversely weighted for these measures by the fraction of 300 seconds recorded. The average included test was 287 seconds (96% of expected duration); thus, in almost all cases, the weighting was of minimal impact.
An outlier was defined as any observation with Mahalanobis distance exceeding the 99.5 chi-squared percentile cutoff. Mahalanobis distance is a way of measuring the separation between a data point and the center of a group of data points with respect to many variables, where the correlations among the variables are taken into account.16,17 Based on real-time feeding session notes and analysis, the failed tests fell into two classes: excessively low-energy sessions, where the infant was sleeping or distracted rather than feeding; and excessively high-energy sessions of short duration, where extrapolation to 300 seconds based on the observed data would dramatically overstate the infant’s feeding capacity. The final sample consisted of 199 infants providing 410 tests.
Reduce the Orometer metrics – Step (2)
Many of the >40 metrics produced by the Orometer represent similar components of feeding such as mean suck peak amplitude and median suck peak amplitude, so it was necessary to reduce the complexity of this information by aggregating highly intracorrelated blocks of metrics through factor analysis.18 Factor analysis also allowed us to describe underlying relationships among the metrics that may not be directly measurable, but may be relevant in identifying abnormal feeding. For example, the vigorousness of a suck (suck vigor; Figure 4) is defined not only by peak amplitude but also incorporates the time to get to peak amplitude (slope; faster is more vigorous) and the total pressure maintained over the duration of the suck (area; larger is more vigorous). The measure of feeding “endurance” includes number of bursts (4 seconds separation from suck peak to suck peak), speed of sucks per burst, and duration of bursts. These factors reflect feeding skills and are the dependent variables in our linear modeling of feeding trends for the two infant groups.
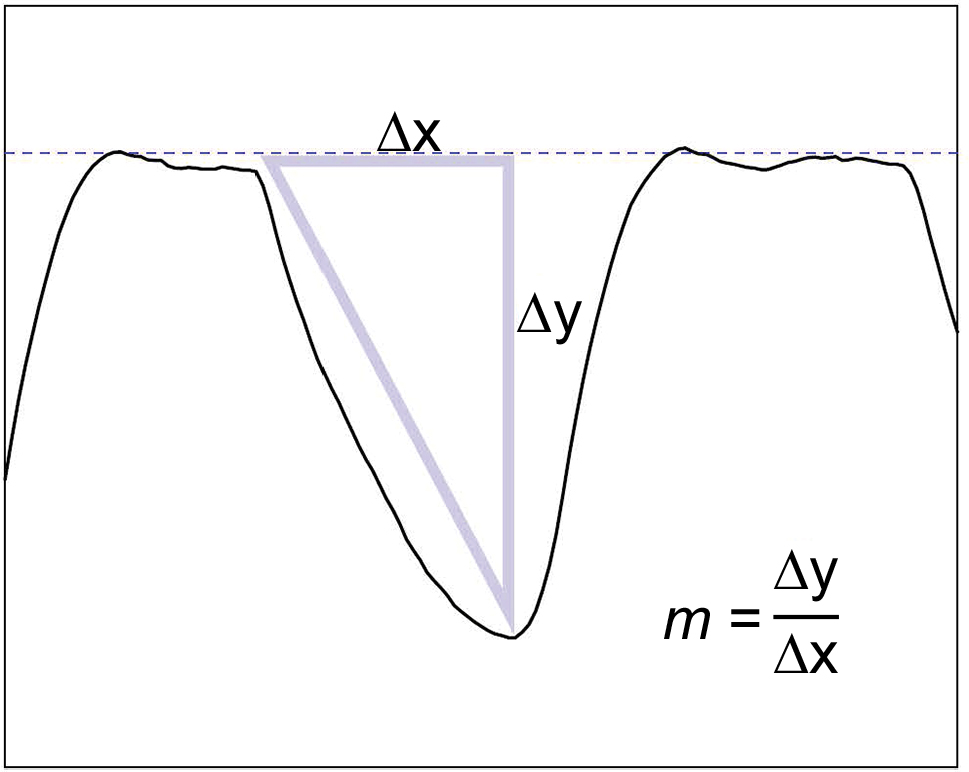 | Figure 4 Suck vigor. Notes: The suck vigor slope is the average slope from the beginning of the suck to the maximum negative pressure, as indicated by the triangle; the slope is computed as the “rise over run” (Δy/Δx), and the units are mmHg/s. The slope indicated here is 116 mmHg/s; the pressure changes from about −9 to −53 mmHg in about 0.38 seconds. y is the pressure as a function of time x; the slope is the change in y over the change in x, or in symbols, m = Delta y / Delta x. |
We performed a correlated factor analysis19 of all baseline feeding tests for the 46 healthy full-term infants whose baseline test occurred at postmenstrual age (PMA) <42 weeks.19 Each infant contributed just one baseline test. The cutoff of 42 weeks was chosen as a compromise between the need for adequate sample sizes and the need to minimize age confounding in the factor scores. The factor analysis reduced the number of variables from >40 to just seven factors (Table 1) that accounted for >99% of the sample covariance.
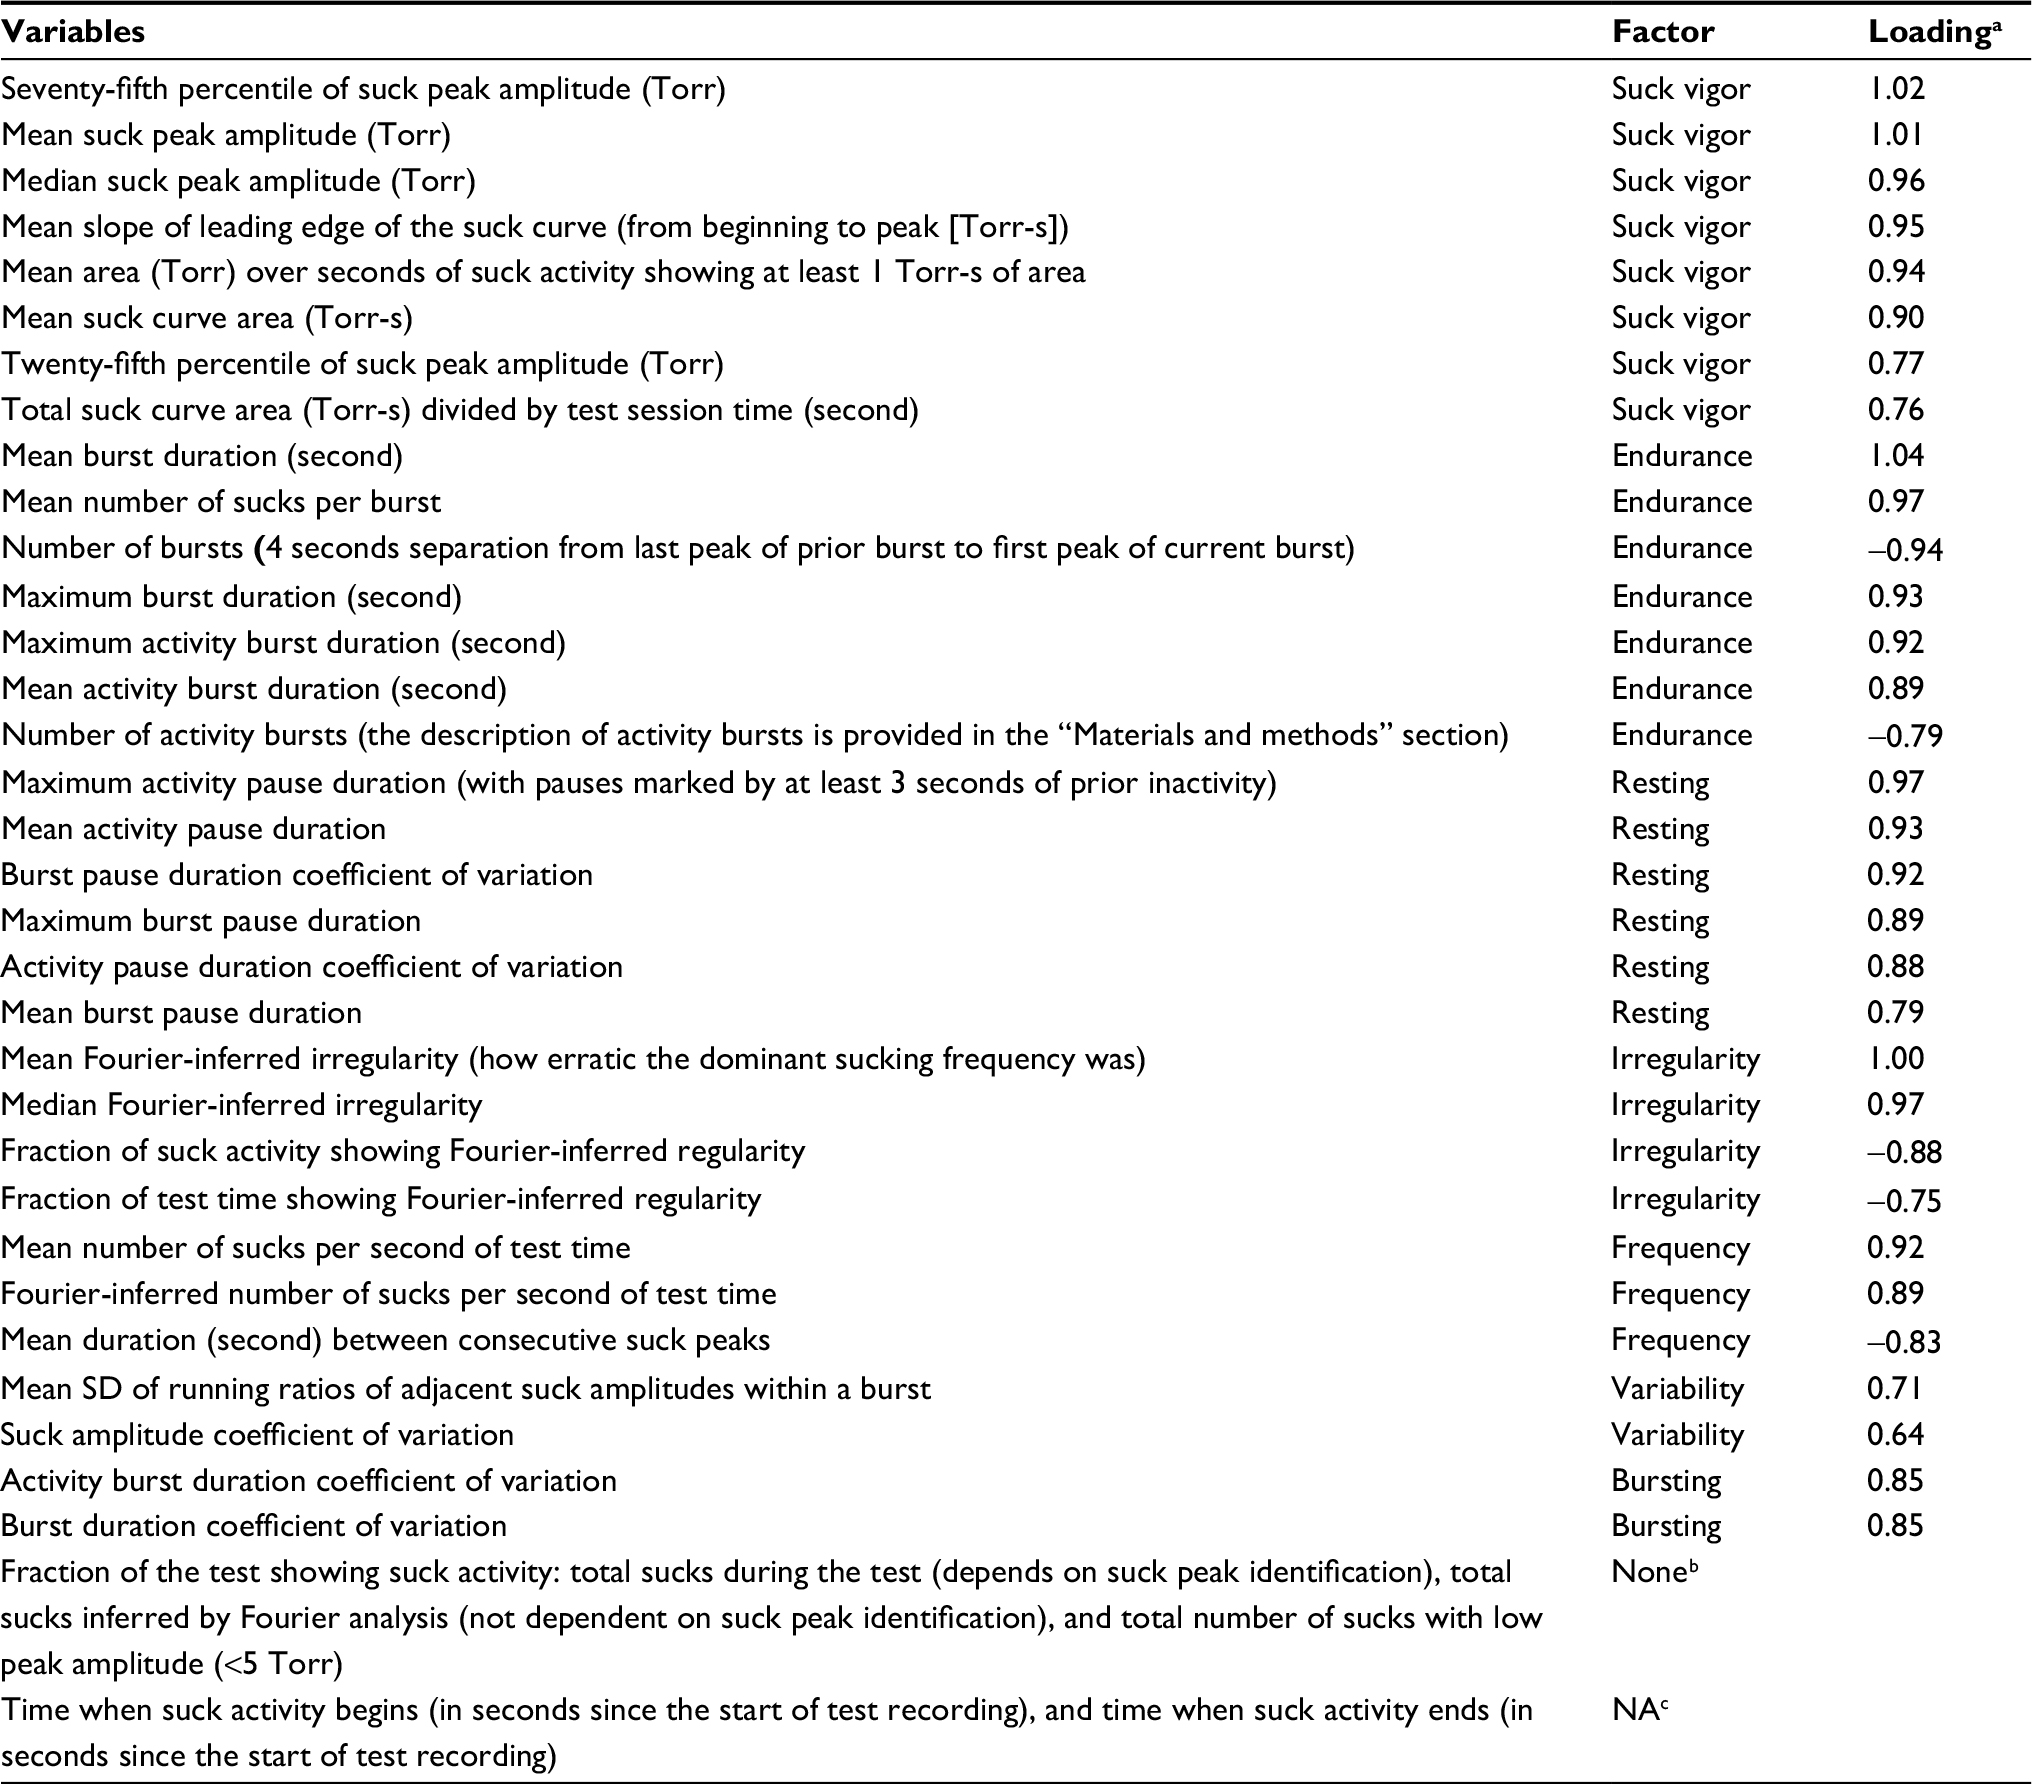 | Table 1 Factors and their major associated Orometer variables Notes: aThe loading value roughly represents the correlation between the component variable and the underlying factor it partly measures (the loading value is not exactly a correlation in our case because of the oblique promax rotation; explained in the “Materials and methods” section). Higher values indicate a close semantic relationship between the variable and the factor, and the component with the largest loading in absolute value can be considered the most prototypical expression of the meaning of the factor among the contributing variables. Note that factor scores for each factor are computed as a linear combination of all the variables that were included in the factor analysis, not just the ones that loaded most heavily on the factor. bThese variables did not load strongly on any factor but instead showed moderate associations with two or more separate factors. We view their perspective on the feeding performance (especially the suck count variables) as overall summary measures. cThese variables were only used for weighting purposes and did not enter into the factor analysis. |
To examine whether the above groupings of Orometer metrics (factors) were measuring similar components of infant feeding, we computed Cronbach’s α’s20 for each factor based on the baseline tests for all 135 infants with baseline PMA <42 weeks. Most of the alpha scores were well above 0.90 (Table 2), which shows a high degree of internal consistency, suggesting that the groupings of metrics that make up each factor are likely measuring similar underlying feeding concepts.
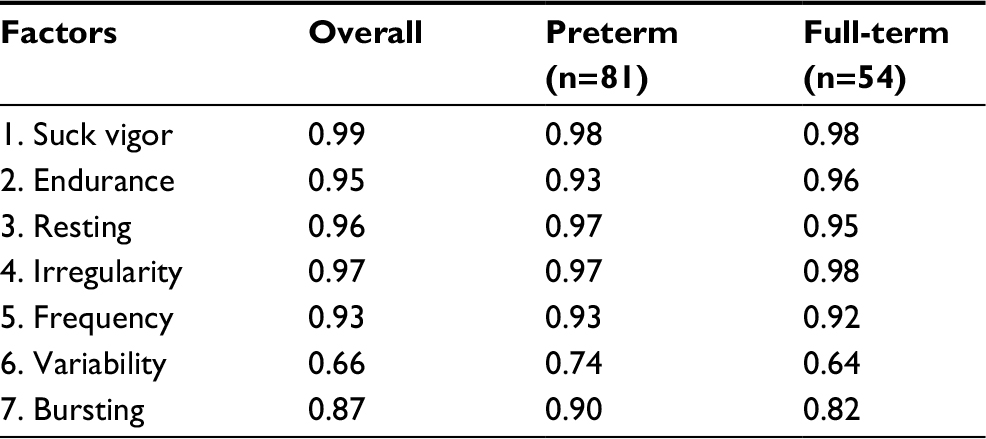 | Table 2 Internal consistency of factors (Cronbach’s α) Note: Factors are listed in the order of proportion of covariance in the Orometer measures explained by the factor. |
Estimate and compare feeding trends – Step (3)
To estimate feeding trends over time (maturation), we used observations of infant feeding from multiple time points and compared the group-level rates of change over time (or slopes) between preterm and full-term infants. We modeled change in average feeding skills over time within each group as a linear trend. To account for multiple measurements on the same infant over time-variable intervals between feedings, we employed a linear mixed model framework.21 In our model, the independent variables were age in weeks, group status (preterm vs full-term), and the interaction between age in weeks and group status. The dependent or outcome variables included all seven factors plus total number of sucks over a feeding, as this is commonly cited in the literature as important characteristic of sucking maturation7 (Table 2).
The eight outcome variables representing feeding skills were analyzed in separate regressions. The primary estimate of interest was the age-by-group interaction term, which represents the difference in the rate of change in feeding skills between the two groups. We included random intercept and slope terms to allow for different starting skill levels and rates of change for each infant. Because we used a subset of tests to extract our factors, we also allowed for differential longitudinal correlation for the tests that were used in the factor analysis vs those that were not. No other covariate adjustments were made in the models.
We visualized estimated feeding trends for preterm and full-term infants by plotting the predicted trends for each group on the same graph (Figure 5). To further illustrate the age-by-group interaction results, we tabulated the average percent change in feeding skills per week for each group (Table 5). As each of the factors is measured on a different index scale, the age-by-group interactions are best viewed in terms of percent change per week of PMA. The resulting ratios are unitless and, therefore, directly comparable across factors.
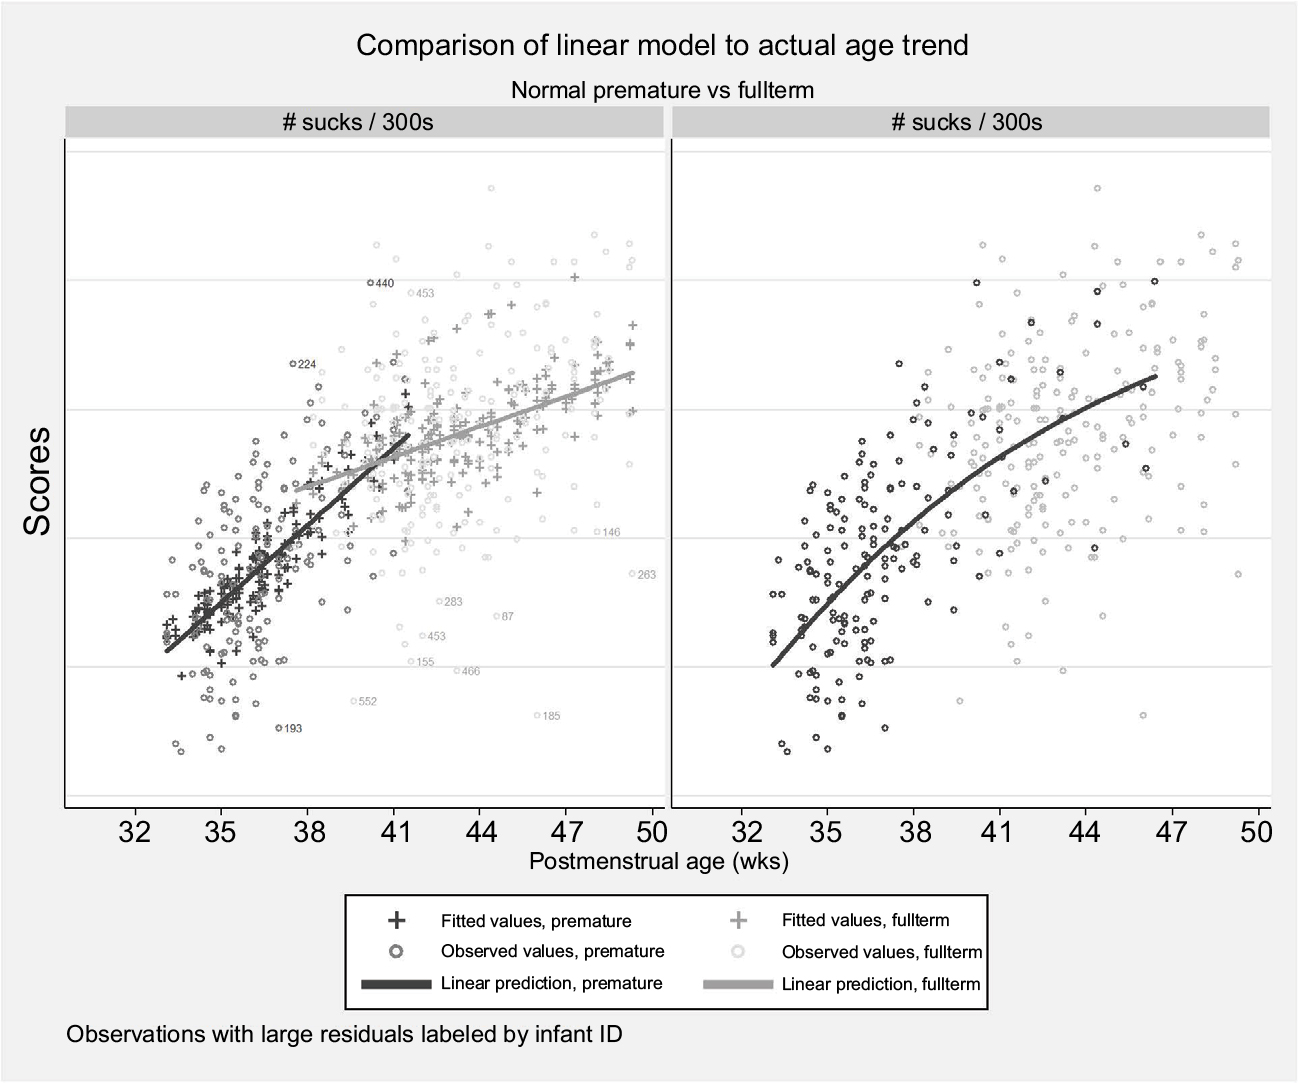
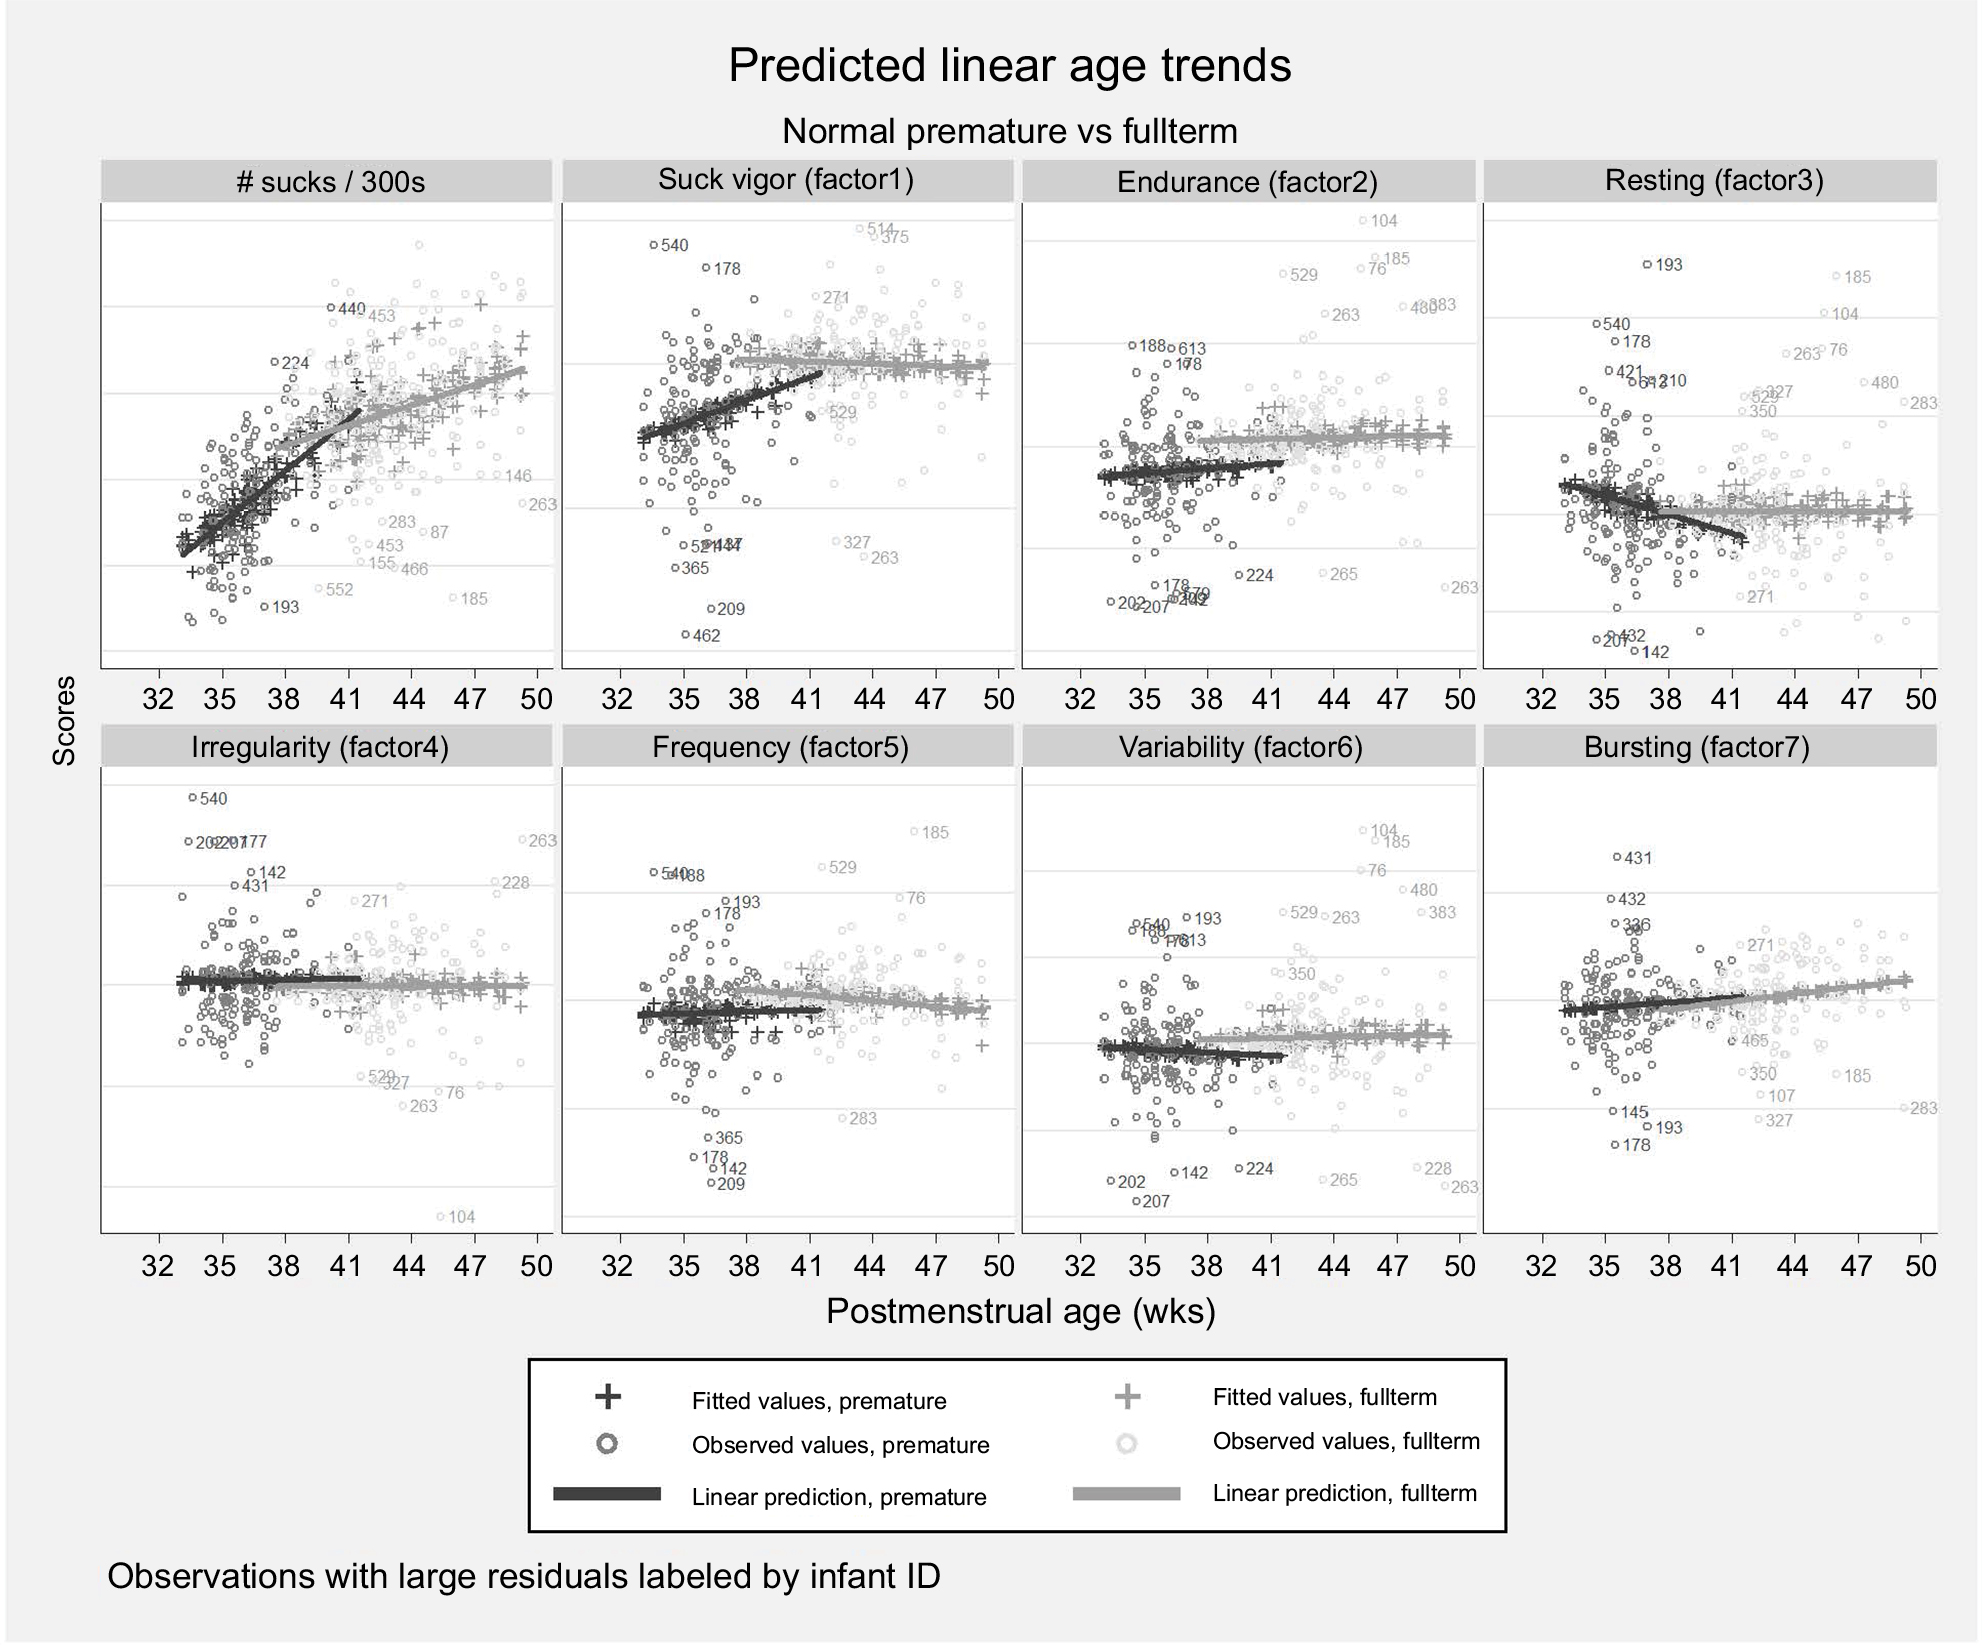 | Figure 5 Predicted age trends. Notes: Patterns of linear age trends are shown for preterm and full-term infants as estimated from mixed growth models for suck counts and the seven factors extracted in the factor analysis. The linear fit is generally satisfactory over the short time windows under consideration, but the wide scatter of observed values shows the high degree of variation across individual tests, even within the respective groups. Note that the horizontal scales are deliberately left unlabeled because the factor score are indices; hence, only relative differences are important. Abbreviation: wks, weeks. |
Results
The demographic characteristics of the subjects are presented in Table 3. Mothers’ mean age at delivery in both groups was in the mid-to-late 20s. Mean gestational age at birth in the preterm group was 33.4 weeks and mean gestational age at birth in the full-term group was 39.3 weeks. Mean PMA at baseline in the preterm group was 36.0 weeks and in the full-term group was 42.3 weeks. Only 6% of the full-term infants were non-singleton, whereas the rate was 27% in the preterm infants. The male-to-female percentages were 62:38 for the preterm group and 53:47 for the full-term group. Vaginal deliveries were 45% in the preterm group and 71% in the full-term group.
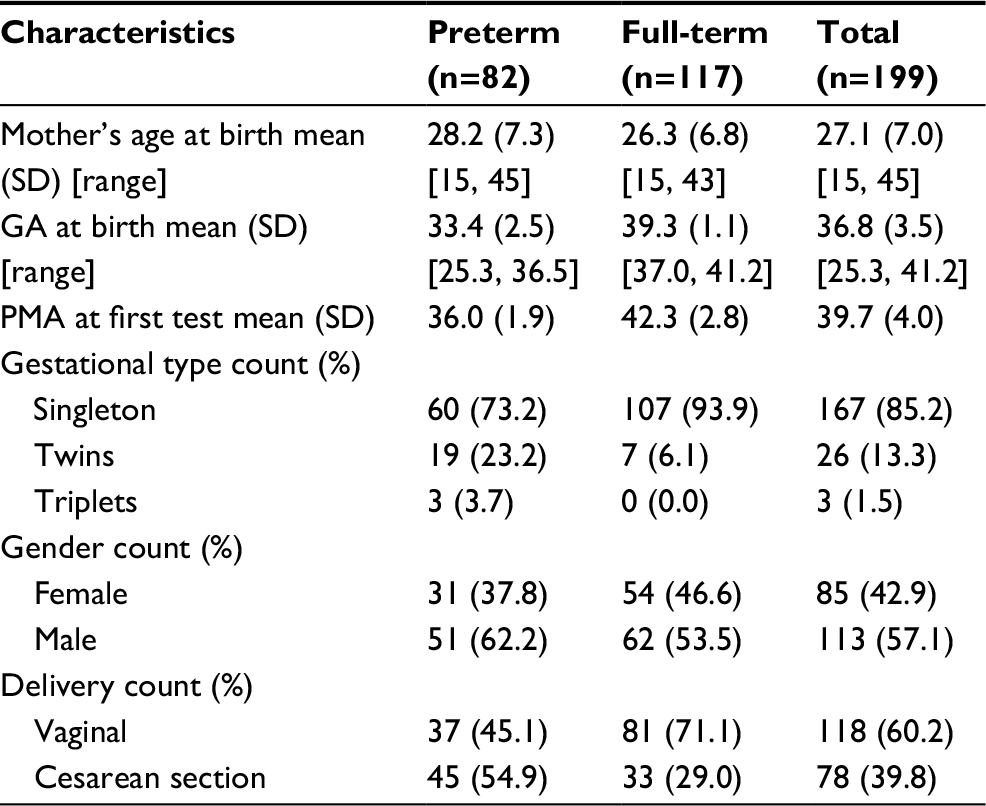 | Table 3 Participant characteristics at baselinea Note: aSome counts within characteristics may not total the overall analytic sample size by group due to missing values. Abbreviations: GA, gestational age; PMA, postmenstrual age. |
Forty-six preterm and 56 full-term infants had more than one feeding session as shown in Table 4. Infants provided multiple tests over variable time intervals, spanning a range of 22 and 17 weeks for preterm and full-term infants, respectively. PMA at initial test ranged from 33.1 to 56.0 weeks for preterm infants and 37.6 to 62.0 weeks for full-term infants. A Poisson test for trend in the test counts was performed on the number of feedings contributed by preterm vs full-term infants, accounting for the length of observation in weeks. No large differences by group were observed (P=0.19).
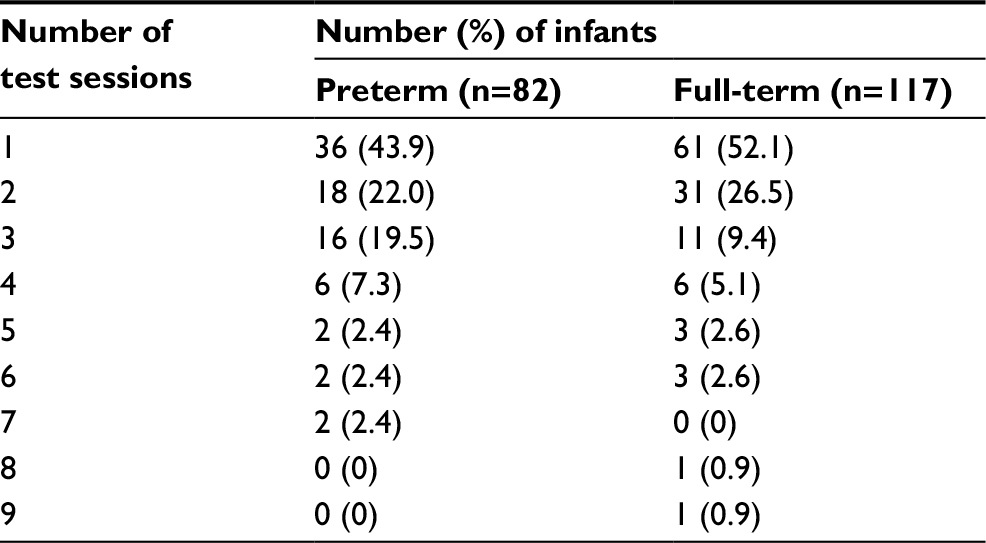 | Table 4 Distribution of test session counts Notes: Forty-six preterm and 56 full-term infants had more than one test. These numbers diminished as the number of additional tests increased. |
Predictions obtained from the linear models were plotted alongside observed values for each test, and features were compared across the preterm and full-term groups (Figure 5). For the number of sucks and some of the factors, we observed strong group-wise differences, either in the rate of change with age (sucks, suck vigor, and resting) or as constant group differences that did not diminish appreciably with age (endurance). Other factors showed more modest differences (frequency and variability) or in some cases no apparent differences at all (irregularity and bursting). Based on these data, preterm infants take fewer sucks over the same time frame (about 15% fewer per test on average between 37 and 40 weeks PMA, P=0.06) and have generally weaker suck vigor, indulge in more resting, and exhibit less endurance.
For responses that showed significant differences in percent changes over time (Table 5), we observed that preterm infants tended to catch up to full-term infants in terms of feeding skills as they more closely approached a PMA of 40 weeks (Figure 6). Table 5 presents the percent changes in mean suck counts and factor scores for preterm and full-term infants. In this table, we see that both groups increase average suck counts each week, but the preterm group does so at approximately three times the rate of the full-term group (8.6% vs 3.0%). Suck vigor and resting showed large percent changes for preterm infants compared to flat performance for full-term infants, and the other factors show mostly negligible increases or decreases that are roughly the same magnitude in both groups. However, even at the 40-week mark, when the responses for preterm infants were becoming more similar to those for full-term infants on average, preterm feeding skills had a higher degree of variability in all responses evidenced by confidence intervals that we observed to be two or three times wider for the preterm group (data not shown).
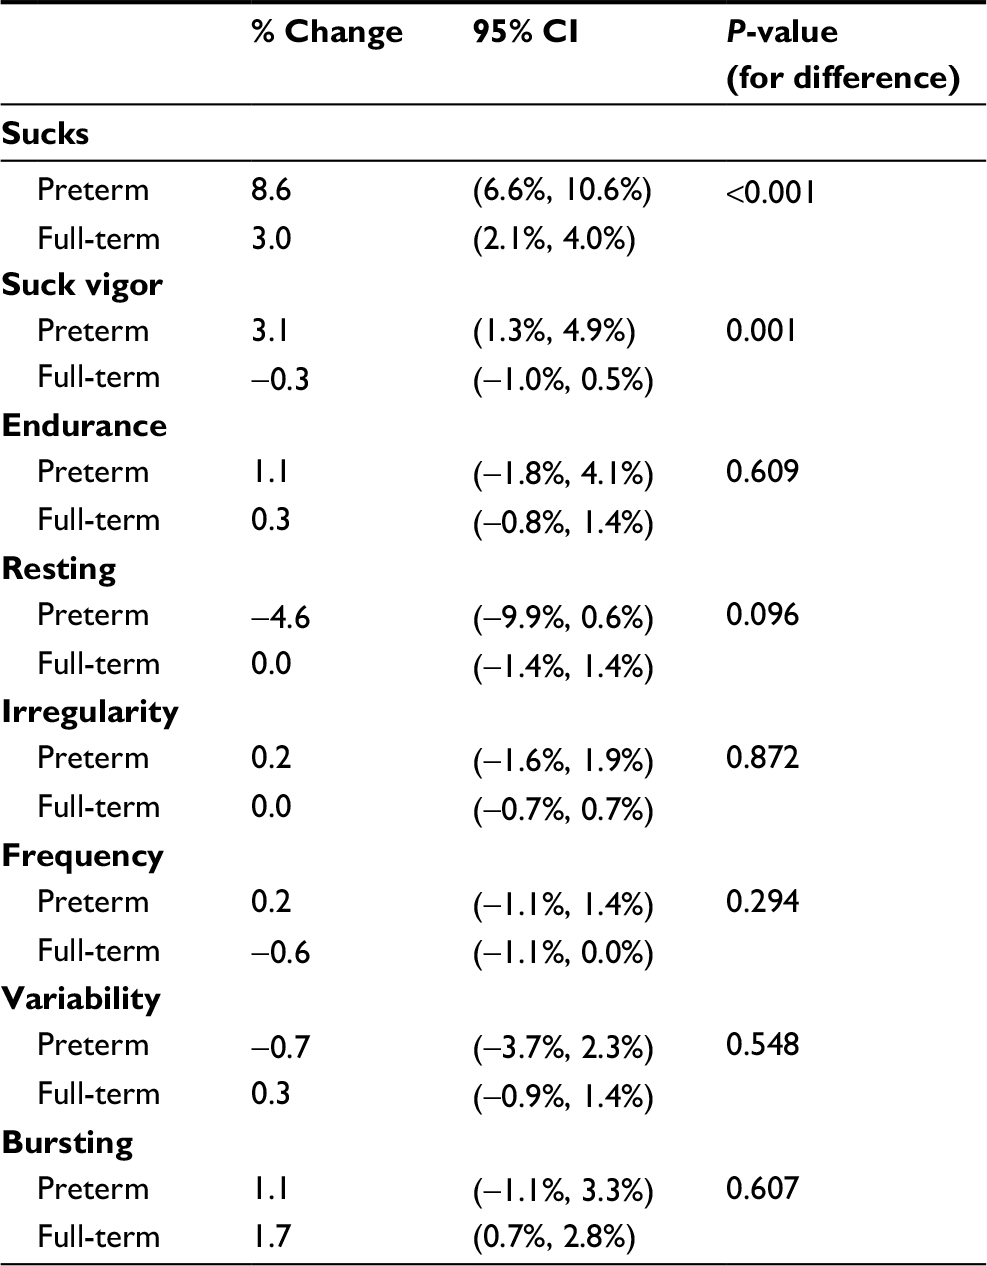 | Table 5 Percent change (per week of PMA) in mean factor scores Abbreviation: PMA, postmenstrual age. |
 | Figure 6 Linear model of age trend. Notes: An example of how the preterm profile “catches up” to the full-term profile. Note that the linear fit for preterm infants is increasingly poor as PMA increases, because the rapid maturation rate seen in the newborn preterm infants slows down as they gradually become more normal in their feeding behavior. Abbreviation: wks, weeks. |
At 40 weeks PMA (the mean age in the data), some differences remained between preterm and full-term infants (Table 6). Most notable were the endurance difference (15% less for preterm infants at week 40), frequency difference (5.3% less in preterm infants), and variability difference (9.7% less in preterm infants), which appear to be more persistent across time, suggesting that the rate of maturation for these factors is slow. In contrast, the suck vigor and resting differences, while nominally large at 40 weeks, diminished within a couple of weeks (Figure 5).
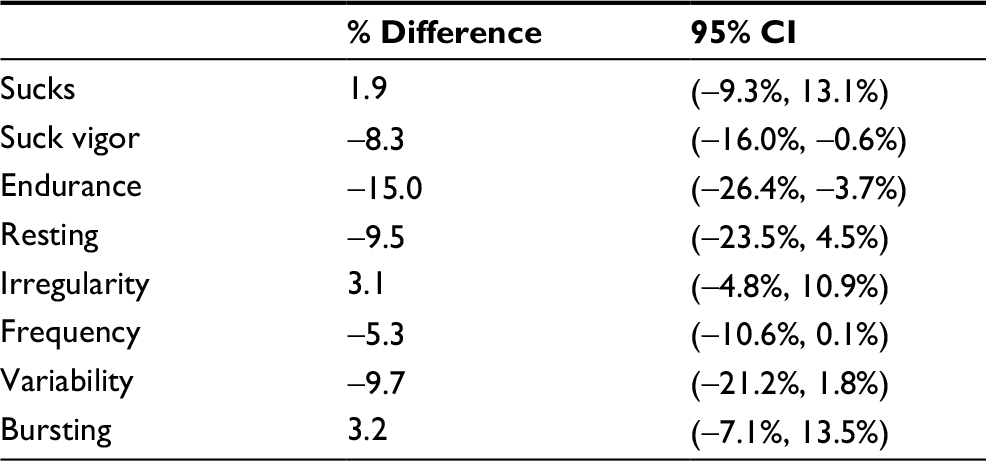 | Table 6 Percent difference (preterm – full-term) in mean factor scores at 40 weeks PMA Abbreviation: PMA, postmenstrual age. |
Discussion
Emerging evidence suggests that quantifying neonatal feeding using a noninvasive device and an automated analytic system is an objective and potentially clinically applicable method.12–14 In this paper, we present data on the sucking skills of 199 preterm and full-term infants derived from the Orometer and an automated suck analysis application. Using sophisticated statistical methods, we provide meaningful summarization of the metrics produced by the Orometer into a small number of potentially clinically relevant factors and show clear evidence of feeding maturation that are associated with gestational age.
Factor analysis was our primary means of accomplishing the goal of summarizing the Orometer output. The seven factors indicated in our data set – suck vigor, endurance, resting, irregularity, frequency, variability, and bursting (Tables 1 and 2) – reflect the feeding skills. As expected, not all of the >40 metrics produced by the Orometer were equally informative in determining the final seven factors. Notably, suck count contributed approximately uniformly and was low for all factors. Consistent with Lau’s22 five stages of feeding maturation, where the most immature feeders have no suction, we found preterm infants had increased average suck counts at each week by approximately three times the rate of term infants. Thus, we considered suck count to be an overall summary statistic for the test rather than a driver of covariance and placed more importance on describing qualitative aspects of sucks (eg, how variable and vigorous they are) and how sucks are distributed through time (eg, as long or short bursts, with long or short pauses between bursts). For example, suck vigor is determined by quantifying the shape of the suck (Table 2; Figure 4); it rose more steeply among premature infants through term PMA than other factors (Figure 5), suggesting that features of the suck shape may serve as an important marker of infant feeding maturation.
Our sample of otherwise healthy preterm infants, ranging from 25.3 to 36.5 gestational weeks at birth, did not differ significantly from healthy infants born at term by most factors analyzed per week or at 40 weeks PMA (Tables 5 and 6). These results are consistent with other reports of sucking behavior among healthy preterm infants at low risk for developmental delays and full-term infants.13,14,23 While mean factor scores are broadly similar among preterm and full-term infants at 40 weeks, preterm infants had more variability in feeding trends with confidence intervals for percent changes that are two or three times wider than those of full-term infants, despite having similar test counts. Variability is an important component of human movement, and differences in movement variability have been studied in relation to abnormal developmental delays.24 Differences in variability of sucking metrics among infants born at earlier and later gestational ages who were tested at similar PMA have also been reported.14,25
A weakness in our design was not grouping infants by developmental outcome risk. Our preterm infants ranged widely in gestational age at birth (~11 weeks), and although we excluded major comorbidities, there is likely some heterogeneity in risk for developmental delay among our samples. The average PMA at initial test session for preterm infants was 36.0 weeks (1.9 SD). The inclusion of more data from younger preterm infants grouped by developmental risk would have enhanced our understanding of their feeding maturation and whether variation of feeding trends was the same for low- and high-risk infants. Additionally, the inclusion of long-term developmental outcomes would corroborate the interpretations of the feeding skills outlined here.
Oral feeding is, of course, far more complex than is presented here; we have not measured every possible component. For example, our device measures intraoral pressure changes during nutritive sucking, but oral feeding involves the coordination of three rhythmic motor skills: sucking, swallowing, and breathing.26 Some investigators have shown that measures of swallowing and respiration reflect an infant’s feeding abilities.9 Mizuno et al27 reported differences in apneic episodes and the number of swallows between infants with and without lung disease, and Gewolb and Vice28 showed that the coordination of swallow and respiration occur later than the coordination of suck among preterm infants. However, insightful additional sensors measuring swallowing movements and respiration are an added burden to neonates already inundated with clinical care equipment. The incorporation of the monitoring that occurs as part of routine care into quantification and data analytic systems is a practical approach for future studies.
Conclusion
We found that feeding skills among healthy preterm and full-term infants can be measured through simple negative pressure changes using a noninvasive method. Using linear modeling, we were able to show that feeding trends were different among healthy preterm and full-term infants suggesting differences in maturation between the groups. Three features of our investigation and the Orometer system include: 1) a relatively simple and well-established mechanical design measuring intraoral negative pressure; 2) an automated suck analysis software with limited user intervention; and 3) incorporation of factor analysis and waveform analysis allowing for a more dynamic, interpretable, and rigorous evaluation of the qualitative features of nutritive sucking (eg, suck vigor). Furthermore, our results substantiate those recently reported by investigators using similar systems.13,14 Follow-up investigations are underway to replicate our findings utilizing similar methods among a larger group of preterm and full-term infants with varying morbidities and followed longitudinally. The long-term goal is to develop feeding maturation trajectories for preterm infants that are useful for clinical determination of normal and abnormal maturation.
Disclosure
N Buist is the President of Metabolic Nutritionals, and with S Buckley jointly hold a patent for the Orometer. The patent has not been assigned to any company. The authors report no other conflicts of interest in this work.
References
Martin JA, Hamilton BE, Osterman MJ, Curtin SC, Matthews TJ. Births: final data for 2013. Natl Vital Stat Rep. 2015;64(1):1–65. | ||
Jadcherla SR, Wang M, Vijayapal AS, Leuthner SR. Impact of prematurity and co-morbidities on feeding milestones in neonates: a retrospective study. J Perinatol. 2010;30(3):201–208. | ||
Ambalavanan N, Carlo WA, Mcdonald SA, et al. Identification of extremely premature infants at high risk of rehospitalization. Pediatrics. 2011;128(5):e1216–e1225. | ||
Wood N, Costeloe K, Gibson AT, et al. The EPICure study: growth and associated problems in children born at 25 weeks of gestational age or less. Arch Dis Child Fetal Neonatal Ed. 2003;88(6):F492–F500. | ||
Wolthuis-Stigter MI, Luinge MR, da Costa SP, Krijnen WP, van der Schans CP, Bos AF. The association between sucking behavior in preterm infants and neurodevelopmental outcomes at 2 years of age. J Pediatr. 2015;166(1):26–30. | ||
Hawdon JM, Beauregard N, Slattery J, Kennedy G. Identification of neonates at risk of developing feeding problems in infancy. Dev Med Child Neurol. 2000;42(4):235–239. | ||
Briere CE, Mcgrath J, Cong X, Cusson R. State of the science: a contemporary review of feeding readiness in the preterm infant. J Perinat Neonatal Nurs. 2014;28(1):51–8. | ||
Mizuno K, Ueda A. Neonatal feeding performance as a predictor of neurodevelopmental outcome at 18 months. Dev Med Child Neurol. 2005;47(5):299–304. | ||
Lau C, Smith EO, Schanler RJ. Coordination of suck-swallow and swallow respiration in preterm infants. Acta Paediatr. 2003;92(6):721–727. | ||
Medoff-Cooper B, Shults J, Kaplan J. Sucking behavior of preterm neonates as a predictor of developmental outcomes. J Dev Behav Pediatr. 2009;30(1):16–22. | ||
Lang WC, Buist NR, Geary A, et al. Quantification of intraoral pressures during nutritive sucking: methods with normal infants. Dysphagia. 2011;26(3):277–286. | ||
Tamilia E, Taffoni F, Formica D, et al. Technological solutions and main indices for the assessment of newborns’ nutritive sucking: a review. Sensors (Basel). 2014;14(1):634–658. | ||
Tamilia E, Formica D, Scaini A, Taffoni F. An automated system for the analysis of newborns’ oral-motor behavior. IEEE Trans Neural Syst Rehabil Eng. 2016;24(12):1294–1303. | ||
Capilouto GJ, Cunningham TJ, Mullineaux DR, Tamilia E, Papadelis C, Giannone PJ. Quantifying neonatal sucking performance: promise of new methods. Semin Speech Lang. 2017;38(2):147–158. | ||
Ludwig SM, Waitzman KA. Changing feeding documentation to reflect infant-driven feeding practice. Newborn Infant Nurs Rev. 2007;7(3):155–160. | ||
Gnanadesikan R, Kettenring JR. Robust estimates, residuals, and outlier detection with multiresponse data. Biometrics. 1972;28(1):81–124. | ||
Atkinson AC. Plots, Transformations, and Regression: An Introduction to Graphical Methods of Diagnostic Regression Analysis. Oxford: Clarendon Press; 1985. | ||
Harman HH. Modern Factor Analysis. Chicago: University of Chicago Press; 1976. | ||
Hendrickson AE, White PO. PROMAX: a quick method for rotation to oblique simple structure. Br J Stat Psychol. 1964;17(1):65–70. | ||
Cronbach LJ. Coefficient alpha and the internal structure of tests. Psychometrika. 1951;16(3):297–334. | ||
Mclean RA, Sanders WL, Stroup WW. A unified approach to mixed linear models. Am Stat. 1991;45(1):54–64. | ||
Lau C. Development of infant oral feeding skills: what do we know? Am J Clin Nutr. 2016;103(2):616S–621S. | ||
Medoff-Cooper B, Bilker WB, Kaplan JM. Suckling behavior as a function of gestational age: a cross-sectional study. Infant Behav Dev. 2001;24(1):83–94. | ||
Groen SE, de Blécourt AC, Postema K, Hadders-Algra M. General movements in early infancy predict neuromotor development at 9 to 12 years of age. Dev Med Child Neurol. 2005;47(11):731–738. | ||
Amaizu N, Shulman R, Schanler R, Lau C. Maturation of oral feeding skills in preterm infants. Acta Paediatr. 2008;97(1):61–67. | ||
Barlow SM. Oral and respiratory control for preterm feeding. Curr Opin Otolaryngol Head Neck Surg. 2009;17(3):179–186. | ||
Mizuno K, Nishida Y, Taki M, et al. Infants with bronchopulmonary dysplasia suckle with weak pressures to maintain breathing during feeding. Pediatrics. 2007;120(4):e1035–e1042. | ||
Gewolb IH, Vice FL. Maturational changes in the rhythms, patterning, and coordination of respiration and swallow during feeding in preterm and term infants. Dev Med Child Neurol. 2006;48(7):589–594. |
 © 2018 The Author(s). This work is published and licensed by Dove Medical Press Limited. The
full terms of this license are available at https://www.dovepress.com/terms
and incorporate the Creative Commons Attribution
- Non Commercial (unported, 3.0) License.
By accessing the work you hereby accept the Terms. Non-commercial uses of the work are permitted
without any further permission from Dove Medical Press Limited, provided the work is properly
attributed. For permission for commercial use of this work, please see paragraphs 4.2 and 5 of our Terms.
© 2018 The Author(s). This work is published and licensed by Dove Medical Press Limited. The
full terms of this license are available at https://www.dovepress.com/terms
and incorporate the Creative Commons Attribution
- Non Commercial (unported, 3.0) License.
By accessing the work you hereby accept the Terms. Non-commercial uses of the work are permitted
without any further permission from Dove Medical Press Limited, provided the work is properly
attributed. For permission for commercial use of this work, please see paragraphs 4.2 and 5 of our Terms.