Back to Journals » OncoTargets and Therapy » Volume 11
Quantification of heart, pericardium, and left ventricular myocardium movements during the cardiac cycle for thoracic tumor radiotherapy
Authors Tong Y, Yin Y, Lu J, Liu T, Chen J, Cheng P, Gong G
Received 31 October 2017
Accepted for publication 20 December 2017
Published 24 January 2018 Volume 2018:11 Pages 547—554
DOI https://doi.org/10.2147/OTT.S155680
Checked for plagiarism Yes
Review by Single anonymous peer review
Peer reviewer comments 3
Editor who approved publication: Dr Carlos E Vigil
Ying Tong,1,2 Yong Yin,1 Jie Lu,1 Tonghai Liu,1 Jinhu Chen,1 Pinjing Cheng,2 Guanzhong Gong1
1Department of Radiation Physics, Shandong Cancer Hospital Affiliated to Shandong University, Jinan, 2School of Nuclear Science and Technology, University of South China, Hengyang, People’s Republic of China
Purpose: The purpose of this study was to quantify variations in the heart, pericardium, and left ventricular myocardium (LVM) caused by cardiac movement using the breath-hold technique.
Patients and methods: In this study, the electrocardiography-gated four-dimensional computed tomography (CT) images of 22 patients were analyzed, which were sorted into 20 phases (0–95%) according to the cardiac cycle. The heart, pericardium, and LVM were contoured on each phase of the CT images. The positions, volume, dice similarity coefficient (DSC) in reference to 0% phase, and morphological parameters (max 3D diameter, roundness, spherical disproportion, sphericity, and surface area) in different phases of the heart, pericardium, and LVM were analyzed, which were presented as mean ± standard deviation.
Results: The mean values of displacements along the X, Y, and Z axes respectively were as follows: 1.2 mm, 0.6 mm, and 0.6 mm for the heart; 0.5 mm, 0.4 mm, and 0.8 mm for the pericardium; and 1.0 mm, 4.1 mm, and 1.9 mm for the LVM. The maximum variations in volume and DSC respectively were 16.49%±3.85% and 10.08%±2.14% for the heart, 12.62%±3.94% and 5.20%±1.54% for the pericardium, and 24.23%±11.35% and 184.33%±128.61% for the LVM. The differences in the morphological parameters between the maximum and minimum DSC phases for the heart and pericardium were not significantly different (p>0.05) but were significantly different for the LVM (p<0.05).
Conclusion: The volumetric and morphological variations of the heart were similar to those of pericardium, and all were significantly smaller than those of the LVM. This inconsistency in the volumetric and morphological variations between the LVM and the heart and pericardium indicates that special protection of the LVM should be considered.
Keywords: thoracic radiotherapy, cardiac activity, cardiac structures, variations, volume, morphology
Introduction
Radiotherapy has played an important role in the treatment of carcinomas, such as lymphoma, breast cancer, and esophageal cancer, and can effectively improve patient survival time and quality of life.1,2 However, the long-term complications of radiotherapy have attracted increased attention and can partially offset the superior effects of radiotherapy.3 Radiation exposure of the heart has been associated with many complications in thoracic radiotherapy, and a previous study showed a 7.4% excess relative risk per Gy for major coronary events over five decades.4 These complications include pericardial effusion, pericarditis, conduction artery disease, myocardial defect, valvular disease, and conduction abnormalities.4–6
RIHD affects patient prognosis; therefore, the accurate prediction of RIHD is important. Dose–volume parameters and blood biochemical parameters are currently used as major factors for predicting RIHD, and dose–volume parameters are the most widely used predictors in clinical practice. In a review, Gagliardi et al reported that while one study found Dmediastinum>30 Gy to be a suitable predictor of RIHD, another study demonstrated that cardiac mortality due to ischemia could be predicted by D35>38 Gy of the heart.7 Different standards have been adopted by various investigators, and cardiac movements might be a main reason for the errors of dose–volume parameters during RIHD prediction.
Dose–volume parameters for predicting RIHD are currently calculated based on traditional, static, 3DCT; however, the heart continually moves, and the resulting positional, volumetric, and morphological variations may lead to differences in dose–volume parameters during RIHD prediction.8,9 Therefore, it is necessary to analyze the variation regulations of the heart and its accessory structures in radiotherapy.
Cardiac movements include respiratory movements and cardiac activity. Some studies have shown that organ motion and cardiac dose can be reduced using the breath-hold technique, and the effect of respiratory movements on cardiac dose can also be effectively reduced.10–12 Due to technological limitations, only few studies have previously analyzed the impact of cardiac activity on heart and substructures or quantified movements of the heart and substructures during the cardiac cycle. With advances in technology, ECG-gated technology combined with 4DCT can now achieve the real-time monitoring of heart movements during the cardiac cycle.13–15 In this study, we used ECG-gated 4DCT based on breath holding to reduce the effect of respiratory movements and enable the acquisition of complete images of the heart and its substructures during the cardiac cycle. This technique was beneficial for analyzing the influence of cardiac activity on the heart and its associated substructures.
In this study, the positional, volumetric, and morphological variations of the heart, pericardium, and LVM were quantified based on ECG-gated 4DCT.
Patients and methods
Patient selection
Twenty-two patients who underwent ECG-gated 4DCT based on breath hold between March 2015 and November 2016 were analyzed retrospectively. Among the 22 patients, 12 were male, and 10 were female; the patients were aged between 35 years and 67 years with a median age of 58 years (Table 1). Esophageal tumors were evaluated in this study. This study was approved by the Research Ethics Board of the Shandong Cancer Hospital, and written informed consent was obtained from all patients.
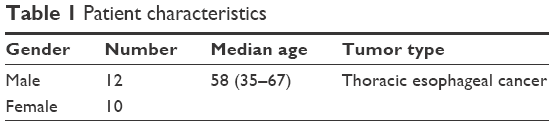 | Table 1 Patient characteristics |
4DCT acquisitions
All 22 patients underwent 4DCT scans, and all 4DCT images were acquired using a Siemens dual-source CT scanner (Siemens SOMATOM Definition; Munich, Germany). The scans covered the area from the thoracic inlet to the bottom of the heart. CT images were reconstructed for each 5% of the cardiac cycle, resulting in 20 cardiac cycle images (0%, 5%, 10%, etc., through 95%). Images were reconstructed with a slice thickness of 0.75 mm and an increment of 0.5 mm. All images were imported into MIM Maestro 6.6.9 (MIM Software Inc., Cleveland, OH, USA) workstation to delineate and analyze the heart, pericardium, and LVM.
Delineation protocols of the heart, pericardium, and LVM
The heart upper boundary was the top of the left atrium, and the lower boundary was the apex cordis. The pericardium upper boundary was consistent with the heart upper boundary, and the lower boundary was defined as a loss of visual confirmation of the pericardium structure. The LVM ranged from the top of the left ventricle to the apex cordis, and the interventricular septum was not included. The window width/level was 400/40 (Figure 1). All structures were contoured by the same radiation oncologist and were then reviewed by a second one.
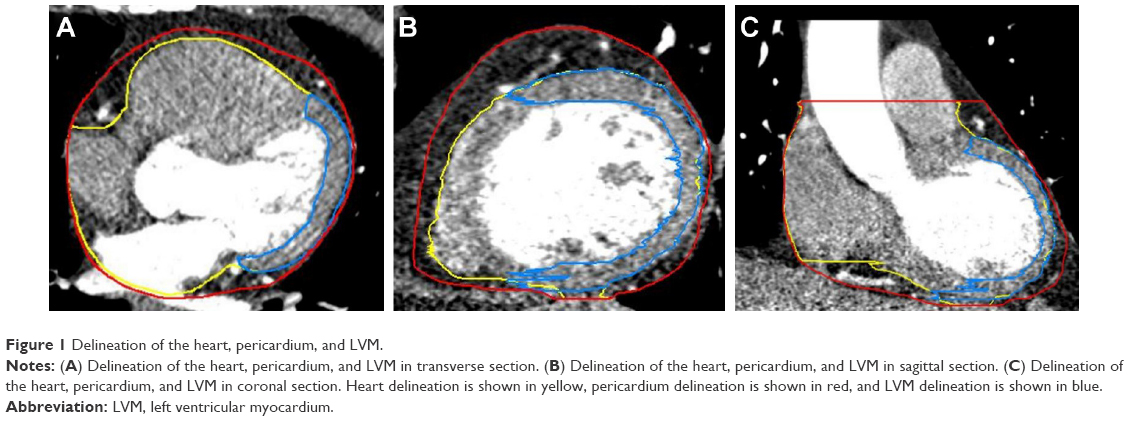 | Figure 1 Delineation of the heart, pericardium, and LVM. |
Data analysis
The displacements of the heart, pericardium, and LVM were calculated in reference to 0% phase CT images for the X, Y, and Z axes, which represented the left and right, ventral and dorsal, and caudal and cranial directions, respectively. The volumes of the heart, pericardium, and LVM in the different phases were calculated. The DSC of the heart, pericardium, and LVM in different phases in reference to the 0% phase was calculated using the formula DSC =2|A∩B|/(|A| + |B|), where A represents the volume in the 0% phase and B represents the volume in the other phase (5%–95%); |A∩B| represents the volume of the intersection between A and B, which was obtained using the “Boolean operation” in MIM Maestro 6.6.9. The variation in the volume/DSC/morphological parameter was defined as the relative difference between the maximum volume/DSC/morphological parameter value and the minimum volume/DSC/morphological parameter value, which were presented as percentage. The maximum and minimum DSC phases were defined as the extreme phases with the largest morphological variations. Morphological parameters, such as the max 3D diameter, roundness, spherical disproportion, sphericity, and surface area, which were used to evaluate the morphological variations of the cardiac structures, were analyzed in the maximum and minimum DSC phases for the heart, pericardium, and LVM based on a recognized software, IBEX software, which was developed by the University of Texas MD Anderson Cancer Center. The morphological parameters are defined as follows: 1) Max 3D diameter: This measures the largest pairwise Euclidean distance  between voxels on the surface of the organ volume. 2) Roundness: This parameter measures how much the binary mask is close to circle in two dimensions and quantifies how much the shape of an image object is similar to an ellipse/ellipsoid. To calculate roundness, we must first compute roundness value in two dimensions slice by slice, where roundness =1−regionprops (2DMask, “Eccentricity”), and then compute the mean of roundness value among the slices. 3) Spherical disproportion: This parameter is used to describe the degree of dissimilarity of organs and spheres. 4) Sphericity: This parameter is used to quantify how spherical an organ object is and is useful in describing overall organ geometry. 5) Surface area: This measures the surface area of an organ. All data are reported as the means ± standard deviations. The static contour of the pericardium in the maximum and minimum volume phases was compared to the dynamic heart to analyze whether it could ensure the safety of the heart by contouring the pericardium as an OAR during radiotherapy.
Statistical analysis
All data were analyzed using SPSS v19.0 software (SPSS Inc., Chicago, IL, USA). Nonparametric testing was preferred across all analyses. Moreover, as the comparison was implemented across one patient’s maximum and minimum recorded values, the related sample test was used; the Wilcoxon signed-rank test was used to compare two groups in this study. Differences were considered significant at p<0.05.
Results
Positional variations in the heart, pericardium, and LVM
The displacements in the LVM were larger than those in the heart and pericardium, and the largest displacement in the LVM occurred along the Y axis. The largest displacements were 1.2±0.9 mm, 0.8±0.6 mm, and 4.1±2.8 mm for the heart, pericardium, and LVM, respectively (Table 2).
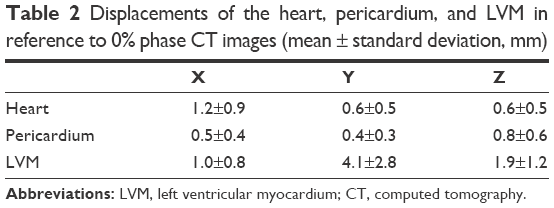 | Table 2 Displacements of the heart, pericardium, and LVM in reference to 0% phase CT images (mean ± standard deviation, mm) |
Volumetric and DSC variations in the heart, pericardium, and LVM
As shown in Table 3 and Figure 2, the differences between the maximum volume and minimum volume were significant during the cardiac cycle for the heart, pericardium, and LVM (p<0.001). The maximum and minimum DSCs for the heart, pericardium, and LVM were also significantly different (p<0.001). However, the volumetric and DSC variations of the LVM were larger than those of the heart and pericardium, and the mean values of the variations in the volume and DSC for the LVM were 1.47-fold and 18.29-fold greater than those of the heart and 1.92-fold and 35.45-fold greater than those of the pericardium, respectively.
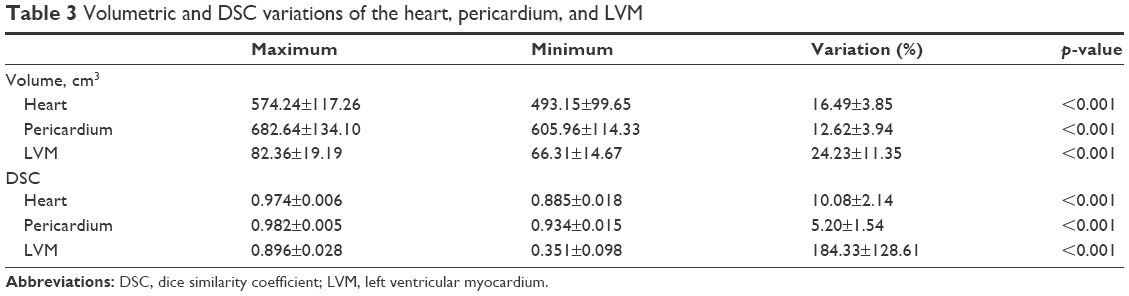 | Table 3 Volumetric and DSC variations of the heart, pericardium, and LVM |
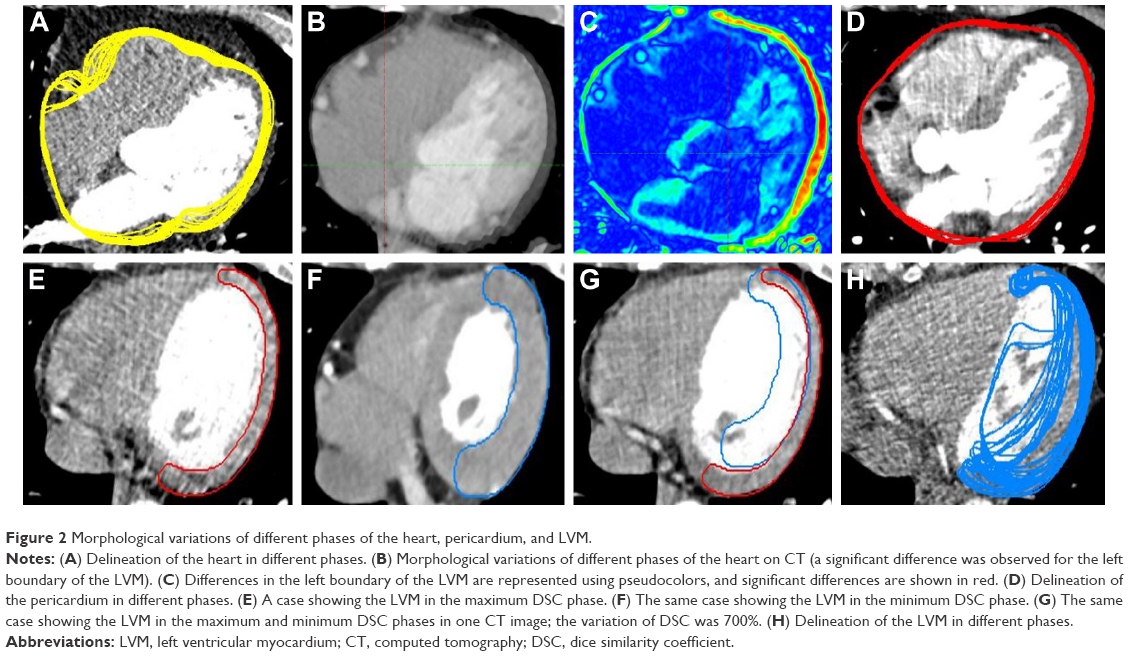 | Figure 2 Morphological variations of different phases of the heart, pericardium, and LVM. |
Figure 3 shows that the volumetric variations of the LVM were inconsistent with those of the heart and pericardium. The volumes of the heart and pericardium decreased at first and later increased, whereas the volume of the LVM increased at first and later decreased.
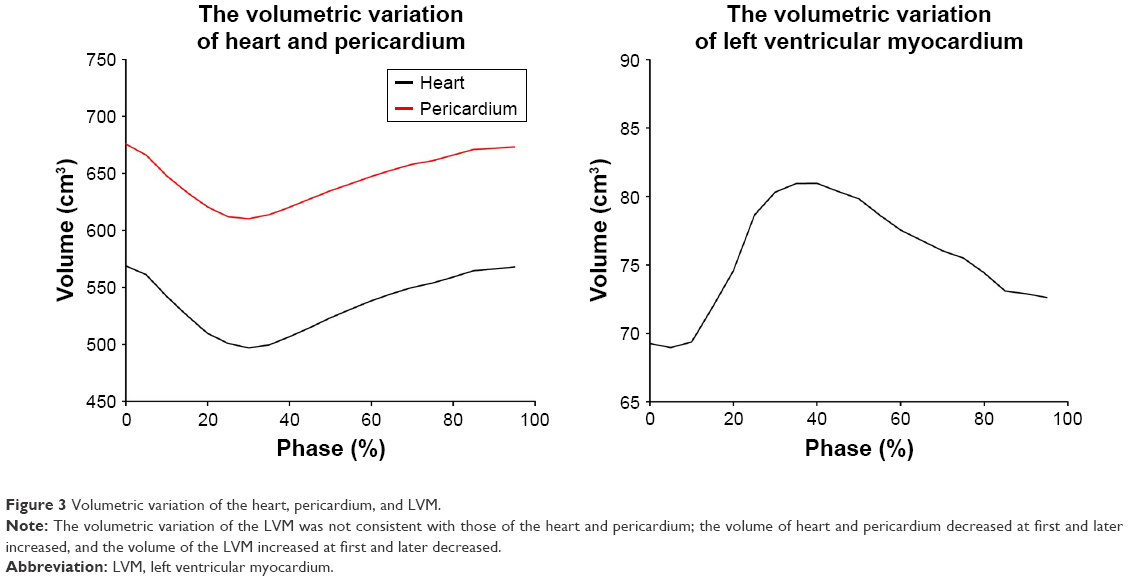 | Figure 3 Volumetric variation of the heart, pericardium, and LVM. |
Morphological parameter variations of the heart, pericardium, and LVM
The mean values of the variations in the morphological parameters were in the ranges of 4.28%–17.41%, 3.50%–9.28%, and 15.36%–48.76% for the heart, pericardium, and LVM, respectively. For the heart and pericardium, not all morphological parameters were significantly different between the maximum DSC phase and the minimum DSC phase (p=0.012, p=0.003, p=0.067, p=0.073, and p=0.006, respectively, for max 3D diameter, roundness, spherical disproportion, sphericity, and surface area of the heart, and p=0.033, p=0.073, p=0.654, p=0.681, and p=0.117, respectively, for the pericardium). All morphological parameters were significantly different between the maximum DSC phase and the minimum DSC phase for the LVM (p=0.005, p=0.001, p=0.006, p=0.006, and p=0.010, respectively) (Table 4).
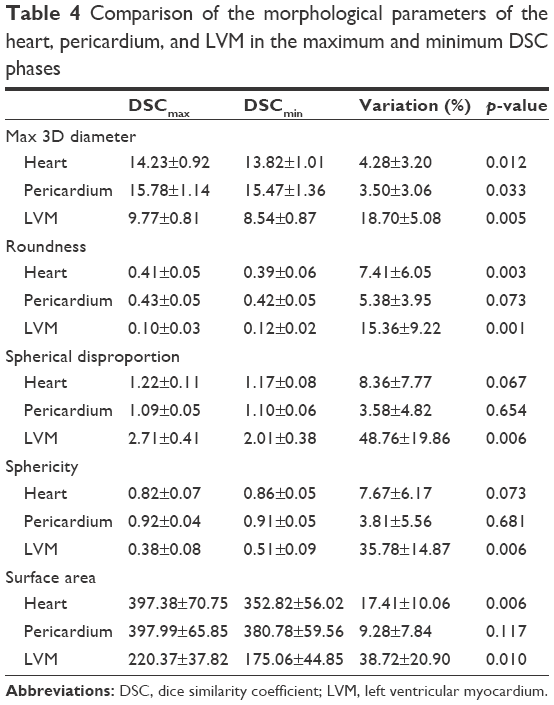 | Table 4 Comparison of the morphological parameters of the heart, pericardium, and LVM in the maximum and minimum DSC phases |
Comparison of the static contour of the pericardium to the dynamic heart
Most of the phases of the heart were included in the maximum pericardium volume. The volume of the dynamic heart beyond the static contour of the maximum pericardium volume was 2.14±1.80 cm3, and the proportion was 0.40%±0.32% (0.01%–1.53%). The volume of the dynamic heart beyond the static contour of the minimum pericardium volume was 22.68±20.55 cm3, and the proportion was 3.94%±3.18% (0.00%–13.77%).
Discussion
In the present study, the variations of the heart, pericardium, and LVM during the cardiac cycle were quantified, and the possible impact of these variations on the dose–volume parameters was analyzed.
ECG-gated 4DCT based on breath hold was used in the present study to acquire complete images of the heart during the cardiac cycle and to simultaneously reduce the effect of respiratory movements. A series of studies from Denmark showed that a reduction of 80%–90% in the cardiac V50% can be achieved by deep inspiration breath holding compared with free breathing, that cardiac mortality can be reduced by 4.7% via breath holding compared with free breathing in left-sided breast treatments, and that the median normal tissue complication probability of cardiac mortality was only 0.1%.16 Mast et al also suggested that the left anterior descending region had an average volume reduction for the 20 Gy of 20% in treatment plans based on breath holding compared with those based on free breathing.17 Therefore, variations of the heart and substructures during the cardiac cycle can be described more accurately using the breath-hold technique because this method has a minimal effect for respiratory movements on the heart.
Kataria et al analyzed the positional variations of the left ventricle and found that the maximum displacement occurred in the ventral–dorsal direction.18 The conclusion of the present study was similar to this observation, and the largest displacement of the LVM was found along the Y axis. This observation also indicated that systole and diastole mainly led to positional variations in the LVM along the Y axis during the ejection and congestion of the left ventricular region. This displacement can cause a significant dose variation and injury in the OAR for patients whose target is close to the LVM. The displacement of the heart and pericardium was smaller than that of the LVM, indicating a smaller effect of the cardiac activity on the whole heart, and the dose variations caused by positional variations would be smaller than those of the LVM.
The volumetric and DSC variations in the cardiac cycle were remarkable for the heart, pericardium, and LVM and could cause some difficulty in calculating dose–volume parameters. The volumetric variations of the heart were consistent with those of the pericardium in different phases, indicating that the movements of the heart and pericardium were synchronous. The variations of volume and DSC for the pericardium were smaller than those of the heart, indicating that the effects of the cardiac activity on volume and morphology were smaller in the pericardium. As stable pericardium volume and morphology would result in stable dose–volume parameters, the methods of evaluating and limiting the cardiac dose by contouring the pericardium as an OAR in clinical practice could reduce the effect of the cardiac activity on dose–volume parameter evaluation and increase its accuracy. However, the volumetric and DSC variations of the LVM were greater than those of the heart and pericardium; the mean value of the variations in DSC for the LVM was 18.29-fold and 35.45-fold greater than those for the heart and pericardium, respectively. In addition, these remarkable variations in the volume and morphology of the LVM contribute most to the difficulty in accurately calculating dose–volume parameters and merit more attention.
To describe the morphological variations of the heart, pericardium, and LVM during the cardiac cycle in more detail, we analyzed the morphological parameters of these areas using IBEX software. These data indicated that the morphological variations of the heart and pericardium were not remarkable. All morphological parameters of the LVM were significantly different, indicating that the morphological variations of the LVM were not consistent with those of the heart and pericardium, which could lead to differences among the dose–volume parameter variations of the LVM, heart, and pericardium.
Folgar-Torres et al considered that the proper contouring of the left ventricular wall was more beneficial to limiting doses and could reduce the occurrence of long-term cardiac events during breast cancer radiotherapy.19 Tan et al also recommended including the left ventricle as an additional OAR in treatment plans.20 Thus, considering left ventricular dose solely in radiotherapy plans has important implications for reducing RIHD, and the viewpoint of the present study is consistent with this observation. In this study, the volumetric variations of the LVM were not consistent with those of the heart and pericardium, and combined with the inconsistency of the morphological variations mentioned above, the LVM movements cannot be replaced by the movements of the heart or pericardium. In addition, the dose–volume parameters applicable to the heart movements were not necessarily suitable for the LVM. Therefore, evaluating dose–volume parameters using the heart or pericardium as an OAR was not always effective for LVM protection. Limiting the dose–volume parameters of the LVM separately should be considered when designing radiotherapy plans. For example, extending a certain margin for LVM as an OAR to limit the dose–volume parameters could be performed in clinical practice.
The method of evaluating cardiac dose by contouring the pericardium as an OAR has exhibited increased accuracy, as mentioned above, but can the safety of the heart be ensured during the cardiac cycle using this contour method? To examine this question, the volume of the dynamic heart beyond the static contour of the pericardium was calculated. The largest volume of the dynamic heart beyond the pericardium was 13.77%, and this volume was mainly concentrated on top of the heart and in the regions of the left boundary of the left ventricle. Thus, methods of evaluating cardiac dose by contouring the pericardium as an OAR based on static 3DCT may not necessarily ensure the safety of the heart during radiotherapy. The heart and left ventricular region might receive high-dose irradiation due to an inaccurate evaluation. Therefore, dose evaluation while using the pericardium as an OAR based on static 3DCT should be performed carefully when designing radiotherapy plans.
Compared to the simplex positional variation of the previous studies, the volumetric and morphological variations of the heart and substructures following cardiac activity were quantified in this study, and these results could be used to provide a basis for evaluating dose–volume parameters and protecting OARs. This study also had several limitations. First, this study only involved 22 patients, representing a relatively small sample size; a larger sample should be studied in the future to make the results more convincing. Second, the study did not consider variations of more elaborate cardiac substructures, such as the coronary artery, because the variation of the coronary artery is more complex, the technology available was limited, and the manner of description is different from that of the heart; however, we intend to study this in the future. Finally, this study estimated dose–volume parameter variations based on volumetric and morphological variations instead of quantifying them; however, quantifying dose–volume variations following cardiac activity could guide clinical practice in a preferable manner and represents an important future direction of this line of research.
Conclusion
The results indicate that the heart, pericardium, and LVM exhibit continuous movement during the cardiac cycle, and the LVM variation was notable when compared to the variations of the heart and pericardium. The volumetric and morphological variations of the heart were similar to those of the pericardium but were not consistent with those of the LVM. The inconsistency in these variations between the LVM and the heart and pericardium indicates that the protection of the LVM should be considered separately. Moreover, this study found that protecting the heart by contouring the pericardium as an OAR on the static 3DCT images might not necessarily ensure the safety of the heart during radiotherapy.
Abbreviations
3D, three dimensional; 3DCT, three-dimensional computed tomography; 4DCT, four-dimensional computed tomography; CT, computed tomography; DSC, dice similarity coefficient; ECG, electrocardiography; IBEX, Imaging Biomarker Explorer; LVM, left ventricular myocardium; OAR, organ at risk; RIHD, radiation-induced heart disease.
Acknowledgment
This study was supported by the National Natural Science Foundation of China (81301936).
Disclosure
The authors report no conflicts of interest in this work.
References
Lee J, Hua KL, Hsu SM, et al. Development of delineation for the left anterior descending coronary artery region in left breast cancer radiotherapy: an optimized organ at risk. Radiother Oncol. 2017;122(3):423–430. | ||
Duane F, Aznar MC, Bartlett F, et al. A cardiac contouring atlas for radiotherapy. Radiother Oncol. 2017;122(3):416–422. | ||
Evans ES, Prosnitz RG, Yu X, et al. Impact of patient-specific factors, irradiated left ventricular volume, and treatment set-up errors on the development of myocardial perfusion defects after radiation therapy for left-sided breast cancer. Int J Radiat Oncol Biol Phys. 2006;66(4):1125–1134. | ||
Darby SC, Ewertz M, McGale P, et al. Risk of ischemic heart disease in women after radiotherapy for breast cancer. N Engl J Med. 2013;368(11):987–998. | ||
Stewart JR, Fajardo LF, Gillette SM, Constine LS. Radiation injury to the heart. Int J Radiat Oncol Biol Phys. 1995;31(5):1205–1211. | ||
Kole TP, Aghayere O, Kwah J, Yorke ED, Goodman KA. Comparison of heart and coronary artery doses associated with intensity-modulated radiotherapy versus three-dimensional conformal radiotherapy for distal esophageal cancer. Int J Radiat Oncol Biol Phys. 2012;83(5):1580–1586. | ||
Gagliardi G, Constine LS, Moiseenko V, et al. Radiation dose–volume effects in the heart. Int J Radiat Oncol Biol Phys. 2010;76(3 Suppl):S77–S85. | ||
Topolnjak R, Borst GR, Nijkamp J, Sonke JJ. Image-guided radiotherapy for left-sided breast cancer patients: geometrical uncertainty of the heart. Int J Radiat Oncol Biol Phys. 2012;82(4):e647–e655. | ||
Lorenzen EL, Brink C, Taylor CW, Darby SC, Ewertz M. Uncertainties in estimating heart doses from 2D-tangential breast cancer radiotherapy. Radiother Oncol. 2016;119(1):71–76. | ||
Lens E, Gurneychampion OJ, Tekelenburg DR, et al. Abdominal organ motion during inhalation and exhalation breath-holds: pancreatic motion at different lung volumes compared. Radiother Oncol. 2016;121(2):268–275. | ||
Qi XS, Hu A, Wang K, et al. Respiration induced heart motion and indications of gated delivery for left-sided breast irradiation. Int J Radiat Oncol Biol Phys. 2012;82(5):1605–1611. | ||
Errasti M, Manterola A, Lozares S, et al. Active breathing control in left breast irradiation, our experience center. Rep Pract Oncol Radiother. 2013;18(1):S166. | ||
Funabashi N, Komiyama N, Kato H, Umekita H, Asano M, Komuro I. Retrospective ECG-gated left ventriculography using multislice CT following left ventricular bolus injection and evaluation of its utility and motion artifact at every cardiac phase. Int J Cardiol. 2006;113(1):132–138. | ||
Cole AJ, O’Hare JM, McMahon SJ, et al. Investigating the potential impact of four-dimensional computed tomography (4DCT) on toxicity, outcomes and dose escalation for radical lung cancer radiotherapy. Clin Oncol (R Coll Radiol). 2014;26(3):142–150. | ||
Hugo GD, Rosu M. Advances in 4D radiation therapy for managing respiration: part I – 4D imaging. Z Med Phys. 2012;22(4):258–271. | ||
Korreman SS, Pedersen AN, Aarup LR, Nøttrup TJ, Specht L, Nyström H. Reduction of cardiac and pulmonary complication probabilities after breathing adapted radiotherapy for breast cancer. Int J Radiat Oncol Biol Phys. 2006;65(5):1375–1380. | ||
Mast ME, van Kempen-Harteveld L, Heijenbrok MW, et al. Left-sided breast cancer radiotherapy with and without breath-hold: does IMRT reduce the cardiac dose even further? Radiother Oncol. 2013;108(2):248–253. | ||
Kataria T, Bisht SS, Gupta D, et al. Quantification of coronary artery motion and internal risk volume from ECG gated radiotherapy planning scans. Radiother Oncol. 2016;121(1):59–63. | ||
Folgar-Torres A, Alvarado-Astudillo A, Feltes N, et al. Anterior left ventricular territory: true oar in left breast radiotherapy. Rep Pract Oncol Radiother. 2013;18 (Suppl 1):S166–S167. | ||
Tan W, Wang X, Qiu D, et al. Dosimetric comparison of intensity-modulated radiotherapy plans, with or without anterior myocardial territory and left ventricle as organs at risk, in early-stage left-sided breast cancer patients. Int J Radiat Oncol Biol Phys. 2011;81(5):1544–1551. |
 © 2018 The Author(s). This work is published and licensed by Dove Medical Press Limited. The
full terms of this license are available at https://www.dovepress.com/terms
and incorporate the Creative Commons Attribution
- Non Commercial (unported, 3.0) License.
By accessing the work you hereby accept the Terms. Non-commercial uses of the work are permitted
without any further permission from Dove Medical Press Limited, provided the work is properly
attributed. For permission for commercial use of this work, please see paragraphs 4.2 and 5 of our Terms.
© 2018 The Author(s). This work is published and licensed by Dove Medical Press Limited. The
full terms of this license are available at https://www.dovepress.com/terms
and incorporate the Creative Commons Attribution
- Non Commercial (unported, 3.0) License.
By accessing the work you hereby accept the Terms. Non-commercial uses of the work are permitted
without any further permission from Dove Medical Press Limited, provided the work is properly
attributed. For permission for commercial use of this work, please see paragraphs 4.2 and 5 of our Terms.