Back to Journals » International Journal of General Medicine » Volume 13
Pulmonary Function Tests and Their Associated Factors Among Type 2 Diabetic Patients at Jimma Medical Center, in 2019; Comparative Cross-Sectional Study
Authors Tesema DG, Gobena T, Ayalew A
Received 13 February 2020
Accepted for publication 18 March 2020
Published 8 April 2020 Volume 2020:13 Pages 111—119
DOI https://doi.org/10.2147/IJGM.S249683
Checked for plagiarism Yes
Review by Single anonymous peer review
Peer reviewer comments 2
Editor who approved publication: Dr Scott Fraser
Dereje Gemeda Tesema,1 Teshome Gobena,2 Almaz Ayalew2
1Mettu University, Faculty of Medical Sciences, Department of Biomedical Sciences, Mettu, Ethiopia; 2Jimma University, Institute of Health, Faculty of Medical Sciences, Department of Biomedical Sciences, Jimma, Ethiopia
Correspondence: Almaz Ayalew
Jimma University, Institute of Health, Faculty of Medical Sciences, Department of Biomedical Sciences, Jimma, Ethiopia
Tel +251 17239525
Email [email protected]
Background: The presence of widespread lung microvascular circulation and abundant connective tissue with a large reserve raises the possibility that the lung may be a target organ of the pathologic processes induced by type 2 diabetes. Pulmonary function tests (PFTs) are noninvasive medical tests that show how well the lungs are working.
Objective: The aim was to compare pulmonary function tests (PFTs) and their associated factors among type 2 diabetic patients and non-diabetics at Jimma Medical Center (JMC).
Methods: A comparative cross-sectional study was conducted at JMC, Jimma, Southwest Ethiopia among 298 study participants from April 1 to May 30, 2019. A face-to-face interview with semi-structured questionnaire was conducted. Forced vital capacity (FVC), forced expiratory volume in one second (FEV1), ratio of FEV1/FVC, peak expiratory flow (PEF), and forced expiratory flow (FEF25− 75) were recorded by using a digital Spirometer. Independent samples t-test, simple and multiple linear regression analysis were used.
Results: The present study indicated that means of the PFTs among type 2 diabetics were significantly reduced when compared to their matched non-diabetics (FVC (%) (m=73.7± 13.8 vs m=93.8± 12.3), FEV1 (%) (m=76.4± 13.4 vs m=93.3± 12.4), FEV1/FVC (%) (m=78.99± 11.4 vs m=96.6± 9.33), PEF (L/s) (m=3.91± 0.28 vs m=5.03± 0.35), and FEF25– 75 (L/s) (m=2.89± 0.75 vs m=3.39± 0.82)). This study also indicated that body mass index (BMI) (β=− 1.93, P< 0.001) and fasting blood sugar (FBS) (β=− 0.22, P< 0.001) were negative predictors of FVC%. BMI (β=− 1.93, P< 0.001) and FBS (β=− 0.29, P< 0.001) were negative predictors of FEV1%. BMI (β=− 1.403, P< 0.001) was a negative predictor of mean FEV1/FVC. BMI (β=− 1.39 P< 0.001) and FBS (β=− 0.15, P< 0.001) were negative predictors of mean PEF (L/s). BMI (β=− 0.075, P< 0.001) and FBS (β=− 0.075, P< 0.001) were negative predictors of FEF25– 75 (L/s).
Conclusion: The present study showed that there were significantly reduced mean scores of FVC, FEV1, FEV1/FVC, PEF, and FEF25– 75 among type 2 diabetic patients as compared to non-diabetic participants. The FBS and BMI were independent risk factors of the PFTs among the diabetics, unlike among non-diabetic participants.
Keywords: type 2 DM, PFTs, associated factors, Jimma Medical Center
Background
Diabetes mellitus (DM) is a systemic metabolic disorder characterized by the presence of chronic hyperglycemia accompanied by changes in the metabolism of lipids, carbohydrates, and proteins.1 Diabetes is a global health problem which causes multiorgan damage.2 Globally, the International Diabetes Federation (IDF) reported that prevalence of diabetes in adults aged 20–79 years was estimated to be 8.8% in 2017. Globally, IDF also reported that 5 million deaths and USD 727 billion healthcare expenditure were attributable to diabetes among people aged 20–99 years in 2017.
About three quarters (79%) of those with diabetics were living in low and middle income countries in 2017.3 In the African region, IDF also reported that 321,100 deaths and USD 3.4 billion healthcare expenditure were due to diabetes in 2015. The Ethiopian Diabetes Association estimated prevalence of diabetes was 2–3% in 2013.4 The presence of widespread lung microvascular circulation and abundant connective tissue with a large reserve raises the possibility that the lung may be a target organ of the pathologic processes induced by type 2 diabetes.5 This means that a extensive huge loss in the microvascular bed can be tolerated without developing any significant pulmonary symptoms in type 2 diabetics. This leads to disturbed pulmonary function continuing for a long time and being discovered only at a late stage in the diabetics.6,7
The currently known underlying mechanisms for lung dysfunction in patients with type 2 diabetes include microangiopathy of alveolar capillaries and pulmonary arterioles, glycosylation of tissue proteins, oxidative stress, and autonomic neuropathy involving the respiratory muscles.8,11
Impaired lung functions in type 2 diabetes have not been receiving sufficient attention from the healthcare community in our country. This may be due to the lack of routine screening of PFTs among diabetics, type 2 diabetics are subclinical at early stage, lack of national spirometric guidelines and policy on spirometry, lack of previous regional or national level studies conducted on this area and inadequate trained personnel in spirometry at the diabetic clinic. As a result, pulmonary complications among diabetics may be under-recognized clinically.12,13
Pulmonary function tests (PFTs) are noninvasive physiologic tests that show how well the lungs are working. Pulmonary functions are generally determined by the strength of respiratory muscles, compliance of the thoracic cavity, airway resistance, and elastic recoil of the lungs. Pulmonary function parameters are unique as there is no single “normal” value or range. These parameters vary by sociodemographic factors and changing anthropometric characteristics.14,15
Spirometry is important in the screening, diagnosis and monitoring of respiratory diseases.16 Forced vital capacity (FVC) indicates how much air the lungs can hold. Forced expiratory volume in one second (FEV1) indicates how well the large- and medium-sized airways are functioning. The ratio of FEV1/FVC is a more sensitive indicator of airway obstruction than FVC or FEV1 alone. Peak expiratory flow (PEF) refers to mechanical properties of the lung, like lung compliance and elastic recoil of lungs and reflecting larger airway function. Forced expiratory flow (FEF25–75) is known as maximum mid expiratory flow and a measure of patency of small airways.14,17
A 10% decrease in FEV1 was associated with a 12% increase in all-cause mortality among patients with type 2 DM.18 Pulmonary function tests among type 2 diabetic patients have varied in previous studies, with frequently contradicting results; some studies indicating a reduction of spirometric parameters, whereas others have demonstrated no change compared with non-diabetics.19,20
Unlike the previous studies conducted on this area, the current study included physical activity, since regular exercise improves respiratory muscle strength, increases thoracic mobility and, hence, may have a positive effect on the PFTs.21 So, the purpose of this study was to compare PFTs and their associated factors among type 2 diabetic patients at Jimma Medical Center (JMC).
Materials and Methods
Study Area and Period
This study was conducted at JMC, which is located in Jimma town, 356 km Southwest from the capital city of Ethiopia, Addis Ababa.
JMC serves over 500 outpatient visits daily and has 523 inpatient beds, with a catchment population of over 15 million.
This study was conducted from April 1–May 30, 2019.
Study Design
An institutional-based comparative cross-sectional study design was conducted.
Population
Source Population
Case group: All type 2 diabetic patients attending the diabetic clinic outpatient department (OPD) at JMC.
Control group: Non-diabetic individuals attending as outpatients/inpatients at JMC.
Study Population
Case group: All sampled type 2 diabetic patients who attended the diabetic clinic OPD at JMC during the data collection period.
Control group: All age, sex, height, and weight matched non-diabetic individuals who attended as outpatients/inpatients at JMC during the data collection period.
Eligibility Criteria
Inclusion Criteria
All type 2 diabetic patients aged greater than 30 years, the patients presented at the diabetic clinic OPD between 8:00 AM and 12:00 AM.
All age, sex, height, and weight matched non-diabetic individuals with type 2 diabetics, aged greater than 30 years, attendants of outpatients/inpatients presented in JMC between 8:00 AM and 12:00 AM. These individuals overnight fasted for eight hours.
Exclusion Criteria
All patients with cardiorespiratory diseases, pregnant, history of any abdominal or thoracic surgery in the last 3 months, cigarette smokers, cleaners, wood and cobblestone workers.
Individuals with pre-diabetes, cardiorespiratory diseases, pregnant, history of any abdominal or thoracic surgery of last three months, cigarette smokers, cleaners, wood and cobblestone workers.
Sample Size Determination and Sampling Technique
Sample Size Determination
The sample size was calculated by using a double proportion formula with an assumption of 95% confidence interval and power of 80%. Prevalence of abnormal pulmonary functions among type 2 diabetic patients and non-diabetic participants were 17.6% and 6.3%, respectively, which were taken from research conducted at Ghana, in 2014 (38). Therefore, the total sample size for study participants was 298, with a 10% non-response rate (149 type 2 diabetics and 149 non-diabetic individuals).
Sampling Method and Procedure
A systematic random sampling method was employed to select type 2 diabetic patients. The average number of type 2 diabetic patients attending the diabetic clinic in 1 month was estimated to be 1,685, and the total sample size for type 2 diabetic patients was 149. Then, the sampling interval was determined (k=11). The first eligible study participant was selected randomly. Then every other eligible patient visiting the clinic during the data collection period was interviewed until the desired sample size was achieved.
Those individuals matched with type 2 diabetics in terms of age, sex, height,and weight were conveniently selected from attendants of inpatients or outpatients at JMC until the desired sample sized was achieved.
Data Collection Procedures
Data on socio-demographic characteristics, anthropometric and other factors were collected through a face-to-face interview using a semi-structured questionnaire by qualified data collectors.
Anthropometric Measurements
Weight was measured with participants barefoot and with light clothing using a Digital Scale, and was recorded to the nearest 0.1kg. Height was measured using a Stadiometer, with participants in a standing position and without shoes, with shoulders in normal alignment. Body mass index (in kg/m2) was calculated for each participant as the individual’s weight (in kilograms) divided by the square of his or her height (in meters).
In the measurement of waist and hip circumference, each participant was made to stand with their arms at their sides, feet positioned close together. Waist circumference was measured at the midpoint between the lower margin of the last palpable ribs and the top of the iliac crest. The hip circumference was measured around the widest portion of the buttocks. Waist circumference was measured at the end of a normal expiration. Both WC and HC was measured in centimeters. Waist-to-hip ratio was calculated by dividing WC by hip circumference.
Measurements of FBS
Level of fasting blood glucose was taken from patient’s registration book.
Fasting blood glucose measurements were done by a laboratory technologist to ascertain diabetes. After an overnight fasting (≥8 hours), plasma glucose was determined using the glucose meter Accu-Chek Active system. The Accu-Chek Active system used a capillary blood sample which was set to plasma serum standard. This glucose measurement was carried out immediately after sample collection and the results were recorded in the data sheet. The diagnosis of DM was based on the American Diabetes Association diabetes mellitus classification criteria with fasting blood glucose of ≥126 mg/dL being considered as positive for DM; impaired fasting glucose, FBG: ≥110 mg/dL to <126 mg/dL.
Procedure of the Pulmonary Function Testing
The pulmonary function parameters were measured by a digital spirometer (SP10, CONTEC MEDICAL SYSTEMS CO., LTD, China).
The PFTs were conducted according to American Thoracic Society/European Respiratory Society/guideline in a quiet room in sitting position by qualified personnel.17 The spirometry was done in the morning between 8:00 AM and 12:00 AM daily. The participants ID, age, height, gender, and weight were inputted into the equipment.
In the forced vital capacity maneuver, the participant was made to assume correct posture (head slightly elevated), the mouthpiece was attached to the spirometer and the participant asked to breathe in fully until the lungs feel full. The participant was then asked to hold his/her breath long enough to seal his/her lips tightly around the mouthpiece. He/she was then asked to hold his or her nose tightly and to blast the air out as forcibly and fast as possible until there is no more air left to expel. The participant was verbally encouraged to keep blowing and keep blowing during this phase and watched to make sure a good mouth seal around the mouthpiece. The procedure was repeated for at least three acceptable and repeatable blows for a maximum of eight efforts.17,19
The procedure was abandoned and rescheduled if a participant was unable to produce an acceptable and repeatable spirogram after eight attempts. Mouthpieces of the spirometer were cleaned routinely and disinfected by 75% alcohol before the procedure and calibration was strictly seen.
Study Variables
Dependent Variables
FVC, FEV1, FEV1/FVC, PEF, FEF25–75.
Independent Variables
Sex, age, place of residence, occupational status, educational level, weight, height, BMI, WC, WHR, FBS, physical activity.
Data Processing and Analysis
The collected data were entered into Epi-data version 4.4.1 and cleaned and analyzed using the SPSS version 23 software package.
Independent sample t-test was used to determine whether the difference between the two means of the PFTs were statistically significant or not among type 2 diabetics and non-diabetic participants. The assumptions of independent sample t-test (normality and homoscedasticity based up on results of Shapiro–Wilk and Levene’s tests) were checked.
Variables were entered into the simple linear regression model and those found to be significantly associated with the dependent variables were entered into multiple linear regression with enter method. The assumptions of linear regression (linearity, normality, homoscedasticity, outliers, and multicollinearity) were checked.
A 95% confidence interval was used and a P-value<0.05 was considered as statistically significant. The continuous variables were expressed by computing mean and standard deviation, whereas categorical variables were expressed as frequency and percentage. They were presented in the form of tables.
Data Quality Assurance
The Questionnaire was translated from English to Amharic and Afan Oromo then back to English by another person to ensure consistency of translation. Before starting the data collection, a pre-test was performed at Shanan Gibe Hospital on 5% of the total sample size and modifications from the pre-test were made accordingly.
Training was given to the data collectors and supervisor regarding the purpose of the study, measurement techniques, and ethical issues by the principal investigator. Regular supervisions were carried out to monitor the work. The manufacturer of the machine’s instructions were strictly followed. All collected data were examined for completeness and consistency during data management, storage, and analysis.
Ethical Consideration
This study was conducted in accordance with the declaration of Helsinki and after obtaining ethical approval from Jimma University Ethics Review Board. A letter of request for cooperation was sent to Jimma Medical Center, medical director office, and coordinator of the diabetic clinic OPD.
Informed verbal/written consent was gathered from each participant after a comprehensive explanation of the purpose and procedure of the study and the process was approved by the Jimma University Ethics Review Board. The study participants were informed that they had a full right to refuse or discontinue participation at any point of the study. Any information obtained in each course of the study was kept confidential. Participants identified with hypoglycemia, diabetes, and severe reduction in the PFTs were informed to contact physicians for further investigation and management.
Results
Socio-Demographic Characteristics of the Respondents
Out of the total 298 sample size, 290 (145 type 2 diabetics and 145 non-diabetic individuals) participated in this study, giving a response rate of 97.3%.
The majority of the respondents with type 2 DM, 80 (55.2%), were males, with the same sex distribution for non-diabetic participants. The mean age of type 2 diabetic patients and non-diabetic participants were found to be 52.2±9.75 years and 51.5±9.79 years, respectively.
More than half, 77 (53.1%) and 92 (63.4%), of type 2 diabetic patients and non-diabetic participants were urban residents. As per occupation, the majority of the type 2 diabetic patients and non-diabetic participants were government employees, at 43 (29.7%) and 38 (26.2%). Regarding educational level, the highest level of the respondents with type 2 DM, 47 (32.4%), and non-diabetic participants, 41 (28.28%), were illiterate (Table 1).
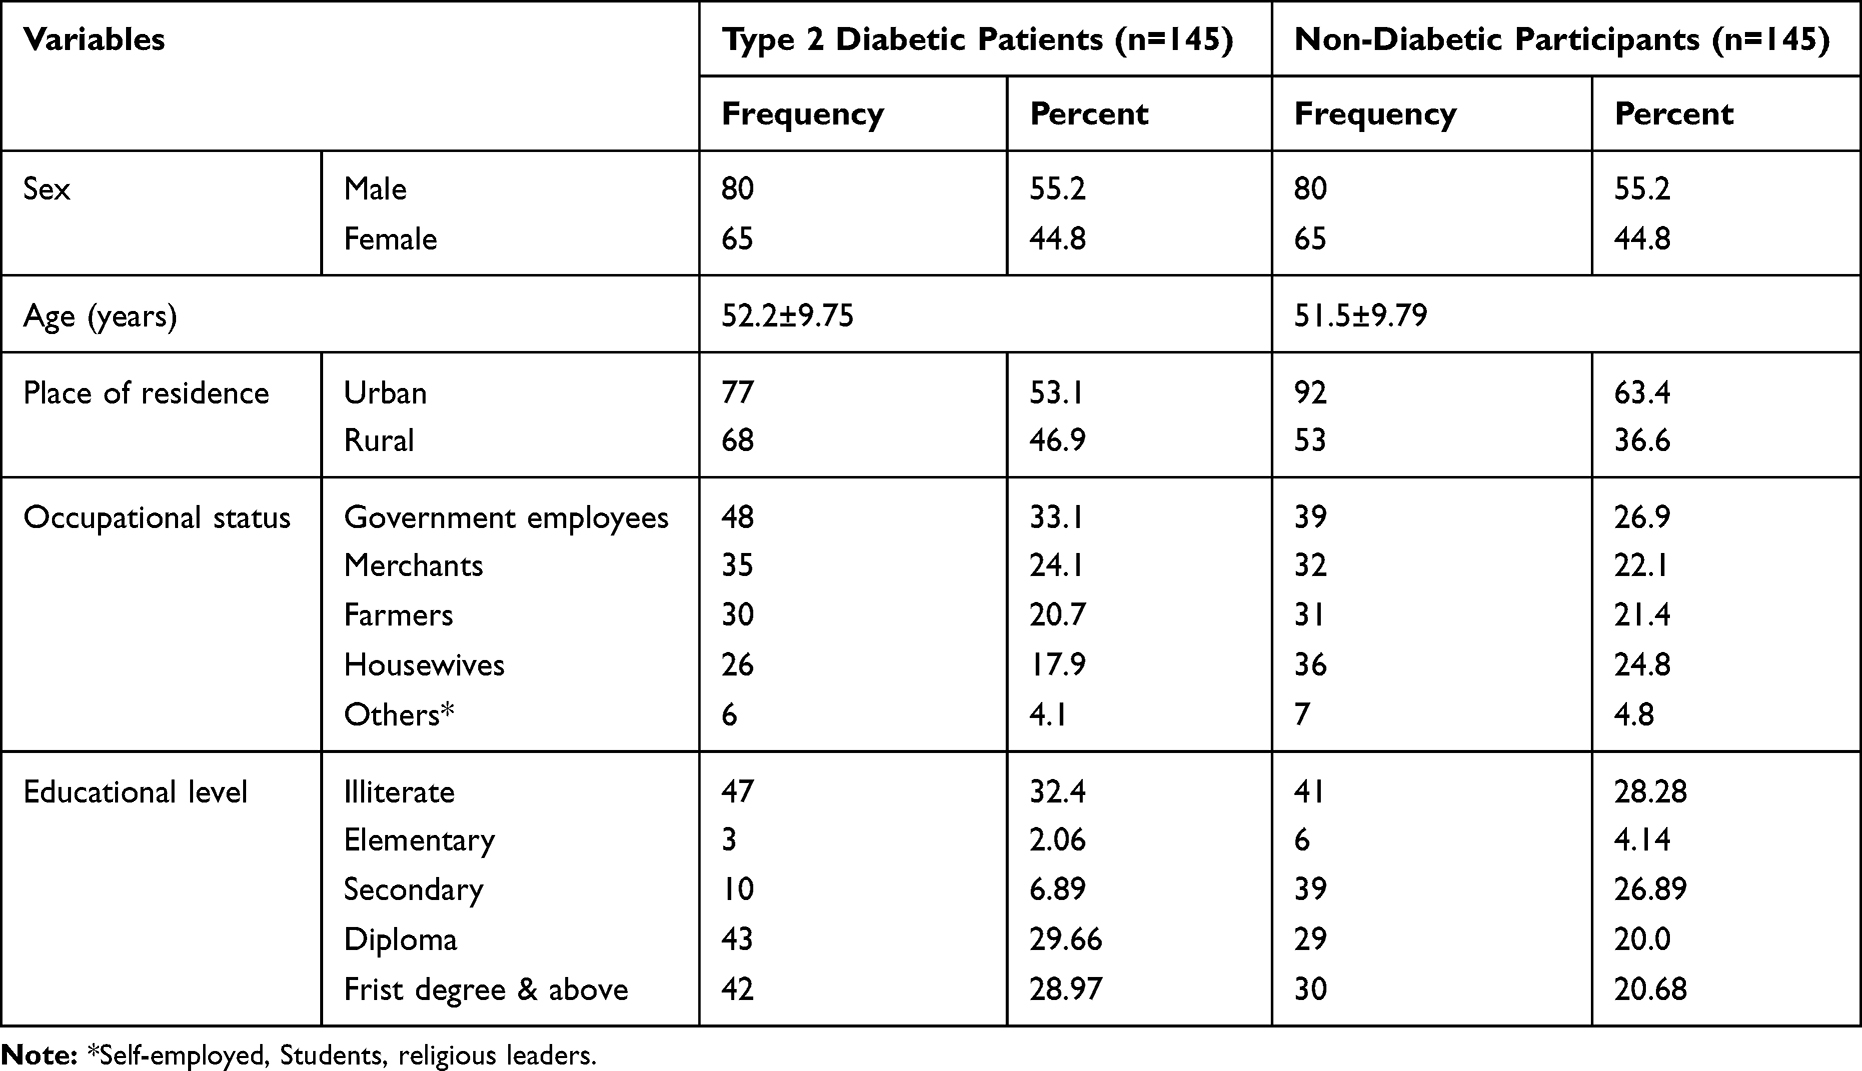 |
Table 1 Frequency Distribution of Socio-Demographic Characteristics of the Respondents at JMC, Jimma, Southwest Ethiopia, April 1–May 30, 2019 (n=290) |
Anthropometric and Clinical Characteristics of the Respondents
The mean height of the type 2 diabetics and non-diabetic respondents were 1.66±0.089 m and 1.65±0.098 m, respectively. The mean weight of patients with type 2 diabetes and non-diabetic participants were 73±11.5 kg and 71.9±11 kg, respectively. The mean FBS of patients with type 2 DM and non-diabetic participants were 144.7±30.5 mg/dL and 88.1±11.2 mg/dL, respectively (Table 2).
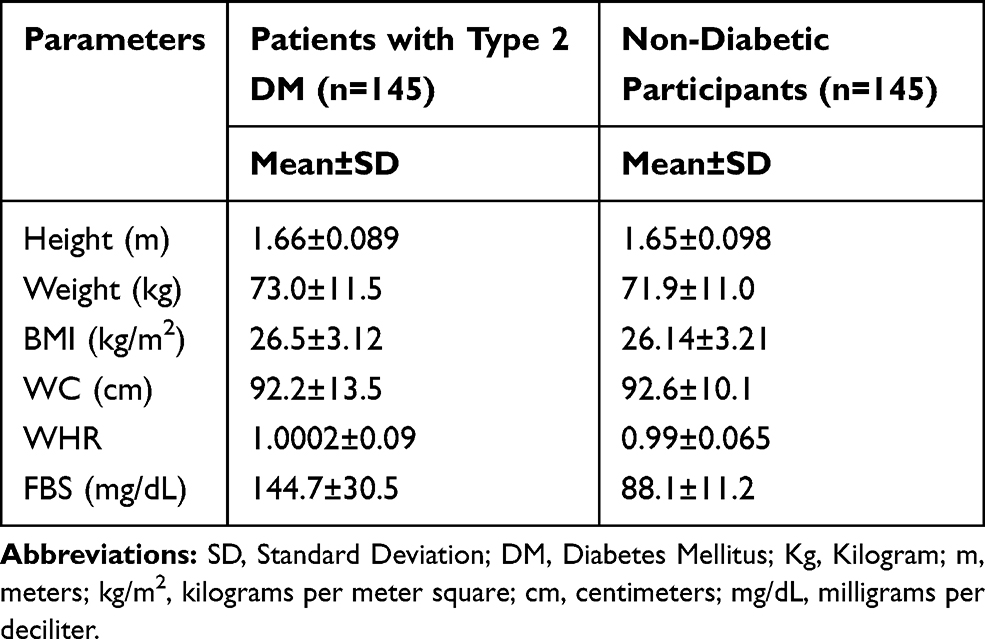 |
Table 2 Anthropometric and Clinical Parameters of the Respondents at JMC, Jimma, Southwest Ethiopia, April 1–May 30, 2019 (n=290) |
Comparison of Means of the PFTs among Type 2 Diabetics and Non-Diabetic Participants
An independent samples t-test was performed to compare means of FVC, FEV1, FEV1/FVC, PEF, and FEF25–75 among type 2 diabetic patients and non-diabetic participants. Assumptions of the independent samples t-test (normality and homogeneity) were performed and met based on findings of Shapiro–Wilk and Levene’s tests when P-value>0.05.
The present study showed that there was significantly reduced mean of FVC (%) among type 2 diabetic patients (m=73.7±13.8) compared to non-diabetic participants (m=93.8±12.3, P<0.001). The study also indicated that mean of FEV1 (%) was significantly reduced among type 2 diabetic patients (m=76.4±13.4) when compared to non-diabetic participants (m=93.3±12.4, P<0.001).
This study also revealed that there was a significant reduction in the mean score of FEV1/FVC (%) among type 2 diabetic patients (m=78.99±11.4) when compared to non-diabetic participants (m=96.6±9.33, P<0.001).
The current study also indicated that the mean of PEF (L/s) was significantly reduced among type 2 diabetic patients (m=3.91±0.28) when compared to non-diabetic participants (m=5.03±0.35, P<0.001). There was a significantly reduced mean score of FEF25–75 (L/s) among type 2 diabetic patients (m=2.89±0.75) compared to non-diabetic participants (m=3.39±0.82, P<0.001) (Table 3).
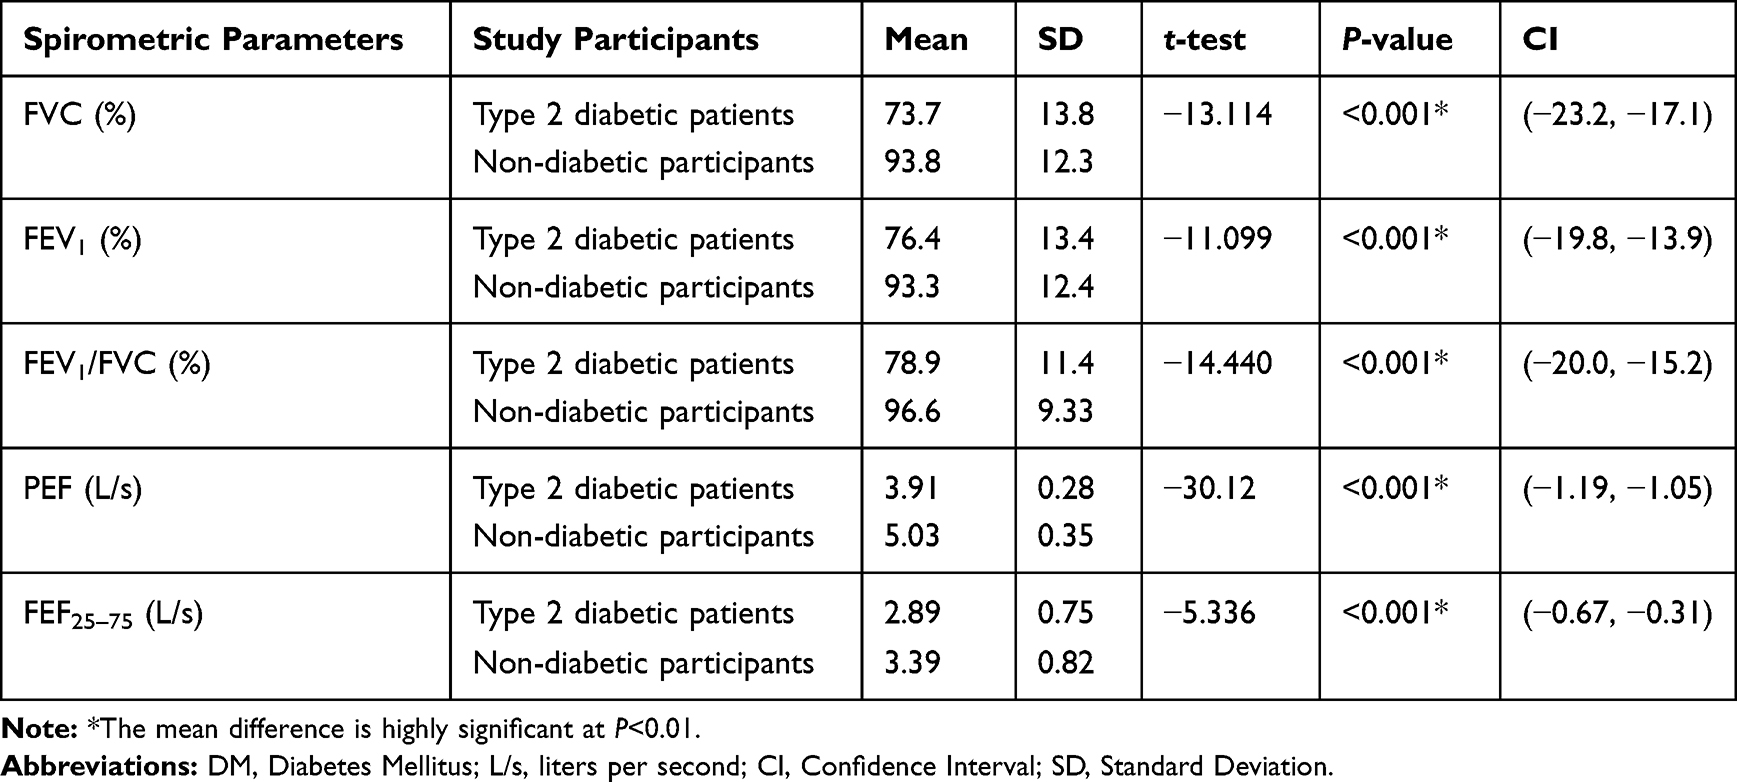 |
Table 3 Comparison of the Means of PFTs among Type 2 Diabetic Patients and Non-Diabetic Participants at JMC, Jimma, Southwest Ethiopia, April 1–May 30, 2019 (n=290) |
Predictors of the Pulmonary Function Tests among Type 2 Diabetic Patients
Simple Linear Regression Model Showing Predictors of PFTs among Type 2 Diabetic Patients
A simple linear regression was calculated to predict participants’ FVC (%), FEV1 (%), FEV1/FVC (%), PEF (L/s), and FEF25–75 (L/s) based upon different variables. The assumptions of simple linear regression (normality, homogeneity, outlier, and linearity) was checked and met. A simple linear regression revealed significant association between the PFTs and age, weight, height, WC, WHR, & BMI, low physical activity (when vigorous activity taken as reference), and FBS. Variables like sex (male taken as reference), place of residence (rural taken as reference), occupational status (merchant taken as reference), educational level (primary school taken as reference), and moderate physical activity had no linear association with the PFTs since P>0.05.
Multiple Linear Regression Model Showing Predictors of PFTs among Type 2 Diabetic Patients
Multiple linear regression analysis was employed to determine the best linear combinations of age, weight, WC, WHR, Height, BMI, FBS, and low physical activity which were significant in the simple linear regression model. The assumptions of multiple linear regression like multicollinearity is met. A unit change in BMI (kg/m2) results in a 0.88 percentage decrease in FVC when FBS held constant (β=−0.88, CI=−1.76, −0.006). A unit change in FBS (mg/dL) results in a 0.22 percentage decrease in FVC when BMI is kept constant (β=−0.22, CI=−0.29, −0.15).
A unit change in BMI (kg/m2) results in a 1.93 percentage decrease in FEV1 when FBS is held constant (β=−1.93, CI=−2.9, −0.96). A unit change in FBS (mg/dL) results in a 0.29 percentage decrease in FEV1 when BMI is kept constant (β=−0.29, CI=−0.37, −0.21). A unit change in BMI (kg/m2) results in a 1.93 percentage decrease in FEV1/FVC when FBS is held constant (β=−1.403, CI=−2.46, −0.097). A unit change in BMI (kg/m2) results in a 1.39 L/s decrease in PEF when FBS is held constant (β=−1.39, CI=−2.73, −0.06, P<0.001). A unit change in FBS (mg/dL) results in a 0.15 L/s decrease in PEF when BMI is kept constant (β=−0.15, CI=−0.27, −0.04). A unit change in BMI (kg/m2) results in a 0.075 L/s decrease in FEF25–75 when FBS is held constant (β=−0.075, CI=−0.123, −0.026). A unit change in FBS (mg/dL) results in a 0.009 L/s decrease in FEF25–75 when BMI is kept constant (β=−0.009, CI=−0.013, −0.005) (Table 4).
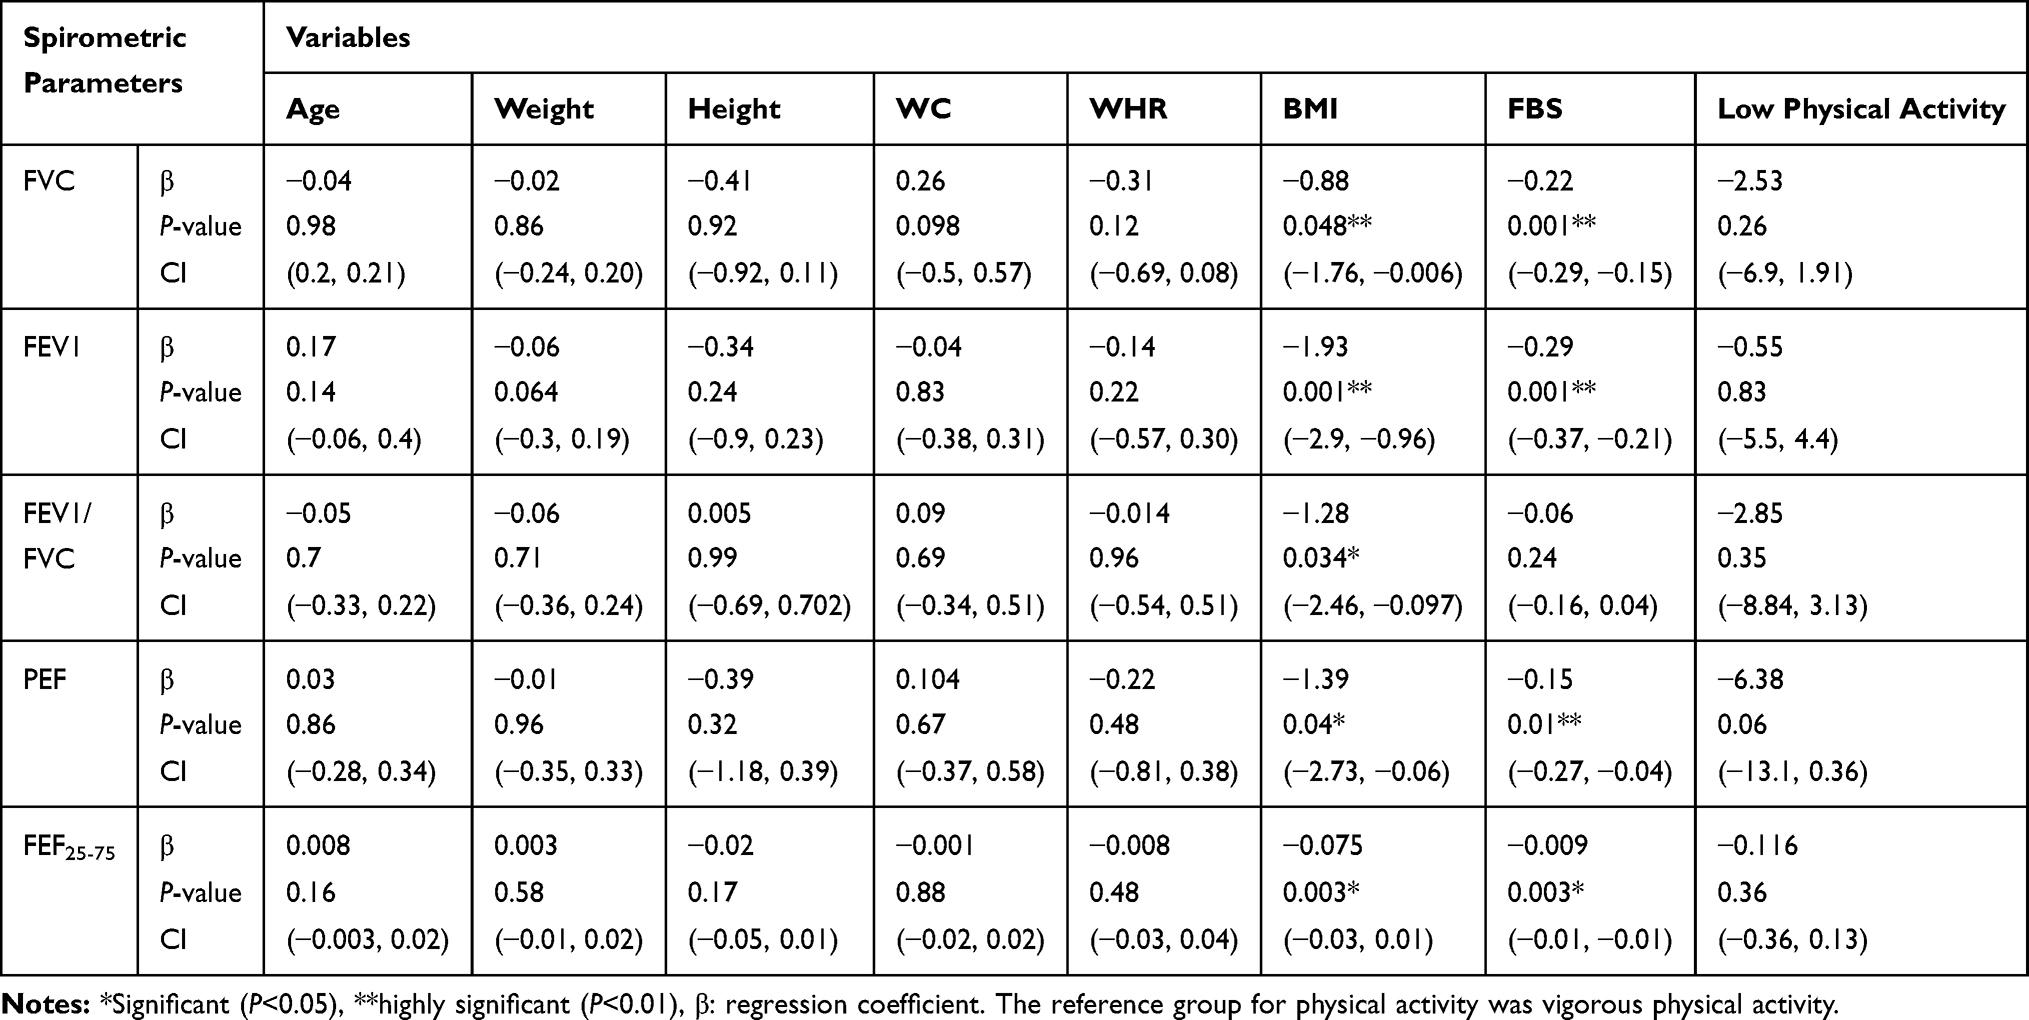 |
Table 4 Multiple Linear Regression Model Showing Predictors of PFTs Among Type 2 Diabetic Patients at JMC, Jimma, Southwest Ethiopia, April 1–May 30, 2019 (n=145) |
Predictors of the PFTs among Non-Diabetic Participants
A simple linear regression revealed that no significant association between the PFTs and age, sex (male taken as reference), occupation (merchant taken as reference), education (primary school students taken as reference), weight, height, WC, WHR, BMI, FBS, and physical activity (vigorous physical activity taken as reference) among non-diabetic participants since P>0.05 (Table 5).
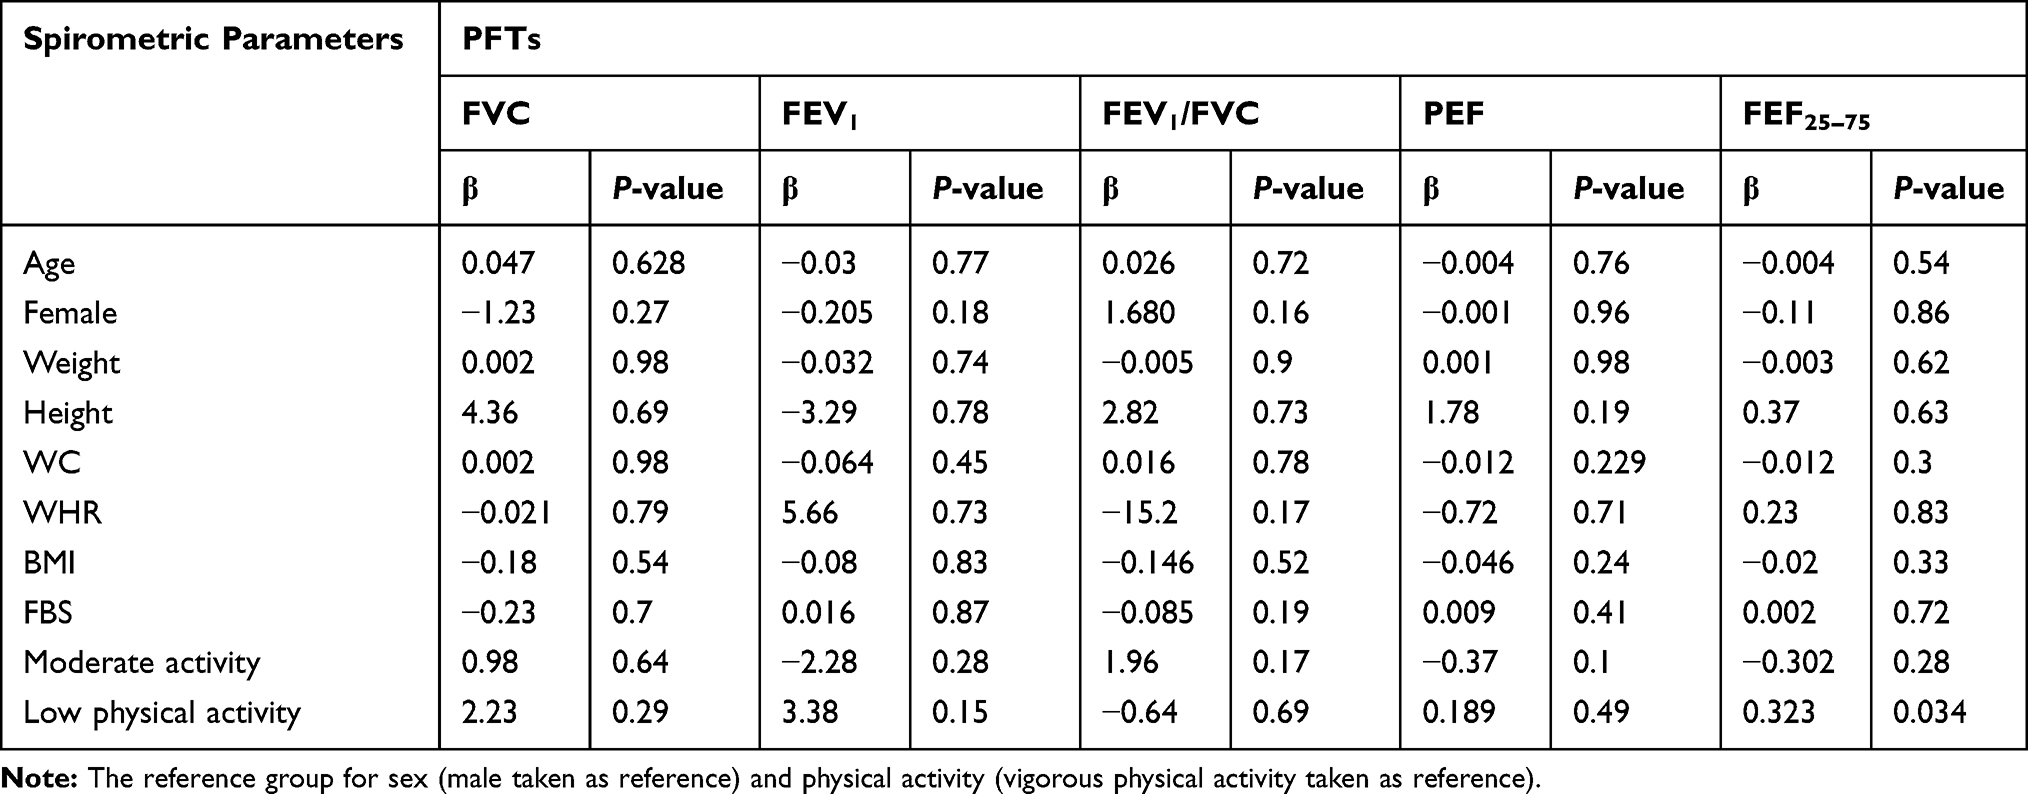 |
Table 5 Simple Linear Regression Model Showing Predictors of PFTs Among Non-Diabetic Participants at JMC, Jimma, Southwest Ethiopia, April 1–May 30, 2019 (n=145) |
Discussion
The present study shows that means of FVC and FEV1 were significantly reduced among type 2 diabetic patients, which were in line with the study carried out in Ghana.22 This reduction may be attributed to the thickening of the alveolar epithelium and the pulmonary capillary basal lamina and also due to the reduced recoiling of the lung which prevents lung expansion, so the volume and elastic recoil of the lung were reduced in type-2 diabetic patients.8,9
On the other hand, the findings of the present study were not in line with a study in Sudan,19 which indicated that means of FVC and FEV1 between the diabetic patients and their matched control group showed no significant differences. The possible explanation for the difference may be due to methodological, socio-demographic factors and anthropometric variation.
In the present study there was a significant decrease in mean FEV1/FVC in type 2 diabetics as compared to normoglycemic participants. This result of study was in agreement with a study conducted in Saudi Arabia.16 The alteration in collagen and elastin ratio is the main factor in the diabetic patients. This study was not in line with a study done in Ghana, Sudan, Egypt, and Pakistan, which reported that means of FEV1/FVC between the diabetic patients and their matched control group showed no significant differences. This difference may may due to a variation in methodology, socio-demographic and anthropometric characteristics of the participants. This finding was also not in line with a study done in India, which indicated that FEV1/FVC was statistically increased among diabetics when compared to non-diabetic participants.14,20 This may be due to the difference in methodology, socio-demographic and anthropometric characteristics of the participants.
In this study, the mean of PEF was significantly reduced among the diabetics, which was in line with a study conducted in India.19 A possible explanation for this reduction is reduction of force generating capacity of the expiratory muscle and the reduced recoiling of the lungs.8
In the current study, the mean of FEF25–75 was significantly reduced among the type 2 diabetics. Forced expiration is supported by recoil forces and muscles of the respiratory system. A decrease in muscular and recoiling forces of the respiratory system because of increased glycosylation and microangiopathy is responsible for the significant decrease in FEF25–75.8 This study was not in line with a study done in Pakistan23 which reported that means of FEV1/FVC between the diabetic patients and their matched control group showed no significant differences. This may be due to differences in methodology, socio-demographic and anthropometric characteristics of the participants.
The present study indicated that BMI was an independent risk factor of FVC, FEV1, FEV1/FVC, PEF, and FEF25–75. These findings may be due to BMI being associated with reduced chest wall compliance and increased airway resistance and, hence, leading to deranged PFTs.24
The current study indicated that FBS was a independent risk factor of the means for FVC, FEV1, FEV1/FVC, PEF, and FEF25–75. This reduction may be attributed to the sustained hyperglycemia causing glycosylation of lung collagen and hence less compliant lung parenchyma leading to abnormal pulmonary function tests.8,9
Static lung volume parameters and pulmonary diffusion capacity for carbon monoxide were not recorded since equipment to measure the parameters were not available.
Conclusion and Recommendations
Conclusion
The present study showed that there were significantly reduced means scores of FVC, FEV1, FEV1/FVC, PEF, and FEF25–75 among type 2 diabetic patients as compared to non-diabetic participants. The FBS and BMI were independent risk factors of the PFTs among the diabetics unlike that of non-diabetic participants.
Recommendations
- Routine screening programs of the FVC, FEV1, FEV1/FVC, PEF, and FEF25–75 are needed to be designed by the ministry of health.
- All type 2 diabetic patients need to be screened by performing the FVC, FEV1, FEV1/FVC, PEF, and FEF25–75 during their initial visits and every 2 years to ascertain the status of lung function.
- All type 2 diabetic patients with higher BMI and FBS are needed to be screened to ascertain the status of lungs by performing the FVC, FEV1, FEV1/FVC, PEF, and FEF25–75.
- Future longitudinal studies are needed to explain a causal relationship between decreased FVC, FEV1, FEV1/FVC, PEF, FEF25–75 and risk factors among the diabetics.
- Future studies are needed to confirm the reduction of the FVC, FEV1, FEV1/FVC, PEF, and FEF25–75 with static lung volume parameters and pulmonary diffusion capacity for carbon monoxide.
Disclosure
The authors report no conflicts of interest in this work.
References
1. Papanas N, Maltezos E. Etiology, pathophysiology and classifications of the diabetic Charcot foot. Diabet Foot Ankle. 2013;4(1):20872. doi:10.3402/dfa.v4i0.20872
2. Forbes JM, Cooper ME. Mechanisms of diabetic complications. Physiol Rev. 2013;93(1):137–188. doi:10.1152/physrev.00045.2011
3. Cho N, Shaw JE, Karuranga S, et al. IDF diabetes atlas: global estimates of diabetes prevalence for 2017 and projections for 2045. Diabetes Res Clin Pract. 2018;138:271–281. doi:10.1016/j.diabres.2018.02.023
4. Wolde M, Berhe N, Van Die I, Medhin G, Tsegaye A. Knowledge and practice on prevention of diabetes mellitus among diabetes mellitus family members, in suburban cities in Ethiopia. BMC Res Notes. 2017;10(1):551. doi:10.1186/s13104-017-2871-7
5. Goldman MD. Lung dysfunction in diabetes. Diabetes Care. 2003;26(6):1915–1918. doi:10.2337/diacare.26.6.1915
6. Pitocco D, Fuso L, Conte EG, et al. The diabetic lung-a new target organ? Rev Diabetic Stud. 2012;9(1):23. doi:10.1900/RDS.2012.9.23
7. Hsia CC, Raskin P. Lung involvement in diabetes: does it matter? Am Diabetes Assoc. 2008.
8. Popov D. Is lung a target of diabetic injury? The novel pros and cons evidences. Proc Rom Acad Ser B. 2013;15(2):99–104.
9. Nakamura N, Taguchi K, Miyazono Y, et al. AGEs–RAGE overexpression in a patient with smoking-related idiopathic nodular glomerulosclerosis. CEN Case Rep. 2018;7(1):48–54. doi:10.1007/s13730-017-0290-1
10. Hancox RJ, Poulton R, Greene JM, et al. Systemic inflammation and lung function in young adults. Thorax. 2007;62(12):1064–1068. doi:10.1136/thx.2006.076877
11. Vinik AI, Maser RE, Mitchell BD, Freeman R. Diabetic autonomic neuropathy. Diabetes Care. 2003;26(5):1553–1579. doi:10.2337/diacare.26.5.1553
12. Jenkins C. Spirometry performance in primary care: the problem, and possible solutions. Prim Care Respir J. 2009;18(3):128. doi:10.4104/pcrj.2009.00057
13. Tandon N, Anjana RM, Mohan V, et al. The increasing burden of diabetes and variations among the states of India: the global burden of disease study 1990–2016. Lancet Glob Health. 2018;6(12):e1352–e1362. doi:10.1016/S2214-109X(18)30387-5
14. Ranu H, Wilde M, Madden B. Pulmonary function tests. Ulster Med J. 2011;80(2):84.
15. Pellegrino R, Viegi G, Brusasco V, et al. Interpretative strategies for lung function tests. Eur Respir J. 2005;26(5):948–968. doi:10.1183/09031936.05.00035205
16. Meo SA. Significance of spirometry in diabetic patients. Int J Diabetes Mellit. 2010;2(1):47–50. doi:10.1016/j.ijdm.2009.12.003
17. Miller MR, Hankinson J, Brusasco V, et al. Standardisation of spirometry. Eur Respir J. 2005;26(2):319–338. doi:10.1183/09031936.05.00034805
18. Knuiman MW, James AL, Divitini ML, Ryan G, Bartholomew HC, Musk AW. Lung function, respiratory symptoms, and mortality: results from the Busselton Health Study. Ann Epidemiol. 1999;9(5):297–306. doi:10.1016/S1047-2797(98)00066-0
19. Bharat I, Singh R, Sehgal C, Sharma S, Saha AK, Paul UK. Study of pulmonary function test in newly diagnosed diabetes in a tertiary care teaching hospital, Kishanganj, Bihar. Int J Innovative Res Med Sci. 2018;3(08):2142–to. doi:10.23958/ijirms/vol03-i08/04
20. Jamatia SN, Wangkheimayum K, Singh WA, Yumnam G. Effect of glycemic status on lung function tests in type 2 diabetes mellitus. J Med Soc. 2014;28(2):69. doi:10.4103/0972-4958.141071
21. Terry PC, Karageorghis CI, Curran ML, Martin OV, Parsons-Smith RL. Effects of music in exercise and sport: a meta-analytic review. Psychol Bull. 2020;146(2):91. doi:10.1037/bul0000216
22. Hayfron-Benjamin C The association between glycaemic state and spirometric indices in Ghanaian individuals with Type 2 diabetes mellitus. [PhD Thesis]. University of Ghana; 2013.
23. Irfan M, Jabbar A, Haque AS, Awan S, Hussain SF. Pulmonary functions in patients with diabetes mellitus. Lung India. 2011;28(2):89. doi:10.4103/0970-2113.80314
24. Fogarty AW, Jones S, Britton JR, Lewis SA, McKeever TM. Systemic inflammation and decline in lung function in a general population: a prospective study. Thorax. 2007;62(6):515–520. doi:10.1136/thx.2006.066969
 © 2020 The Author(s). This work is published and licensed by Dove Medical Press Limited. The
full terms of this license are available at https://www.dovepress.com/terms
and incorporate the Creative Commons Attribution
- Non Commercial (unported, 3.0) License.
By accessing the work you hereby accept the Terms. Non-commercial uses of the work are permitted
without any further permission from Dove Medical Press Limited, provided the work is properly
attributed. For permission for commercial use of this work, please see paragraphs 4.2 and 5 of our Terms.
© 2020 The Author(s). This work is published and licensed by Dove Medical Press Limited. The
full terms of this license are available at https://www.dovepress.com/terms
and incorporate the Creative Commons Attribution
- Non Commercial (unported, 3.0) License.
By accessing the work you hereby accept the Terms. Non-commercial uses of the work are permitted
without any further permission from Dove Medical Press Limited, provided the work is properly
attributed. For permission for commercial use of this work, please see paragraphs 4.2 and 5 of our Terms.