Back to Journals » International Journal of Chronic Obstructive Pulmonary Disease » Volume 18
Pulmonary Function Test and Obstructive Sleep Apnea Hypopnea Syndrome in Obese Adults: A Retrospective Study
Authors Hao Y, Liu S, Liu T, Huang X, Xie M ![]() , Wang D
, Wang D
Received 20 February 2023
Accepted for publication 28 May 2023
Published 5 June 2023 Volume 2023:18 Pages 1019—1030
DOI https://doi.org/10.2147/COPD.S409383
Checked for plagiarism Yes
Review by Single anonymous peer review
Peer reviewer comments 2
Editor who approved publication: Professor Min Zhang
Yijia Hao,1 Shaozhuang Liu,2 Teng Liu,2 Xin Huang,2 Mengshuang Xie,3 Dexiang Wang4
1Cheeloo College of Medicine, Shandong University, Jinan, 250033, People’s Republic of China; 2Division of Bariatric and Metabolic Surgery, Department of General Surgery, Qilu Hospital, Cheeloo College of Medicine, Shandong University, Jinan, 250012, People’s Republic of China; 3Department of Geriatrics & Key Laboratory of Cardiovascular Proteomics of Shandong Province, Qilu Hospital, Cheeloo College of Medicine, Shandong University, Jinan, 250012, People’s Republic of China; 4Department of Pulmonary and Critical Care Medicine, Qilu Hospital, Cheeloo College of Medicine, Shandong University, Jinan, 250012, People’s Republic of China
Correspondence: Dexiang Wang, Email [email protected]
Objective: We explore risk factors related to severe obstructive sleep apnea (OSA) in obese patients, including pulmonary ventilation function, diffusion function, and impulse oscillometry (IOS) data.
Methods: The medical records of 207 obese patients who were prepared to undergo bariatric surgery in a hospital from May 2020 to September 2021 were retrospectively reviewed. Polysomnography (PSG), pulmonary ventilation function, diffusion function, and IOS parameters were collected according to the ethical standards of the institutional research committee (registration number: KYLL-202008-144). Logistic regression analysis was used to analyze the related independent risk factors.
Results: There were significantly statistical difference in a number of pulmonary ventilation and diffusion function parameters among the non-OSAHS group, the mild-to-moderate OSA group, and the severe OSA group. However, only airway resistance parameters R5%, R10%, R15%, R20%, R25%, and R35% increased with increasing OSA severity and were positively correlated with apnea hypopnea index (AHI). Age (P = 0.012, 1.104 (1.022, 1.192)), body mass index (P< 0.0001, 1.12 (1.057, 1.187)), gender (P = 0.003, 4.129 (1.625, 10.49)), and R25% (P = 0.007, 1.018 (1.005, 1.031)) were independent risk factors for severe OSA. In patients aged 35 to 60, RV/TLC (P = 0.029, 1.272 (1.025, 1.577)) is an independent risk factor for severe OSA.
Conclusion: R25% was an independent risk factor for severe OSA in obese individuals, while RV/TLC was also an independent risk factor in those aged 35 to 60. Pulmonary function tests (PFTs), particularly IOS levels, are recommended to assess severe OSA in obese patients.
Keywords: obstructive sleep apnea syndrome, obesity, pulmonary function
Introduction
Obstructive sleep apnea syndrome (OSAHS) is the most common chronic respiratory disease.1 The pathophysiological mechanism of OSAHS is recurrent complete or incomplete upper airway obstruction during sleep, resulting in transient hypoxemia and sleep arousal.2 Patients with OSAHS are prone to cardiovascular disease, diabetes mellitus, stroke, hypertension, and other complications due to irregular breathing and apnea.3 Available data suggest that even in developed countries, the majority of patients with OSAHS are still not diagnosed as early as possible. In developing countries, awareness of obstructive sleep apnea (OSA) is generally insufficient.4 It is estimated that approximately 80% of OSA patients are undiagnosed.5 Several studies have estimated that OSA is associated with substantial economic costs, especially if untreated.6 Moreover, severe OSA substantially increases the risk of coronary heart disease, stroke, and all-cause mortality.7,8 Therefore, it is crucial to detect OSAHS risk factors, especially severe OSA.
The relationship between weight gain and the development and worsening of OSA is well established.9 The incidence of OSAHS is high in obese patients, and severe OSA is closely related to the increase of BMI. It has been shown that a 10% increase in body weight can increase the risk of OSA by 30%.10 Furthermore, obesity is strongly associated with the severity of OSA. Obese patients tend to have severe forms of OSA, as it is shown that change in weight is directly proportionate to sleep disordered breathing.11 Severe OSA patients were more susceptible to hypertensive, hyperlipidemic, and metabolic syndrome.12 Zdravkovic et al found that patients with severe OSA and increased BMI may have more pronounced systemic chronic low-grade inflammation and metabolic syndrome, which may lead to an increased risk of cardiovascular diseases.13
The pulmonary function tests (PFTs) include spirometry, pulmonary diffusion function examination, and impulse oscillatory (IOS). Pulmonary function screening is a crucial indicator for early detection and assessment of respiratory disorders.14 In obese patients combined with OSA, PFTs are useful to assess the type of pulmonary dysfunction and the risk of complications.15 The gold standard for the diagnosis of OSA is polysomnography (PSG), but it is expensive and time-consuming, difficult to accept by patients and poorly reproducible.16 PFT is non-invasive, easy to operate and reproducible. Especially in IOS, the airway resistance value can be measured only by calm breathing, and the airway resistance value of different anatomical parts of the whole airway can be obtained.17 IOS may be a potential screening tool for OSA diagnosis as it can detect upper airways stenosis or patency in OSA.18 However, the relationship between lung function and OSAHS, especially in obese patients, is still poorly understood.
Severe OSA has a high prevalence in the obese population and can cause multi-organ and multi-system damage, resulting in significant economic costs. However, most OSA patients are not diagnosed in a timely and clear manner. PFTs, especially IOS, may be a potential screening tool for OSA diagnosis and are more feasible than PSG. In this study, we access the occurrence and severity of OSA in adult obese patients, as well as the pulmonary function of patients with different severity of OSA to investigate the independent risk factors of severe OSA in obese adults, which aims to provide a basis for disease prevention and treatment.
Materials and Methods
Study Subjects
We conducted a retrospective review of the medical records of 207 consecutive obese patients who were scheduled to undergo bariatric surgery at the Department of Metabolism and Bariatric Surgery, Qilu Hospital of Shandong University, between May 2020 and September 2021. To be included in the data analysis, patients needed to meet the following inclusion criteria: (1) in accordance with the indications for bariatric metabolic surgery of Multidisciplinary Clinic consensus on diagnosis and treatment of obesity (2021 Edition);19 (2) age between 18 and 60 years; (3) no contraindications of PFTs and PSG; (4) complete PFTs and PSG data. (5) signed written informed consent to use data for research purposes. All records and data were fully anonymized. Exclusion criteria were as follows: (1) unable to tolerate PFTs or PSG; (2) sleep orders that could be attributed to central sleep apnea, hypothyroidism, acromegaly, vocal cord paralysis, cardiac insufficiency, stroke, gastroesophageal reflux, neuromuscular diseases, and other specific causes were excluded from the analysis; (3) airway anatomic abnormalities, including nasal obstruction (deviation of nasal septum, turbinate hypertrophy, nasal polyps, nasal tumors, etc.), hypertrophy of tonsils above grade II, relaxation of the soft palate, excessively long and thick uvula, pharyngeal stenosis, pharyngeal tumors, pharyngeal mucosa hypertrophy, tongue hypertrophy, tongue root fall, mandibular retraction, and small jaw deformity, among others; (4) bronchial or pulmonary diseases. The study was approved by the ethical standards of the Institutional Research Committee (registration number: KYLL-202008-144) of Qilu Hospital, Cheeloo College of Medicine, Shandong University.
Methods
Polysomnography
The diagnosis of OSA was confirmed by polysomnography lasting no less than 7 hr. Patients were advised not to consume sedative drugs, alcohol, tea, and coffee within 24 hr before sleep monitoring. Sleep apnea monitoring included the use of electroencephalogram, electrooculogram, electromyogram of the chin, oronasal airflow, electrocardiogram, chest and abdominal movements, and arterial oxygen saturation. Monitoring indicators included AHI, minimum oxygen saturation, average oxygen saturation, oxygen desaturation index, total oxygen desaturation, and average snoring duration. OSA severity was defined by the AHI as follows: non-OSAHS (AHI<5), mild OSA (5≤AHI<15), moderate OSA (15≤AHI<30), and severe OSA (AHI≥30).20
Pulmonary Function Tests
Pulmonary function tests were performed in the sitting position.
Spirometry
The date of birth, height, and weight of the patients were accurately recorded before the spirometry measurement. The process of spirometric measurements was strictly in accordance with quality control standards.
The spirometry results of grade A or B or C were identified as alternative report.21 Pulmonary function indicators including VC, FVC, FEV1, FEV1/FVC, MEF75%, MEF50%, MEF25%, MMEF75/25, PEF, and MVV were measured. The measured and predicted values of FEV1/FVC were recorded, while the measured values and percentage of predicted values of other indicators were collected.
Impulse Oscillometry
We conducted an airway resistance assessment using the IOS in the sitting position. The principle of IOS is to measure the flow response of the central and peripheral respiratory tract to externally applied pressure signals. We obtained parameters at frequencies of 5, 10, 15, 20, 25, 30, and 35 Hz. R5 represents total airway resistance, while R20 represents central airway resistance and R5–20 represents peripheral airway resistance. R5–20 was defined as Rrs at 5 Hz minus Rrs at 20 Hz.22 R5, R10, R15, R20, R25, and R35 represent the measured values as a percentage of the predicted values.
Pulmonary Diffusion Function Test
We assessed pulmonary diffusion function parameters using the standard single-breath DLCO test. The diffusing capacity for carbon monoxide (DLCO) is the amount of CO transferred from the alveolar gas to blood capillaries per unit time and per unit pressure difference, which is the main indicator of diffusion function. In the single-breath method, the patient inhales a gas mixture containing 0.3% carbon monoxide and a low concentration of inert gas (0.3% neon, 0.3% methane, or 10% helium). The patient then holds his or her breath for approximately 10 s and exhales the gas. We collected alveolar samples to calculate DLCO. We recorded the parameters, including RV, RV/TLC, DLCO, TLC, DLCO/VA, FRC-SB, FRC%, TLC-SB, FRC%TLC-SB, and RV/TLC, as both measured and predicted values. Meanwhile, we recorded the other indexes as measured values as a percentage of the predicted values.
Statistics
Descriptive statistics were presented as either the number (percentage) for categorical variables or median (lower to upper quartile) for numerical variables with non-normal distributions. To compare the descriptive data among three groups, namely the non-OSAHS group, the mild-to-moderate OSA group, and the severe OSA group, we employed the Wilcoxon and Chi-square tests for numerical and categorical values, respectively. Given that the AHI values were not normally distributed, we used Spearman rank correlation analysis to investigate the correlation between AHI and other variables. We categorized AHI into severe (>30) and mild-moderate (≤30) based on the severity of OSA and used it as the dependent variable. Variables that were significant by univariate analysis were subjected to multivariate logistic regression analysis combined with clinical practice. Additionally, we performed subgroup analysis based on age, sex, and BMI. All statistical analyses were conducted using SAS V.9.4 (SAS Institute Inc., Cary, North Carolina, USA). Furthermore, to evaluate the pattern and magnitude of association between R25 and development of severe OSA, we employed non-parametric restricted cubic splines with four knots defined at the 5th, 35th, 65th, and 95th percentiles of R25. A P-value less than 0.05 was considered statistically significant, and all P-values were two-sided.
Results
Baseline Characteristics
A total of 207 patients were included in the study. Overall, 88.9% were OSAHS patients and 30.9% were severe OSA patients. The baseline characteristics and sleep monitoring indexes of the patients are summarized in Table 1. Patients were divided into three groups according to the level of AHI, non-OSAHS group (AHI < 5), mild-to-moderate OSA group (5 ≤ AHI < 30), and severe OSA group (AHI ≥ 30). There was no statistical significance in age between the three groups (P = 0.239). BMI was statistically different between the three groups (P < 0.0001). BMI was substantially higher in the severe OSA group (48.4±12.6) than in the mild-to-moderate OSA group (41.3 ± 8.7) and the non-OSAHS group (34.4 ± 9.5).
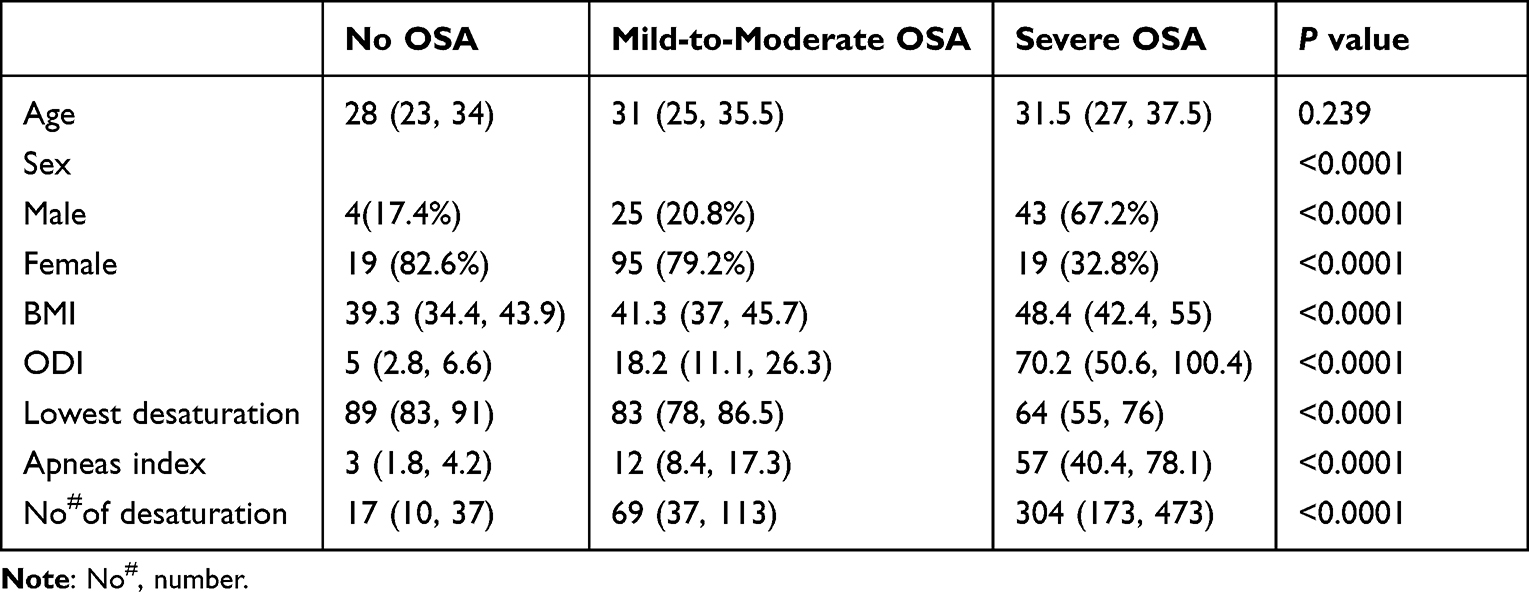 |
Table 1 Patients’ Baseline Characteristic |
Pulmonary Function Test Results
The pulmonary ventilation function, diffusion function, and IOS data of the non-OSAHS group, the mild-to-moderate OSA group, and the severe OSA group are summarized in Tables 2–4, respectively. VC (P < 0.0001), FVC (P < 0.0001), FEV1 (P < 0.0001), FEV1/FVC (P = 0.024), MEF75% (P = 0.003), MEF50% (P = 0.012), MEF25% (P = 0.006), PEF (P = 0.047), MMEF75/25 (P = 0.004), TLC (P < 0.0001), and DLCO/VA (P = 0.002) showed statistical significance among the three groups. However, these spirometry and pulmonary diffusion function parameters did not exhibit a single increase or decrease trend with the severity of OSA. R5 (P = 0.001), R10 (P < 0.0001), R15 (P < 0.0001), R20 (P < 0.0001), R25 (P < 0.0001), and R35 (P = 0.003) showed statistical significance among the three groups. There was a significant positive correlation between the IOS parameters and the OSA severity. While R5-R20, which represents peripheral airway resistance, showed no statistical significance among the three groups (P = 0.054).
 |
Table 2 Patients’ Pulmonary Ventilation Function Data |
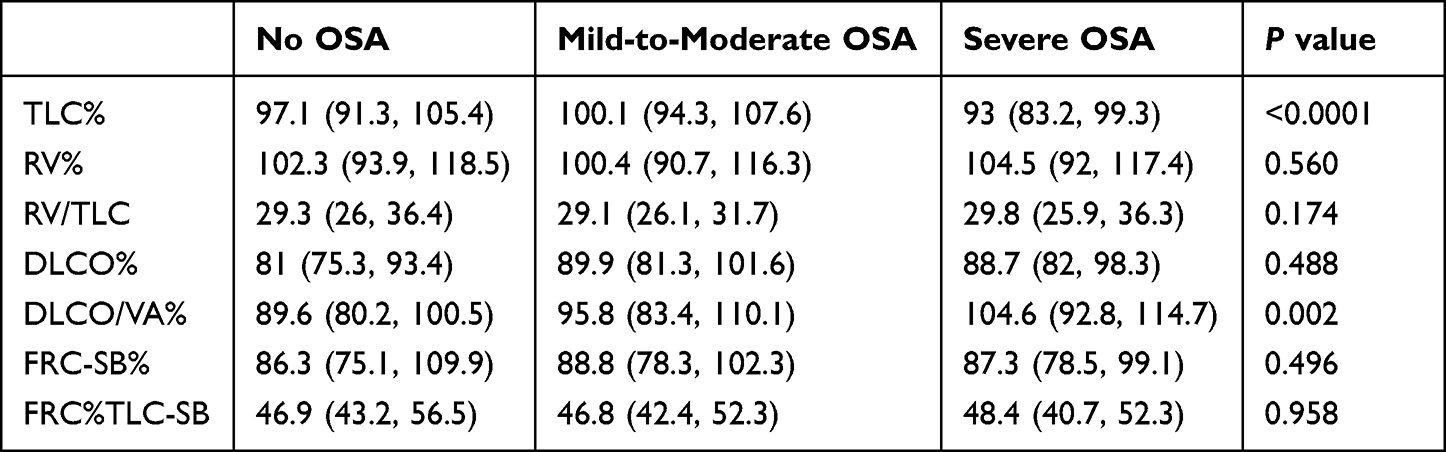 |
Table 3 Patient’s Pulmonary Diffusion Function Data |
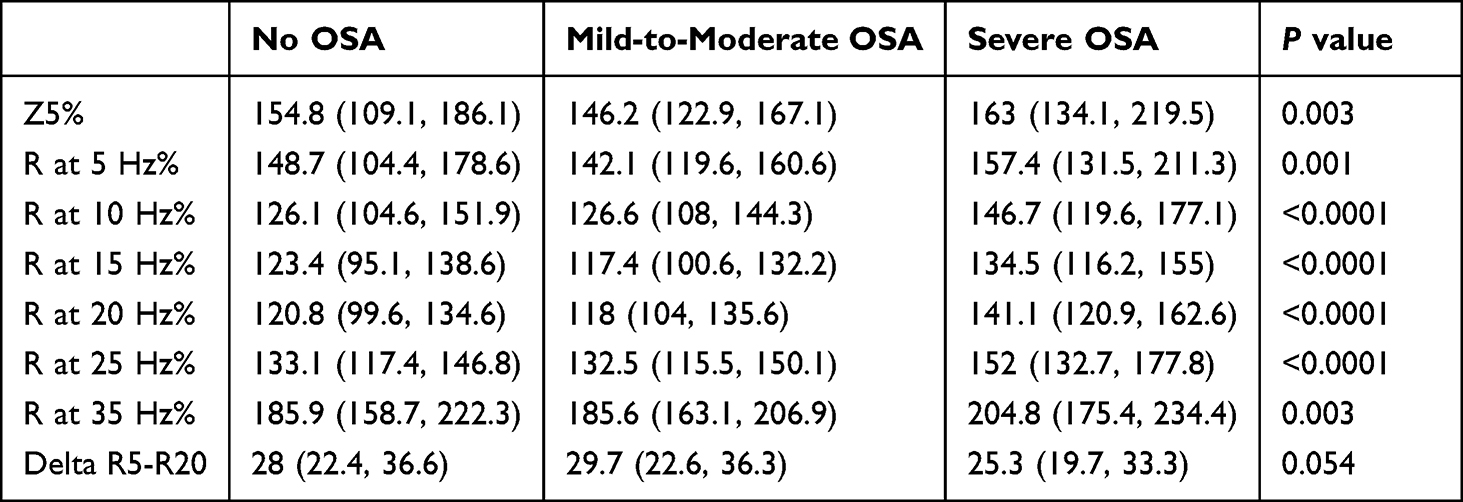 |
Table 4 Patients’ IOS Data |
Risk Factors for Severe OSA in Obese Patients Evaluated by Univariate Analysis
The results of the univariate analysis of severe OSA are shown in Table 5. In addition to gender (P < 0.0001, 7.781 (3.93,15.403)), and BMI (P < 0.0001,1.118 (1.07,1.168)), several indicators of pulmonary ventilation function, diffusion function, and IOS were statistically significant.
 |
Table 5 Univariable Logistic Regression Model for Risk Factors of Severe OSA |
Multivariable Logistic Regression Model for Predictors of Severe OSA in Obese Patients
The results of further multivariate analyses are shown in Table 6. Age, gender, BMI, DLCO%, FEV1/FVC, FEV1%, R25, and RV/TLC were included in the multivariate logistic regression model according to the results of univariate analysis and clinical practice. The results showed that age (P = 0.012, 1.104 (1.022, 1.192)), BMI (P < 0.0001, 1.12 (1.057, 1.187)), gender (P = 0.003, 4.129 (1.625, 10.49)) and R25 (P = 0.007, 1.018 (1.005, 1.031)) were independent risk factors of severe OSA in all OSAHS patients. In the subgroup analysis based on gender (Table 7), we found that only R25 (P = 0.032, 1.018 (1.002, 1.034)) and BMI (P = 0.022, 1.089 (1.012, 1.171)) were independent risk factors of severe OSA among men, while in women they were age (P = 0.010, 1.162 (1.037, 1.301)) and BMI (P < 0.0001, 1.178 (1.079, 1.287)). In the subgroup analysis based on age (Table 8), BMI (P = 0.002, 1.103 (1.036, 1.174)), male (P = 0.004, 5.302 (1.723, 16.319)), and R25 (P = 0.042, 1.014 (1, 1.028)) were independent risk factors of severe OSA among those aged 18 to 35, while BMI (P = 0.039, 1.173 (1.008, 1.365)), and RV/TLC (P = 0.029, 1.272 (1.025, 1.577)) were independent risk factors among those aged 35 to 60. In the subgroup analysis based on BMI (Table 9), age (P = 0.044, 1.117 (1.003, 1.245)), gender (P = 0.021, 4.273 (1.244, 14.68)), and R25 (P = 0.011, 1.021 (1.005, 1.037)) were independent risk factors of severe OSA in the group with 30 kg/m2 ≤ BMI ≤ 35 kg/m2, while gender (P = 0.018, 5.487 (1.341, 22.454)) was the only independent risk factor in the group with BMI > 35 kg/m2.
 |
Table 6 Muiltvariable Logistic Regression Model for Risk Factors of Severe OSA |
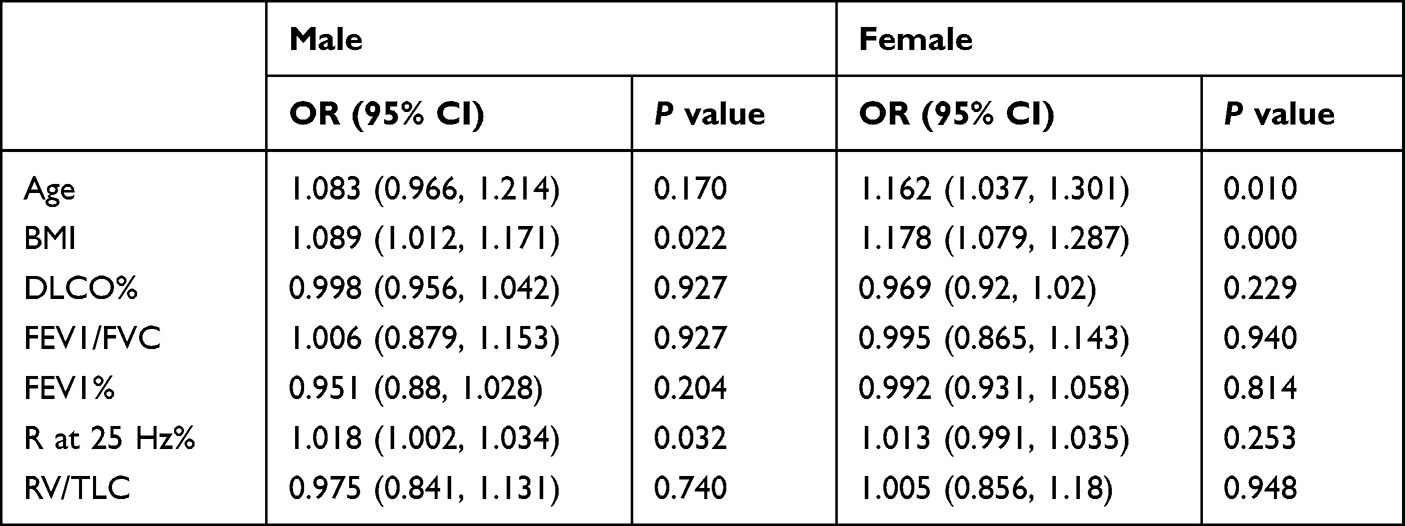 |
Table 7 Subgroup Analysis Based on Sex |
 |
Table 8 Subgroup Analysis Based on Age |
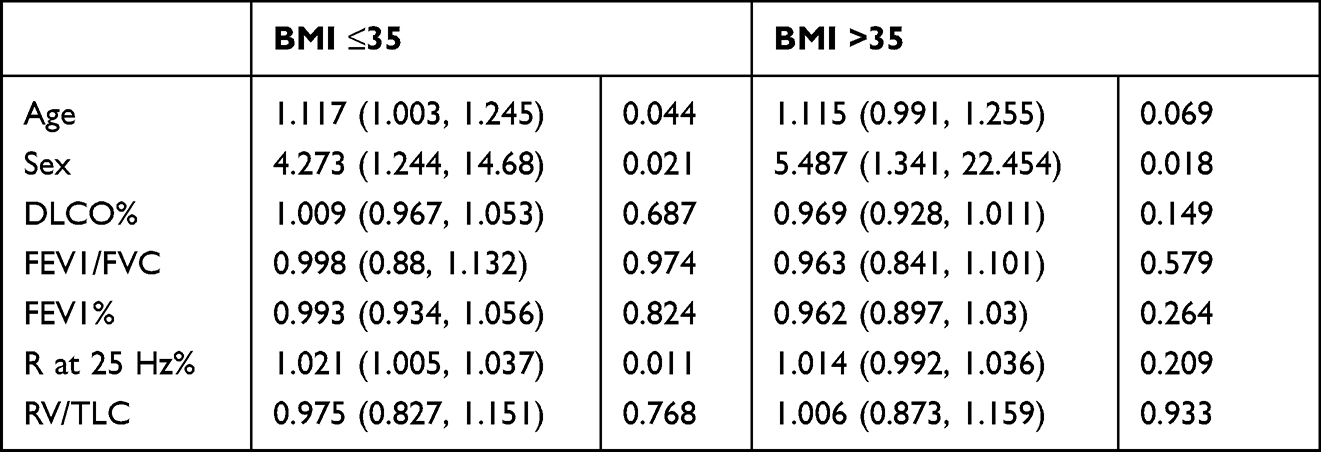 |
Table 9 Subgroup Analysis Based on BMI |
Associations Between R25 and Severe OSA
Odds ratio (OR) and 95% CI derived from restricted cubic spline regression, with 4 knots defined at the 5th, 35th, 65th, and 95th percentiles of the distribution of R25. It was found that the OR was basically stable when R25 was less than the median 137; when R25 was greater than 137, the OR showed a significant increasing trend with the increase of R25 (as shown in Figure 1).
 |
Figure 1 Association of R25 with the risk of severe OSA among OSAHS adult patients with obesity. |
Discussion
Obese individuals are more likely to develop OSAHS, but their development of severe OSA is unknown.23 Lung function is decreased in obese patients and OSA is related to it, but the correlation between pulmonary function and OSA severity has not been reported. In addition to age, BMI, and gender, our study revealed that R25 was an independent risk factor for severe OSA in adult obese individuals. The higher the R25, the higher the risk of severe OSA. RV/TLC is an independent risk factor for severe OSA in obese adults between aged 35 to 60.
The prevalence of OSAHS is increasing annually, and there are significant variations between regions and populations. Prior epidemiological surveys in numerous Chinese provinces and cities have shown that the prevalence of OSAHS among adults is approximately 4%.24 Using data from the Wisconsin cohort, the first OSAHS-related demographic study performed in 1993 determined that the prevalence of OSAHS in the United States was 2–4%.25 In a Swiss population-based study of 2121 cases, the prevalence of moderate-to-severe OSA in males was 49.7% while in females it was 23.5%.26 It has been demonstrated that 50–70% of OSAHS patients are correlated with obesity, and the prevalence of OSAHS in obese individuals can reach 40–90%. The prevalence and severity of OSA showed an increasing trend towards increasing BMI. In the group with a BMI of 31.0 kg/m2, the prevalence of OSAHS was as high as 60%, while the incidence of moderate-to-severe OSA was 26%. The percentage of OSAHS in the population with severe obesity (BMI 40 kg/m2) was as high as 98%, while 33% suffer from moderate-to-severe OSA.27 The subjects of this study were morbidly obese individuals who were prepared to undergo bariatric surgery. The incidence of OSAHS was 88.9%, while severe OSA prevalence was 30.9%.
The results of this study showed that gender, BMI, and age were independent risk factors of severe OSA, which were consistent with previous studies.28,29 In addition, we conducted subgroup analysis. The independent risk factors of severe OSA were different among different subgroups, but only BMI was the common independent risk factor of severe OSA in all subgroups. Obesity is undoubtedly one of the most important pathogenic factors of OSAHS, which is the reason why we chose obese patients as our research objects. OSA is considered to be one of the most common comorbidities of obesity, and severe OSA leads to serious consequences. The risk of cardiovascular complications is significantly increased in obese patients with severe OSA.30 The mortality rate of patients with untreated severe OSA is 3.8 times higher than that of the general population.31 In the future, severe OSA may also become one of the indications for surgical intervention in obese patients.
Male is not an independent risk factor for severe OSA in people aged 35 to 60. In the population with BMI>35 kg/m2, only male was an independent risk factor and female is a protective factor for severe OSA. Due to the protective effect of female specific hormones (such as progesterone), women’s upper respiratory tract is less prone to collapse during sleep. But when women reach menopause, this hormone disappears, so the prevalence of OSAHS in premenopausal women is significantly lower than that in postmenopausal women. The female patients included in this study were less than 60 years old, most of whom were premenopausal women.32
In subgroup analysis by age group, BMI, male, and R25 were independent risk factors in group aged 18 to 35, while BMI and RV/TLC were independent risk factors in group aged 35 to 60. The independent risk factors of OSAHS are different in different age groups, which may be related to degenerative changes that occur with increasing age. Related studies have found that elderly patients have a higher incidence of macroglossia and the palatopharyngeal region is thinner and softer. The muscle laxity of the oropharyngeal walls is usually more obvious in older patients.33,34
In this study, OSA patients with varied severity had statistical significance in spirometry, pulmonary diffusion function, and airway resistance evaluated by IOS, but only airway resistance increased with OSA severity. In other words, airway resistance is the PFT parameter most strongly associated with OSA severity. In obese OSA patients, respiratory impedance (Zrs), resistance (Rrs), and reactance (Xrs) at 5 Hz were significantly correlated with AHI-defined OSA severity.35 The results exhibited that the spirometry and pulmonary diffusion function did not exhibit a single increase or decrease trend with the severity of OSA, ie, they were not positively correlated. However, a number of studies have disclosed that FEV1, FVC, and other markers of lung ventilation function declined in patients suffering from more severe abdominal obesity.36,37 Obesity was a common independent risk factor for OSA and impaired pulmonary ventilation function. However, there may be no correlation between OSA and pulmonary ventilation function.16
IOS-measured airway resistance was the pulmonary function parameter most strongly linked with OSA severity. PSG data were obtained in the nocturnal supine position, whereas PFT parameters were measured in the daytime sitting position. Due to decreased outward recoil from the chest wall mass loading and a relaxed diaphragm, FRC and ERV are greatly reduced in the supine position, which leads to a difference in lung function monitoring compared to sitting. There is a lack of link between OSA severity and pulmonary ventilation function, and it is hypothesized that this may be due to the variation in body posture.
The indexes of pulmonary ventilation function reflect the overall physiological status of the airway, whereas IOS is the airway resistance detection precisely localized to specific anatomical areas, which has a higher sensitivity than spirometry in detecting airway obstruction of OSA patients. It could be hypothesized that IOS has a better correlation with the severity of OSA. Some studies also suggest that IOS is more sensitive than spirometry for detecting airway obstruction in patients with asthma and COPD.38
Posture has a higher effect on lung ventilation function than IOS. More will be discovered if we could quantify spirometry, pulmonary diffusion function, and IOS in both seated and supine positions.
RV/TLC
Multivariate logistic regression analysis revealed RV/TLC to be a significant risk factor for severe OSA in obese patients aged 35 to 60. The association between RV/TLC and OSAHS has not been reported in prior research.
TLC and VC are both decreased in obese individuals.39–42 OSAHS patients have impaired lung function, and the degree of impairment is proportional to the severity of AHI.43 It is speculated that obese people with OSAHS have a more severe impaired lung function than patients without OSAHS.44 In our study, patients with severe OSA had lower TLC, VC, and FVC, as well as larger RV/TLC than those with non-severe OSA.
Inspiration is an active process during respiration; the diaphragm and intercostal muscles contract. Exhalation is a passive procedure in which the muscles do not work. In obese patients, the diaphragm and intercostal muscles have excessive fat infiltration and decreased muscle contractile function.45 Moreover, the chronic load of inspiratory muscles caused by obesity46 leads to the decline of respiratory muscle pump function in obese patients. OSA can also cause a decline in inspiratory muscle function, which is proportional to the severity of the disease.47 OSA and inspiratory muscle dysfunction interact as both cause and effect.
Nóbrega-Júnior et al found that AHI in the intervention group decreased following 8 weeks of inspiratory muscle training (IMT) in individuals with moderate-to-severe OSA, compared to the placebo group.48 Similarly, Lin et al reported that FVC and FEV6.0 of patients with moderate-to-severe OSA were significantly improved after 12 weeks of IMT.41 It is suggested that the enhancement of respiratory muscle function (inspiratory muscle function) in patients with moderate-to-severe OSA can reduce AHI and improve OSA condition.
However, Herkenrath et al reported that both lung function and AHI were not improved after IMT.49 However, the subjects included had mild-to-moderate OSA, and most of them had normal lung function, leaving little room for improvement.
The exact mechanism of inspiratory muscle function in obese individuals with severe OSA remains unknown and needs to be clarified by further studies.
Increased airway resistance is an important pathogenetic factor of OSAHS. Aihara et al demonstrated that airway resistance is a predominant determinant of moderate-to-severe OSA, and R2O plays a crucial role in the variance of AHI.50 A number of studies have reported that R5 and R20 were significantly higher in severe OSA than in non-OSAHS linear regression analysis showed that R5 and R20 are positively correlated with AHI, indicating that airway resistance influences the severity of OSA.51–54 The results revealed that R5-R35 were significantly higher in severe OSA than in non-to-mild OSA. However, multivariate logistic regression analysis demonstrated that only R25 was an independent risk factor for severe OSA. The restricted cubic spline revealed that when R25 was more than the median 137, the OR value increased considerably. There are few studies on the relationship between R25 and severity of OSA.
OSA is characterized by repetitive upper airway collapse and obstruction during sleep. Imaging studies have suggested that obesity can lead to fat deposition within the tongue and soft palate, which not only affects airway size and collapsibility but may also adversely affect muscle function. The extra fat at the base of the tongue may alter the tongue’s shape in the retroglossal region, thus decreasing the size of the retroglossal airway and raising the risk of sleep apnea.55 Moreover, the intra-abdominal pressure is increased in morbid obesity and may influence the diaphragm position. An elevated diaphragm decreases caudal longitudinal traction of trachea through mediastinal structure, leading to a worsening of the upper airway patency and increased its resistance.56–58
As mentioned, it could be speculated that R25, which represents upper airway resistance, can more accurately reflect the severity of OSA than R20, representing central airway resistance. The main advantage of IOS is its ability to perform these measurements in a noninvasive, relatively effort independent, and minimally intrusive manner during spontaneous normal tidal breathing. IOS may be an effective method to screen for severe OSA in obese patients combined with OSAHS.
Limitations
There were limitations in this study. PFT parameters obtained during daytime wakefulness may differ from those measured during nighttime sleep. Additionally, plethysmography is the gold standard for evaluating lung volume, while the subjects are sitting in a sealed box, but the patients were morbidly obese and lacked access to the box, other methods were applied. The population studied includes only obese patients. This is a retrospective study but not a cohort follow-up study. The alleviation of severe OSA and improvements in pulmonary function after bariatric surgery was not followed up.
Conclusion
In this study, we newly discovered that R25 was an independent risk factor for severe OSA in obese adults. And in people aged 35 to 60, RV/TLC was also an independent risk factor for severe OSA. PFTs including IOS are expected to be a predictor for the development of severe OSA in obese patients.
Data Sharing Statement
The datasets used and/or analyzed during the current study are available from the corresponding author on reasonable request.
Ethics Approval and Informed Consent
All research studies on humans have been performed in accordance with the principles stated in the Declaration of Helsinki. Prior to starting the study, ethical approval has been obtained for all protocols from the Qilu Hospital of Shandong University ethics committee to confirm that the study meets national and international guidelines for research on humans. For all studies involving human participants, informed written consent to take part in the research has been obtained prior to the commencement of the study.
Consent for Publication
Written informed consent for publication of their details was obtained from the patient.
Funding
This research received no funding.
Disclosure
The authors declare that they have no competing interests in this work.
References
1. Reutrakul S, Mokhlesi B. Obstructive sleep apnea and diabetes: a state of the art review. Chest. 2017;152(5):1070–1086. doi:10.1016/j.chest.2017.05.009
2. Edwards BA, Redline S, Sands SA, Owens RL. More than the sum of the respiratory events: personalized medicine approaches for obstructive sleep apnea. Am J Respir Crit Care Med. 2019;200(6):691–703. doi:10.1164/rccm.201901-0014TR
3. Hou H, Zhao Y, Yu W, et al. Association of obstructive sleep apnea with hypertension: a systematic review and meta-analysis. J Glob Health. 2018;8(1):010405. doi:10.7189/jogh.08.010405
4. Benjafield AV, Ayas NT, Eastwood PR, et al. Estimation of the global prevalence and burden of obstructive sleep apnoea: a literature-based analysis. Lancet Respir Med. 2019;7(8):687–698. doi:10.1016/S2213-2600(19)30198-5
5. Chung F, Abdullah H, Liao P. STOP-Bang questionnaire: a practical approach to screen for obstructive sleep apnea. Chest. 2016;149:631–638. doi:10.1378/chest.15-0903
6. Streatfeild J, Smith J, Mansfield D, Pezzullo L, Hillman D. The social and economic cost of sleep disorders. Sleep. 2021;44(11):zsab132. doi:10.1093/sleep/zsab132
7. Wang X, Ouyang Y, Wang Z, et al. Obstructive sleep apnea and risk of cardiovascular disease and all-cause mortality: a meta-analysis of prospective cohort studies. Int J Cardiol. 2013;169:207–214. doi:10.1016/j.ijcard.2013.08.088
8. Xie C, Zhu R, Tian Y, Wang K. Association of obstructive sleep apnoea with the risk of vascular outcomes and all-cause mortality: a meta-analysis. BMJ Open. 2017;7(12):e013983. doi:10.1136/bmjopen-2016-013983
9. Hudgel DW, Patel SR, Ahasic AM, et al. American Thoracic Society Assembly on Sleep and Respiratory Neurobiology. The role of weight management in the treatment of adult obstructive sleep apnea. An official American thoracic society clinical practice guideline. Am J Respir Crit Care Med. 2018;198(6):e70–e87. doi:10.1164/rccm.201807-1326ST
10. Martins FO, Conde SV. Gender differences in the context of obstructive sleep apnea and metabolic diseases. Front Physiol. 2021;12:792633. doi:10.3389/fphys.2021.792633
11. Schwartz AR, Patil SP, Laffan AM, et al. Obesity and obstructive sleep apnea: pathogenic mechanisms and therapeutic approaches. Proc Am Thorac Soc. 2008;11(5):185–192.
12. Popadic V, Brajkovic M, Klasnja S, et al. Correlation of dyslipidemia and inflammation with obstructive sleep apnea severity. Front Pharmacol. 2022;13:897279. doi:10.3389/fphar.2022.897279
13. Zdravkovic M, Popadic V, Klasnja S, et al. Obstructive sleep apnea and cardiovascular risk: the role of dyslipidemia, inflammation, and obesity. Front Pharmacol. 2022;13:898072. doi:10.3389/fphar.2022.898072
14. Li F, Huang ZW, Wang XF, et al. Safety and use of pulmonary function tests: a retrospective study from a single center over seven years’ clinical practice. BMC Pulm Med. 2019;19(1):259. doi:10.1186/s12890-019-1019-z
15. Liang BM, Lam DC, Feng YL. Clinical applications of lung function tests: a revisit. Respirology. 2012;17(4):611–619. doi:10.1111/j.1440-1843.2012.02149.x
16. Abdeyrim A, Tang L, Muhamat A, et al. Receiver operating characteristics of impulse oscillometry parameters for predicting obstructive sleep apnea in preobese and obese snorers. BMC Pulm Med. 2016;16(1):125. doi:10.1186/s12890-016-0284-3
17. Rahimi B, Edalatifard M, Haghighi KS, Kazemzadeh H. Evaluation of forced oscillometry technique’s parameters in severe obstructive sleep apnea patients without breathing disorder. J Family Med Prim Care. 2020;9(3):1492–1496. doi:10.4103/jfmpc.jfmpc_954_19
18. Wu J, Zhang H, Shi Y, et al. Reference values of impulse oscillometry (IOS) for healthy Chinese children aged 4–17 years. Respir Res. 2022;23(1):182. doi:10.1186/s12931-022-02080-z
19. Chinese Society of Endocrinology. Diabetes society of china association of Chinese medicine, Chinese society for metabolic and bariatric surgery, et al. Multidisciplinary clinical consensus on diagnosis and treatment of obesity (2021 edition). Chin J Diges Surg. 2021;37(11):959–972.
20. Qaseem A, Holty JE, Owens DK, et al. Management of obstructive sleep apnea in adults: a clinical practice guideline from the American College of Physicians. Ann Intern Med. 2013;159(7):471–483. doi:10.7326/0003-4819-159-11-201312030-00009
21. Graham BL, Steenbruggen I, Miller MR, et al. Standardization of spirometry 2019 update. An official American thoracic society and European respiratory society technical statement. Am J Respir Crit Care Med. 2019;200(8):e70–e88. doi:10.1164/rccm.201908-1590ST
22. Porojan-Suppini N, Fira-Mladinescu O, Marc M, Tudorache E, Oancea C. Lung function assessment by impulse oscillometry in adults. Ther Clin Risk Manag. 2020;16:1139–1150. doi:10.2147/TCRM.S275920
23. Kunos L, Lazar Z, Martinovszky F, et al. Overnight changes in lung function of obese patients with obstructive sleep apnoea. Lung. 2017;195(1):127–133. doi:10.1007/s00408-016-9957-1
24. Ding S, Guo LX. Research progress of obesity and obstructive sleep apnea syndrome. J Clin Int Med. 2020;37(9):616–619.
25. Young T, Palta M, Dempsey J, Skatrud J, Weber S, Badr S. The occurrence of sleep-disordered breathing among middle-aged adults. N Engl J Med. 1993;32:1230–1235. doi:10.1056/NEJM199304293281704
26. Heinzer R, Vat S, Marques-Vidal P, et al. Prevalence of sleep-disordered breathing in the general population: the HypnoLaus study. Lancet Respir Med. 2015;3(4):310–318. doi:10.1016/S2213-2600(15)00043-0
27. Malhotra A, White DP. Obstructive sleep apnoea. Lancet. 2002;360(9328):237–245. doi:10.1016/S0140-6736(02)09464-3
28. Dosman JA, Karunanayake CP, Fenton M, et al. Obesity, sex, snoring and severity of OSA in a first nation community in Saskatchewan, Canada. Clocks Sleep. 2022;4(1):100–113. doi:10.3390/clockssleep4010011
29. Senaratna CV, Perret JL, Lodge CJ, et al. Prevalence of obstructive sleep apnea in the general population: a systematic review. Sleep Med Rev. 2017;34:70–81. doi:10.1016/j.smrv.2016.07.002
30. André S, Andreozzi F, Van Overstraeten C, et al. Cardiometabolic comorbidities in obstructive sleep apnea patients are related to disease severity, nocturnal hypoxemia, and decreased sleep quality. Respir Res. 2020;21(1):35. doi:10.1186/s12931-020-1284-7
31. Young T, Finn L, Peppard PE, et al. Sleep disordered breathing and mortality: eighteen-year follow-up of the Wisconsin sleep cohort. Sleep. 2008;31(8):1071–1078. doi:10.1002/14651858.CD001106.pub3
32. Bonsignore MR, Saaresranta T, Riha RL. Sex differences in obstructive sleep apnoea. Eur Respir Rev. 2019;28(154):190030. doi:10.1183/16000617.0030-2019
33. Lin J, Suurna M. Sleep apnea and sleep-disordered breathing. Otolaryngol Clin North Am. 2018;51:827–833. doi:10.1016/j.otc.2018.03.009
34. Iannella G, Magliulo G, Lo Iacono CAM, et al. Positional obstructive sleep apnea syndrome in elderly patients. Int J Environ Res Public Health. 2020;17(3):1120. doi:10.3390/ijerph17031120
35. Abdeyrim A, Zhang Y, Li N, et al. Impact of obstructive sleep apnea on lung volumes and mechanical properties of the respiratory system in overweight and obese individuals. BMC Pulm Med. 2015;15:76. doi:10.1186/s12890-015-0063-6
36. Sonpeayung R, Janwantanakul P, Thaveeratitham P. Impact of abdominal obesity and smoking on respiratory muscle strength and lung function. J Med Sci. 2020;40(5):224–231. doi:10.4103/jmedsci.jmedsci_5_20
37. Svartengren M, Cai GH, Malinovschi A, et al. The impact of body mass index, central obesity and physical activity on lung function: results of the EpiHealth study. ERJ Open Res. 2020;6(4):00214–2020. doi:10.1183/23120541.00214-2020
38. Bednarek M, Grabicki M, Piorunek T, Batura-Gabryel H. Current place of impulse oscillometry in the assessment of pulmonary diseases. Respir Med. 2020;170:105952. doi:10.1016/j.rmed.2020.105952
39. Watson RA, Pride NB, Louise Thomas E, et al. Reduction of total lung capacity in obese men: comparison of total intrathoracic and gas volumes. J Appl Physiol. 2010;108:1605–1612. doi:10.1152/japplphysiol.01267.2009
40. Chen Y, Horne SL, Dosman JA. Body weight and weight gain related to pulmonary function decline in adults: a six year follow up study. Thorax. 1993;48(4):375–380. doi:10.1136/thx.48.4.375
41. Chinn DJ, Cotes JE, Reed JW. Longitudinal effects of change in body mass on measurements of ventilatory capacity. Thorax. 1996;51(7):699–704. doi:10.1136/thx.51.7.699
42. Wise RA, Enright PL, Connett JE, et al. Effect of weight gain on pulmonary function after smoking cessation in the Lung Health Study. Am J Respir Crit Care Med. 1998;157(3 Pt 1):866–872. doi:10.1164/ajrccm.157.3.9706076
43. Stauffer JL, White DP, Zwillich CW. Pulmonary function in obstructive sleep apnea. Relationships to pharyngeal resistance and cross-sectional area. Chest. 1990;97(2):302–307. doi:10.1378/chest.97.2.302
44. Abdeyrim A, Li N, Shao L, et al. What can impulse oscillometry and pulmonary function testing tell us about obstructive sleep apnea: a case-control observational study? Sleep Breath. 2016;20(1):61–68. doi:10.1007/s11325-015-1185-z
45. Tallis J, James RS, Seebacher F. The effects of obesity on skeletal muscle contractile function. J Exp Biol. 2018;221(Pt 13):jeb163840. doi:10.1242/jeb.163840
46. Nóbrega-Júnior JCN, Dornelas de Andrade A, de Andrade EAM, et al. Inspiratory muscle training in the severity of obstructive sleep apnea, sleep quality and excessive daytime sleepiness: a placebo-controlled, randomized trial. Nat Sci Sleep. 2020;12:1105–1113. doi:10.2147/NSS.S269360
47. Chien MY, Wu YT, Lee PL, Chang YJ, Yang PC. Inspiratory muscle dysfunction in patients with severe obstructive sleep apnoea. Eur Respir J. 2010;35(2):373–380. doi:10.1183/09031936.00190208
48. Lin HC, Chiang LL, Ong JH, Tsai KL, Hung CH, Lin CY. The effects of threshold inspiratory muscle training in patients with obstructive sleep apnea: a randomized experimental study. Sleep Breath. 2020;24(1):201–209. doi:10.1007/s11325-019-01862-y
49. Herkenrath SD, Treml M, Priegnitz C, Galetke W, Randerath WJ. Effects of respiratory muscle training (RMT) in patients with mild to moderate obstructive sleep apnea (OSA). Sleep Breath. 2018;22(2):323–328. doi:10.1007/s11325-017-1582-6
50. Aihara K, Oga T, Harada Y, et al. Analysis of anatomical and functional determinants of obstructive sleep apnea. Sleep Breath. 2012;16:473–481. doi:10.1007/s11325-011-0528-7
51. Zerah-Lancner F, Lofaso F, d’Ortho MP, et al. Predictive value of pulmonary function parameters for sleep apnea syndrome. Am J Respir Crit Care Med. 2000;162(6):2208–2212. doi:10.1164/ajrccm.162.6.2002002
52. Ban Y, Wang Y, Liu S, et al. 2D/3D multimode medical image alignment based on spatial histograms. Appl Sci. 2022;12(16):8261. doi:10.3390/app12168261
53. Jin K, Yan Y, Wang S, et al. iERM: an interpretable deep learning system to classify epiretinal membrane for different optical coherence tomography devices: a multi-center analysis. J Clin Med. 2023;12(2):400. doi:10.3390/jcm12020400
54. Zhang J, Zhao J, Chen M, et al. Airway resistance and allergic sensitization in children with obstructive sleep apnea hypopnea syndrome. Pediatr Pulmonol. 2016;51(4):426–430. doi:10.1002/ppul.23264
55. Kim AM, Keenan BT, Jackson N, et al. Tongue fat and its relationship to obstructive sleep apnea. Sleep. 2014;37(10):1639–1648. doi:10.5665/sleep.4072
56. Liu S, Yang B, Wang Y, Tian JW, Yin LR, Zheng W. 2D/3D multimode medical image registration based on normalized cross-correlation. Appl Sci. 2022;12(6):2828. doi:10.3390/app12062828
57. Nian Q, Zeng JH, He L, et al. A small molecule inhibitor targeting SHP2 mutations for the lung carcinoma. Chin Chem Lett. 2021;32(5):1645–1652. doi:10.1016/j.cclet.2021.01.002
58. Ren SL, Li YR, Wu JX, Ye JY, Jen R. Effects of altered intra-abdominal pressure on the upper airway collapsibility in a porcine model. Chin Med J. 2015;128(23):3204–3210. doi:10.4103/0366-6999.170281
 © 2023 The Author(s). This work is published and licensed by Dove Medical Press Limited. The
full terms of this license are available at https://www.dovepress.com/terms
and incorporate the Creative Commons Attribution
- Non Commercial (unported, 3.0) License.
By accessing the work you hereby accept the Terms. Non-commercial uses of the work are permitted
without any further permission from Dove Medical Press Limited, provided the work is properly
attributed. For permission for commercial use of this work, please see paragraphs 4.2 and 5 of our Terms.
© 2023 The Author(s). This work is published and licensed by Dove Medical Press Limited. The
full terms of this license are available at https://www.dovepress.com/terms
and incorporate the Creative Commons Attribution
- Non Commercial (unported, 3.0) License.
By accessing the work you hereby accept the Terms. Non-commercial uses of the work are permitted
without any further permission from Dove Medical Press Limited, provided the work is properly
attributed. For permission for commercial use of this work, please see paragraphs 4.2 and 5 of our Terms.