Back to Journals » Therapeutics and Clinical Risk Management » Volume 19
PTH Predicts the in-Hospital MACE After Primary Percutaneous Coronary Intervention for Acute ST-Segment Elevation Myocardial Infarction
Authors Wu ZF, Su WT, Chen S, Xu BD, Zong GJ, Fang CM, Huang Z, Hu XJ, Wu GY, Ma XL
Received 2 June 2023
Accepted for publication 8 August 2023
Published 23 August 2023 Volume 2023:19 Pages 699—712
DOI https://doi.org/10.2147/TCRM.S420335
Checked for plagiarism Yes
Review by Single anonymous peer review
Peer reviewer comments 4
Editor who approved publication: Professor De Yun Wang
Zu-Fei Wu,1,* Wen-Tao Su,2,3,* Shi Chen,4 Bai-Da Xu,2 Gang-Jun Zong,2,3 Cun-Ming Fang,1 Zheng Huang,1 Xue-Jun Hu,1 Gang-Yong Wu,2,3 Xiao-Lin Ma1
1Department of Cardiology, Xuancheng People’s Hospital, Xuanchen, Anhui, 242000, People’s Republic of China; 2Department of Cardiology, the 904th Hospital of the PLA Joint Logistics Support Force, Wuxi, Jiangsu, 214044, People’s Republic of China; 3Department of Cardiology, Wuxi Clinical College of Anhui Medical University, Wuxi, Jiangsu, 214044, People’s Republic of China; 4Department of Cardiology, Wuxi No.5 People’s Hospital, Wuxi, Jiangsu, 214044, People’s Republic of China
*These authors contributed equally to this work
Correspondence: Gang-Yong Wu, Department of Cardiology, the 904th Hospital of the PLA Joint Logistics Support Force, Wuxi, Jiangsu, 214044, People’s Republic of China, Email [email protected]
Objective: To investigate the correlation between serum parathyroid hormone (PTH) levels and in-hospital major adverse cardiovascular events (MACE) in patients with acute ST-segment elevation myocardial infarction (STEMI) after primary percutaneous coronary intervention (PCI), and establish a risk prediction model based on parameters such as PTH for in-hospital MACE.
Methods: This observational retrospective study consecutively enrolled 340 patients who underwent primary PCI for STEMI between January 2016 and December 2020, divided into a MACE group (n=92) and a control group (n=248). The least absolute shrinkage and selection operator (LASSO) and logistic regression analyses were used to determine the risk factors for MACE after primary PCI. The rms package in R-studio statistical software was used to construct a nomogram, to detect the line chart C-index, and to draw a calibration curve. The decision curve analysis (DCA) method was used to evaluate the clinical application value and net benefit.
Results: Correlation analysis revealed that PTH level positively correlated with the occurrence of in-hospital MACE. Receiver operating characteristic curve analyses revealed that PTH had a good predictive value for in-hospital MACE. Multivariate logistic regression analysis indicated that Killip class II–IV, and FBG were independently associated with in-hospital MACE after primary PCI. A nomogram model was constructed using the above parameters. The model C-index was 0.894 and the calibration curve indicated that the model was well calibrated. The DCA curve suggested that the nomogram model was better than TIMI score model in terms of net clinical benefit.
Conclusion: Serum PTH levels in patients with STEMI are associated with in-hospital MACE after primary PCI, and the nomogram risk prediction model based on PTH demonstrated good predictive ability with obvious clinical practical value.
Keywords: parathyroid hormone, acute ST-segment elevation myocardial infarction, percutaneous coronary intervention, nomograms
Introduction
Acute myocardial infarction (AMI) is the leading cause of cause-specific mortality in both developed and developing countries.1 In China, the incidence of AMI has increased dramatically over recent decades, becoming a significant cause of death during hospitalization and post-discharge.2,3 The China PEACE Prospective Study of AMI reported that 2.5% of patients had recurrence of AMI within 1 year after discharge, with a 1-year mortality rate approaching 28%. Therefore, early prediction and intervention of in-hospital major adverse cardiovascular events (MACE) after primary percutaneous coronary intervention (PCI) for acute ST-segment elevation myocardial infarction (STEMI) is particularly important. Recent studies reveal that clinical biochemical indicators such as parathyroid hormone (PTH), CysC, C-reactive protein (CRP), and fasting blood glucose (FBG) can potentially be used to assess post-PCI risk.4–6
PTH is a product of the parathyroid glands that influences calcium and phosphorus homeostasis by regulating 1α-25-dihydroxyvitamin D. PTH receptors are widely distributed in the cardiovascular system, including vascular smooth muscle cells, vascular endothelial cells, and cardiac myocytes, and are important targets for endocrine hormones.7 PTH is associated with the development of hypertension, left ventricular hypertrophy, and heart failure (HF). It is also an independent predictor of cardiovascular events in patients with coronary artery disease (CAD), predicting endpoints such as ischemic events, HF, and death.8–10 Previous studies have focused on several single predictive factors of MACE; however, in the real world, multiple risk factors often coexist and mutually influence each other. Considering the limitations of single factors in clinical practice, the construction of a stable clinical model based on multiple biomarkers is necessary and may contribute to the identification of patients at high risk of developing MACE.
Therefore, this study established a nomogram model for predicting the risk of in-hospital MACE in patients who underwent primary PCI using common indicators in clinical practice, and validated the stability of the model.
Patients and Methods
Study Design, Patients, and Clinical Endpoints
This study is a single-center clinical trial. A total of 518 patients with acute STEMI who had undergone primary PCI between January 2016 and December 2020 were retrospectively reviewed and included. The diagnosis of STEMI was based on the diagnostic criteria of the European Society of Cardiology (ESC).11
The exclusion criteria were as follows: (1) a history of myocardial infarction, PCI, or coronary artery bypass graft surgery; (2) a history of cerebral infarction; (3) pulmonary embolism, aortic coarctation, acute and chronic nephritis, and other systemic diseases; (4) combined diseases including hematologic, malignant, or autoimmune diseases, as well as acute and chronic infectious diseases; (5) combined diseases that can cause elevated levels of serum PTH, such as severe HF, abnormal liver and kidney functions (alanine aminotransferase [ALT] or aspartate aminotransferase [AST] > 3 times the upper limit of normal value, estimated glomerular filtration rate [eGFR] < 30mL/min*1.73m²); and (6) intraoperative complications of coronary artery dissection, perforation, and others.
Overall, 178 patients were excluded from the study; 100 with a history of myocardial infarction, cerebral infarction, coronary intervention, and coronary artery bypass graft surgery; 73 with hematologic, malignant, autoimmune diseases, or acute and chronic infectious diseases; and five with intraoperative complications of coronary artery dissection. Finally, 340 patients were included in this study, all of whom were administered standardized dual antiplatelet therapy (aspirin + tegretol/clopidogrel) upon admission.
The clinical endpoints were in-hospital MACE during hospitalization after primary PCI, including cardiogenic shock, cardiogenic death, myocardial reinfarction, HF, and fatal arrhythmias.
Grouping
Based on the occurrence of in-hospital MACE, the patients were divided into two groups; the MACE group (n=92) and the control group (n=248). The MACE group was further divided into two subgroups based on the occurrence of HF; the HF (n=78) and non-HF (n=14) subgroups. According to whether the patients had adverse events after discharge, the discharged patients were divided into pMACE group (n = 57) and control group 2 (n = 191).
PCI
All patients underwent primary PCI within 120 minutes of admission. Coronary angiography and coronary stenting were performed by at least two senior physicians with extensive experience. The interventional strategy was determined and recorded by the operator in accordance with the 2014 ESC / European Association for Cardio-Thoracic Surgery Guidelines on myocardial revascularization.12 These include the status of coronary lesions (including the number of lesions, lesion sites of the target vessel, degree of stenosis, classification of blood flow, degree of calcification, and condition of bifurcation lesion), intraoperative intervention (including the number of interventional vessel branches, pretreatment of the target lesion, number of dilatations, number of stents implanted, total length of the stent, diameter of the stent, management of bifurcation lesion, and post-dilatation data), and postoperative blood flow in the target vessels.
Ethics Approval The Medical Ethics Committee of the 904th Hospital of the PLA Joint Logistics Support Force approved this clinical study under protocol No. 20160102. Each patient signed a written consent form, so that their information could be stored in the hospital’s database and used in the analysis.
Laboratory Tests
Clinical data were collected from all patients on admission, including age, sex, weight, and the status of hypertension, diabetes mellitus, smoking, and alcohol consumption. Fasting cubital venous blood was collected within 24 h of admission for routine blood tests. The indicators of routine blood tests included hemoglobin, platelets, white blood cells, neutrophils, and lymphocytes. In addition, indicators of routine biochemical tests, including albumin, serum creatinine (Scr), lactate dehydrogenase (LDH), FBG, CRP, and CysC, were measured using a fully automated biochemical analyzer (Beckman, USA). For males, the formula for the eGFR was as follows: eGFR (mL/min/1.73 m2) = (140-age) × weight/0.818 × Scr (µmol/l). The eGFR of women was 0.85 times that of men. Renal insufficiency was defined as an eGFR <90 (mL/min/1.73 m2) on admission.
Assessment of Thrombosis in Myocardial Infarction (TIMI) score
The TIMI score was assessed in patients with STEMI. The following eight dichotomous variables were of specific concern: age, systolic blood pressure (SBP), diabetes, hypertension or angina, heart rate, Killip classification, weight, anterior MI, and time to treatment. Among these, anterior ST elevation or left bundle branch block, major risk factors (history of hypertension, diabetes mellitus, or angina), weight <67 kg, and time to treatment > 4 hours were scored 1 point each; Killip Class II–IV, heart rate > 100 bpm, and age between 65 and 74 years were scored 2 points each; and SBP <100 mmHg and age ≥75 years were scored 3 points each. Thus, the total score varied between 0 and 14.13
Killip Classification
The Killip classification was determined based on the previous literature as follows: class 1, no signs of heart failure; class 2, signs indicating mild to moderate heart failure (ie, third heart sound gallop, rales halfway up the lung fields, or elevated jugular venous pressure); class 3, pulmonary edema; and class 4, cardiogenic shock or refractory hypotension.14
Statistical Analysis
SPSS version 22.0 was used for statistical analyses. The Kolmogorov–Smirnov test was used to evaluate the normality of the continuous data. When the data were distributed normally, they were denoted as mean ± standard deviation; otherwise, they were reported as median (25th quartile, 75th quartile). Statistical differences between continuous data were compared using Student’s t-test or one-way analysis of variance for normally distributed values and the Mann–Whitney U-test for non-normally distributed data. Categorical variables are reported as frequencies with percentages. Proportions were assessed using the chi-squared test or Fisher’s exact test if the expected frequency was <5. Spearman correlation analysis was used to evaluate the association between PTH levels and MACE after primary PCI. Receiver operating characteristic (ROC) curves generated based on PTH levels, and the least absolute shrinkage and selection operator (LASSO) regression analysis performed using the glmnet package (4.1–3) of R-studio software (www.r-project.org, version 4.1.2) were used to determine the risk factors for MACE after primary PCI. Variables with P values < 0.1 in the comparison of general information between the patients with and without in-hospital MACE after primary PCI were included in the univariate logistic regression analysis, and the variables with univariate P values < 0.1 were included in the multivariate logistic analysis to determine the independent risk factors for in-hospital MACE after primary PCI. The nomogram was constructed, the C-index was measured, and calibration curves were plotted using the rms package (6.2–0) of the R-studio software. The applicative value in clinical practice and the net benefit were evaluated using the method of decision curve analysis (DCA). All tests were 2-tailed, and statistical significance was defined as a p-value <0.05.
Results
Patient Characteristics
Overall, 340 patients (239 men and 101 women) were included. The mean age was 58.5 ± 13.5 years. Ninety-two (27.06%) patients experienced MACE during hospitalization; 10 (2.94%) cardiogenic deaths, 12 (3.53%) experienced cardiogenic shock, four (1.17%) had myocardial reinfarction, 78 (22.94%) had HF, and 24 (7.06%) had fatal arrhythmia.
Association Between PTH and Clinical Outcomes
Spearman correlation analysis showed that PTH was positively correlated with the occurrence of fatal arrhythmias, HF, cardiogenic shock, cardiogenic death, and overall MACE after primary PCI. The strongest correlation was that between PTH and overall in-hospital MACE after primary PCI, indicating that the higher the PTH level, the higher the likelihood of in-hospital MACE after primary PCI (P<0.05, Table 1).
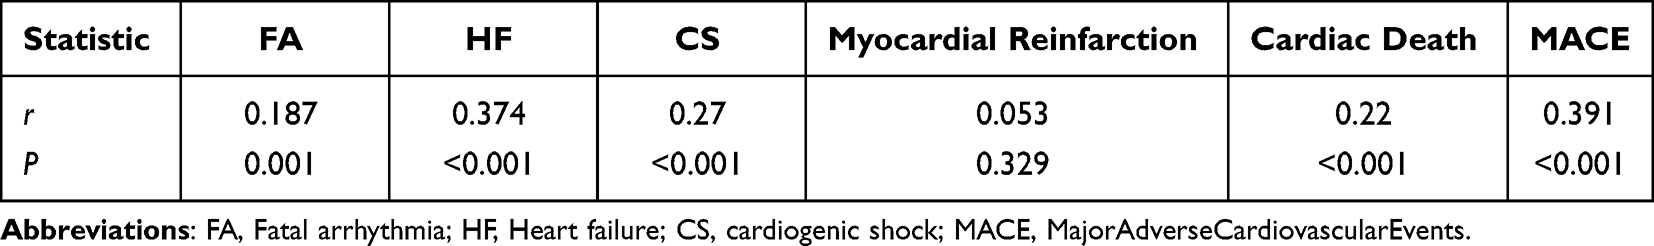 |
Table 1 Correlation Analysis Between PTH and Various Adverse Outcomes of Hospitalization After Emergency PCI |
Assessment of the Predictive Value of PTH for in-Hospital MACE After Primary PCI Using ROC Curve
ROC curve analysis was used to assess the predictive value of PTH level for in-hospital MACE after primary PCI. The results showed that PTH (cut-off value of 68.35 pg/mL) had the highest predictive efficacy for in-hospital MACE after primary PCI, with sensitivity, specificity, and area under the ROC curve of 65.2%, 81.9%, and AUC=0.754, 95% CI(0.694–0.814), P<0.01, respectively (Figure 1), indicating a good predictive ability for in-hospital MACE after primary PCI.
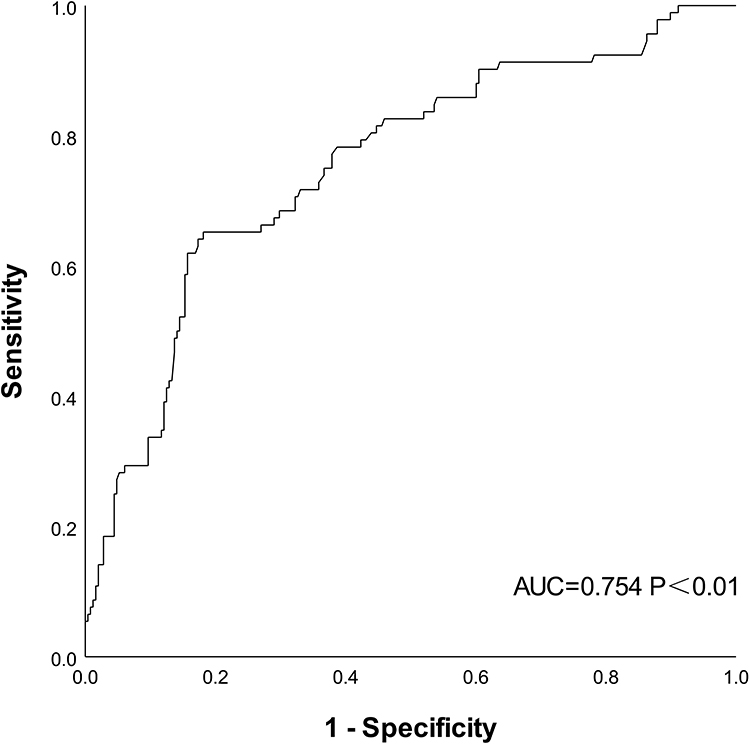 |
Figure 1 ROC curve of PTH in predicting adverse events of hospitalization after emergency PCI. |
Risk Factors for MACE Using LASSO Regression
Sixty-three candidate variables were obtained within 24 h of admission, and these were used for the LASSO regression analysis. With the gradual contraction of the penalty parameter λ, the value of λ with the minimum error in 10-fold cross-validation was selected as the optimal value for the model, and the number of candidate variables for the model was reduced to seven (Figure 2A and B), including Killip Class II–IV, renal insufficiency, PTH, LDH, CysC, CRP, and FBG.
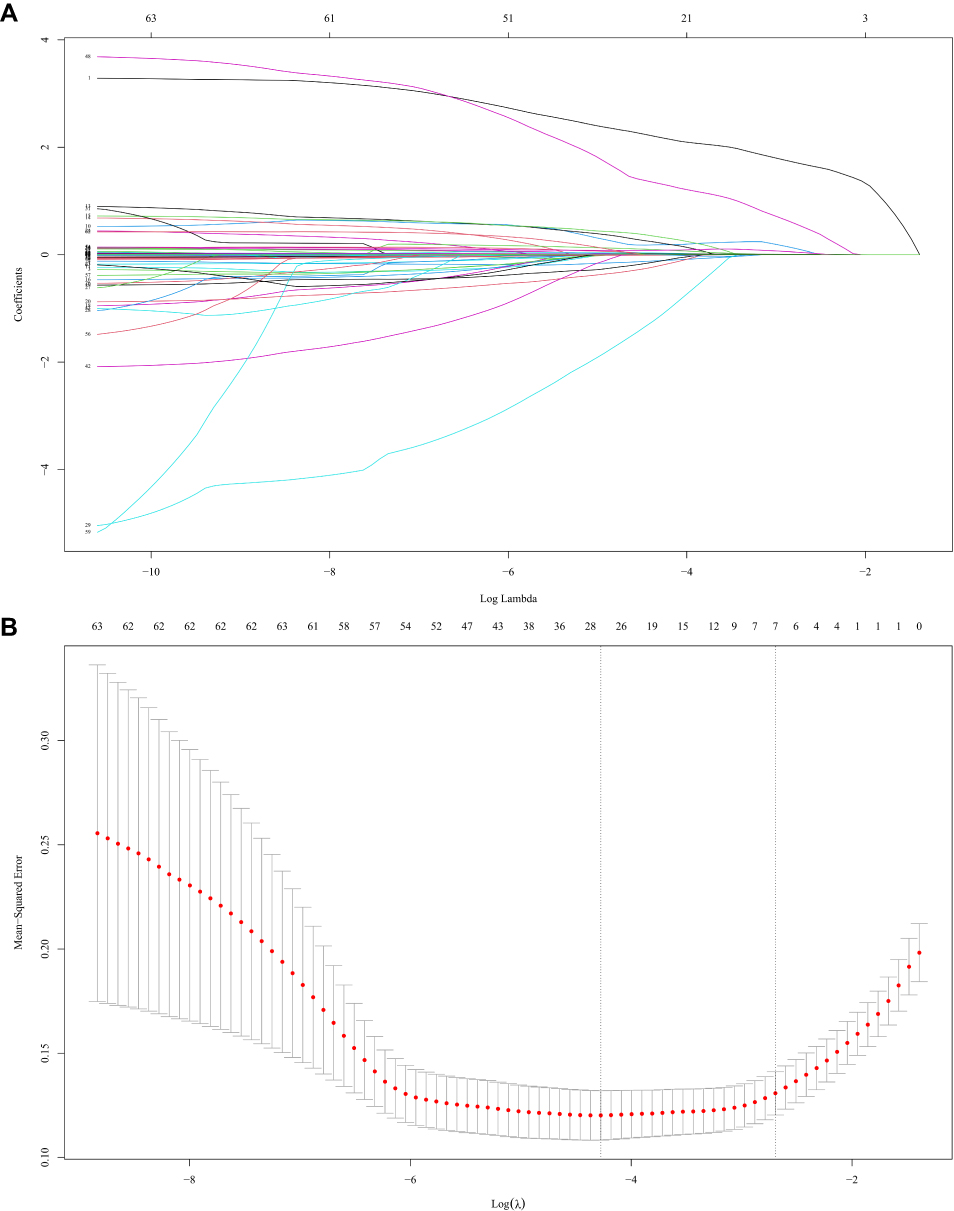 |
Figure 2 Texture feature selection using the least absolute shrinkage and selection operator (LASSO) binary logistic regression model. (A) LASSO coefficient profiles of the 63 features. A coefficient profile plot was produced against the log(λ) sequence. Vertical lines were drawn at the value selected using tenfold cross-validation, where optimal λ resulted in 7 non-zero coefficients. (B) The tuning parameter (λ) selection in the LASSO model used tenfold cross-validation via minimum criteria. The area under the receiver operating characteristic (AUC) curve was plotted versus log(λ). Dotted vertical lines were drawn at the optimal values. The λ value was 0.068. |
Comparison of Patient Characteristics and Risk Factors Between Groups
Based on the results of Lasso regression analysis, according to the known clinical risk factors and previous literature reports, we supplemented the parameters such as age, diabetes, hypertension, admission systolic blood pressure, neutrophils, eGFR, BNP and fibrinogen to compare the data between the two groups.15–18 The results revealed that compared to those without in-hospital MACE, patients with in-hospital MACE after PCI were much older, had higher proportions of combined diseases (including diabetes, renal insufficiency, and Killip Class II–IV), higher levels of neutrophil count, BNP, FIB, PTH, LDH, CysC, CRP, and FBG, and lower levels of SBP and eGFR on admission. Compared to those without HF, patients with HF during hospitalization after PCI were older, had more comorbid diseases (including diabetes, renal insufficiency, and cardiac insufficiency), and had higher levels of neutrophil count, BNP, FIB, PTH, LDH, CysC, CRP, and FBG, and lower levels of SBP and eGFR on admission. Patients with other in-hospital MACE after PCI had significantly lower SBP on admission and higher neutrophil count and BNP, PTH, and LDH levels (P<0.05, Table 2).
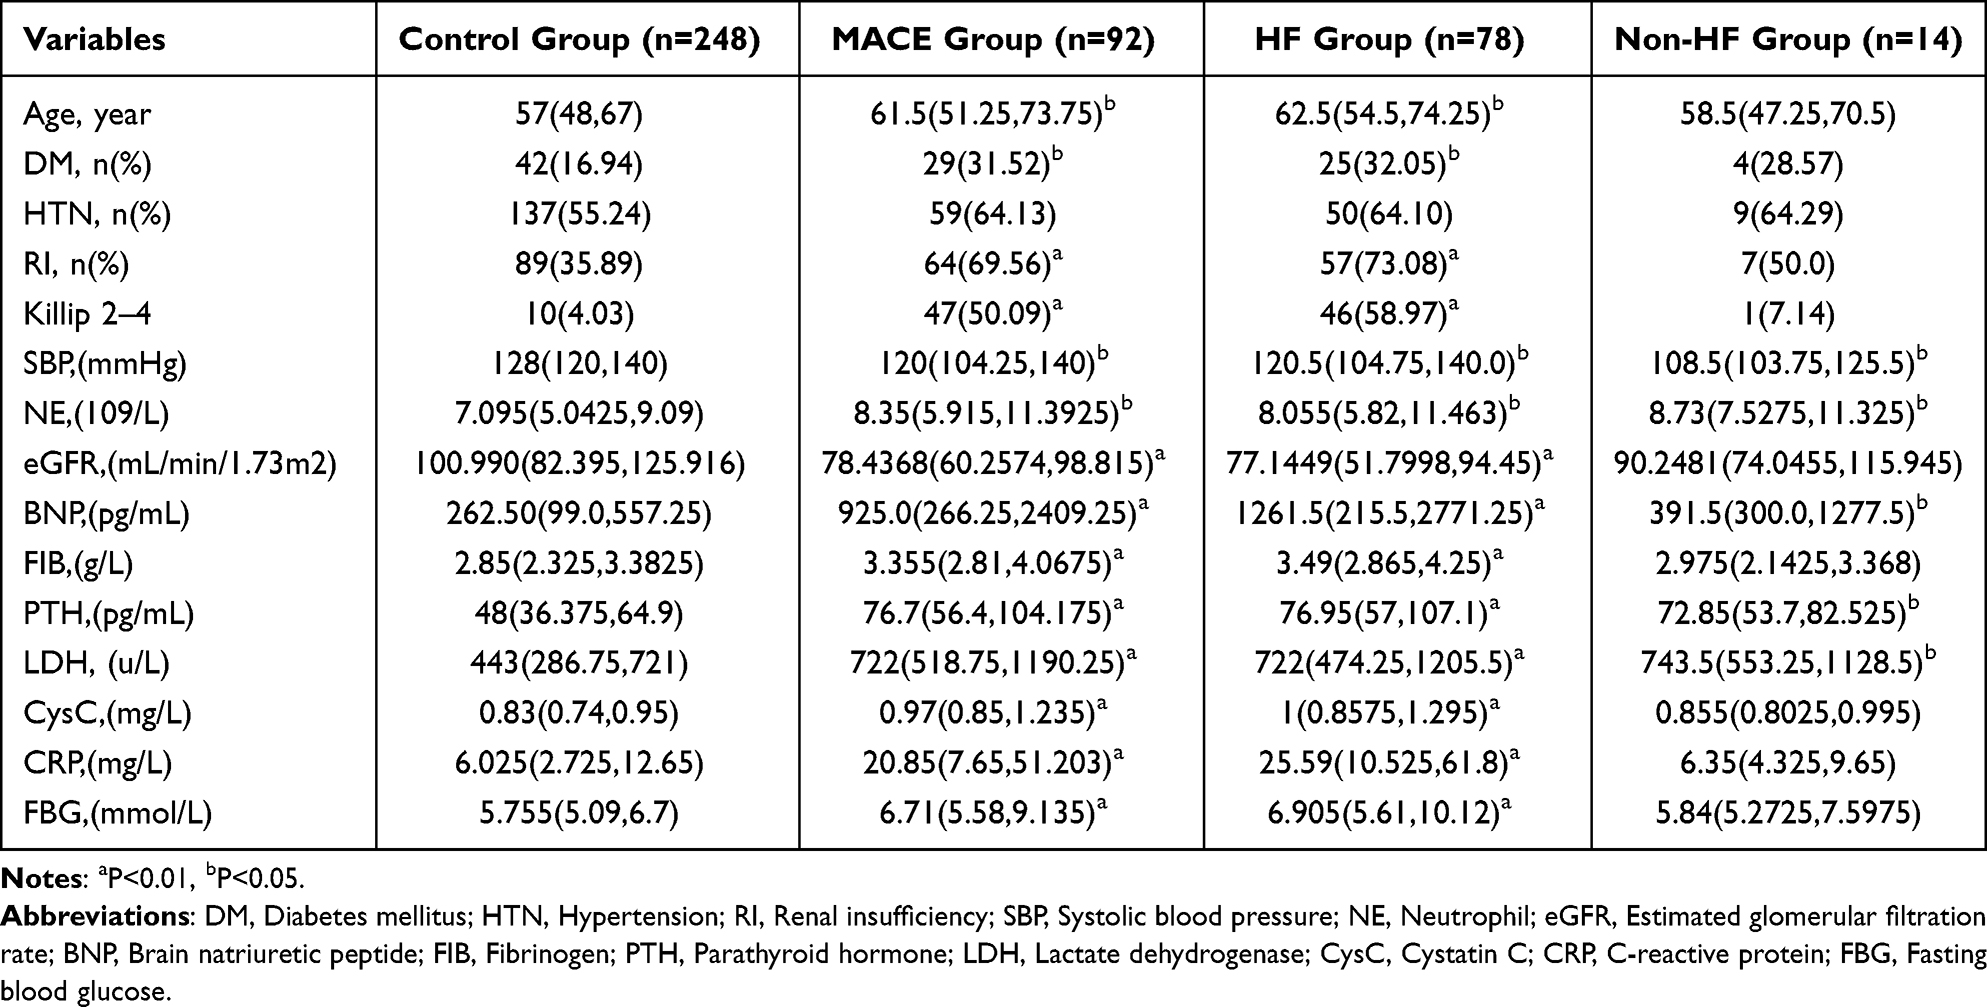 |
Table 2 Comparison of Clinical and Biochemical Data of Hospitalized Patients with Different Outcomes After Emergency PCI |
Univariate and Multifactorial Logistic Regression Analyses
Univariate logistic regression analysis revealed that age, diabetes, renal insufficiency, Killip Class II–IV, SBP, neutrophil count, eGFR, BNP, PTH, LDH, CysC, CRP, FBG, and FIB were factors associated with the occurrence of in-hospital MACE after PCI (P < 0.05, Table 3).
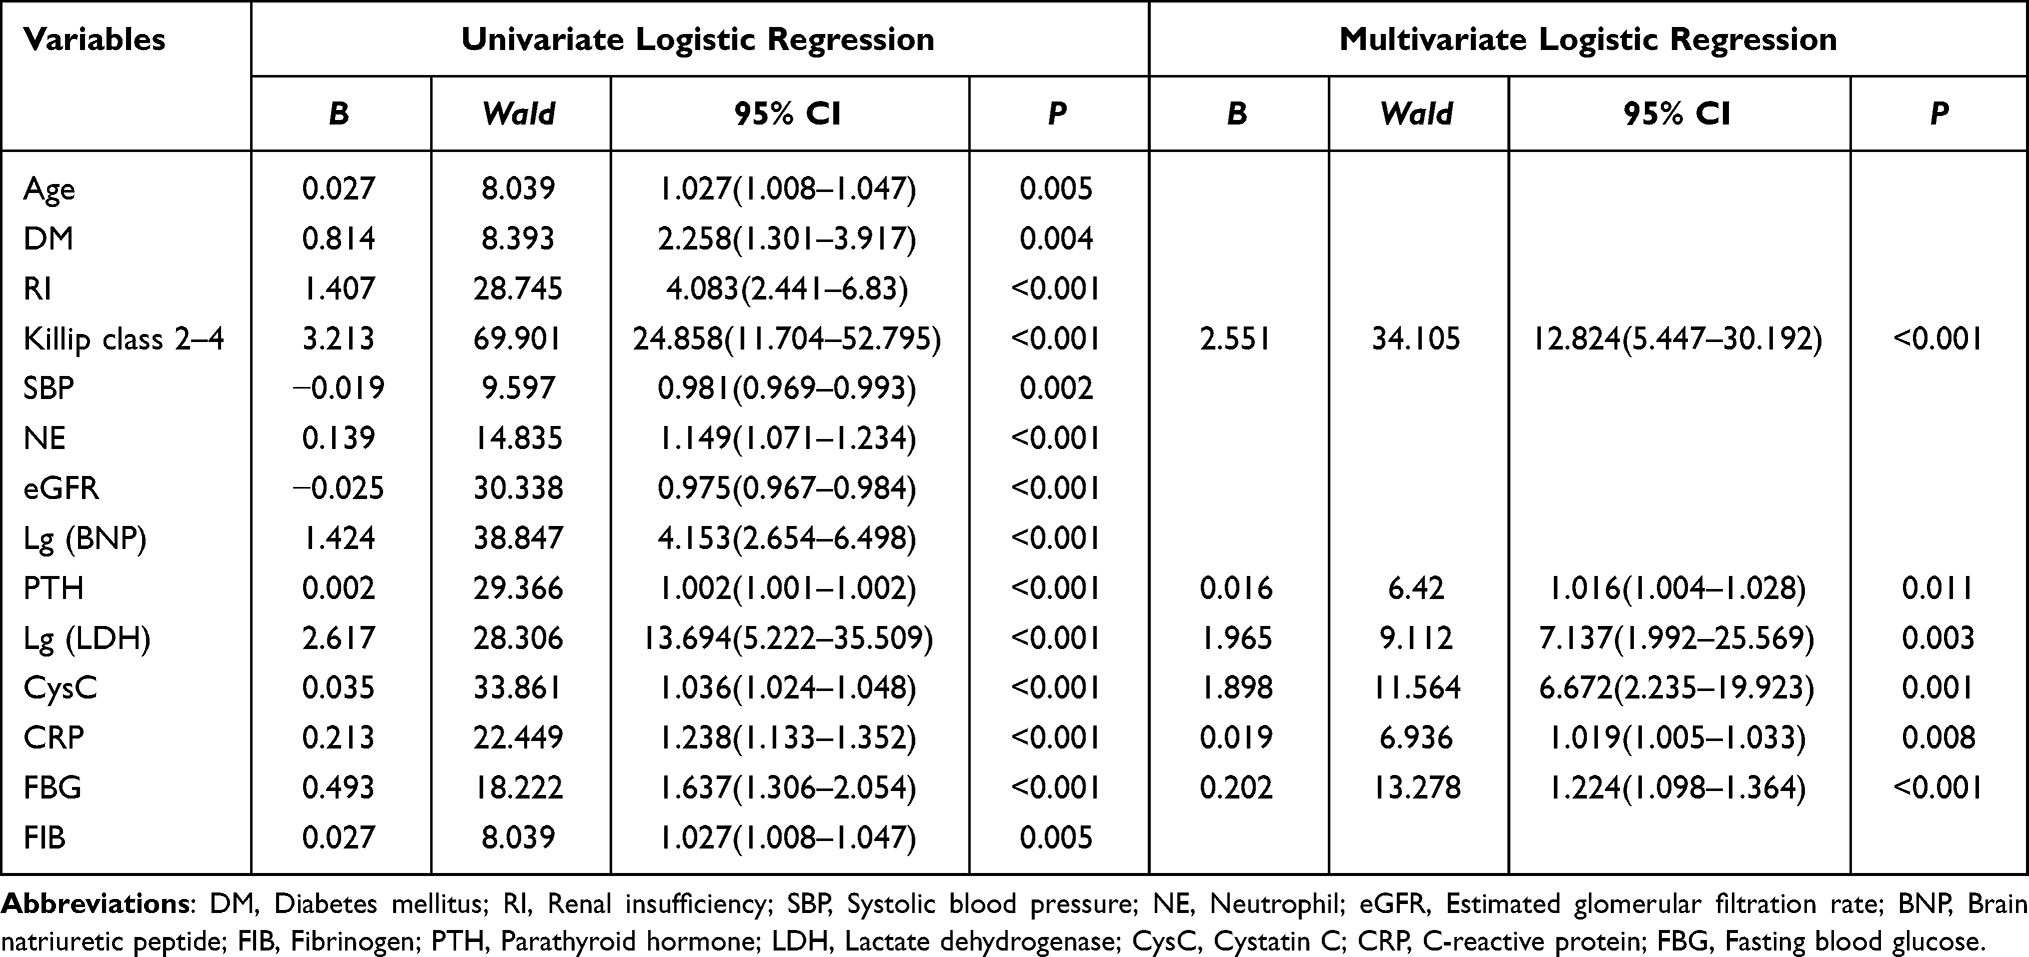 |
Table 3 Univariate and Multivariate Logistic Regression Analysis of in-Hospital Adverse Events After Emergency PCI |
Factors with statistically significant differences (P<0.1) in the results of the univariate logistic regression were further analyzed for collinearity, and the results showed that the variance inflation factors for age, SBP, renal insufficiency, neutrophil count, eGFR, BNP, PTH, LDH, CysC, CRP, FBG, and FIB were <10 and the tolerance was >0.1, suggesting no collinearity among these factors. Thus, they were eligible for inclusion in the multivariable logistic regression analysis. Considering the excessive difference between the highest and lowest values, a Log10 transformation was performed for LDH and BNP levels. Finally, a nomogram was constructed, and the results showed that the PTH level (OR=1.016, 95% CI 1.004–1.028, P=0.011) was independently correlated with in-hospital MACE after PCI (P< 0.05, Table 3).
Construction and Validation of the Nomogram
Based on the results of the LASSO regression and multivariable logistic regression analyses, we selected six variables (including Killip Class II–IV, PTH, LDH, CysC, CRP, and FBG) that were relatively stable in both models to construct the nomogram, aiming to predict the occurrence of in-hospital MACE after PCI (Figure 3). The higher the total score derived from the sum of the assigned points for each variable in the nomogram, the higher the risk of in-hospital MACE after PCI. For example, if the patient was at Killip Class II, and had PTH of 90 pg/mL, lg (LDH) of 2.4, CysC of 1 mg/L, CRP of 60 mg/L, and FBG of 6 mmol/L, the points for each variable would be approximately 55, 27.5, 17.5, 25, 25, and 17.5, respectively, a total score of 167.5 points, indicating that the predicted probability of in-hospital MACE after PCI was approximately 80% (Figure 3).
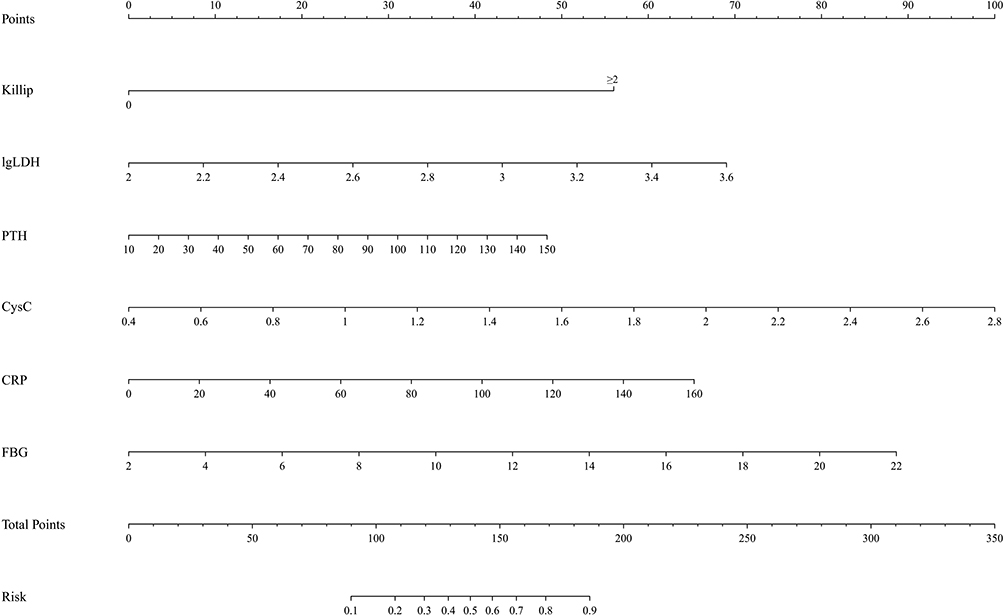 |
Figure 3 Nomogram for predicting the probability of in-hospital MACE after primary PCI. |
The C-index of the prediction model was 0.894 (95% CI 0.854–0.933), which was > 0.85, indicating that the model has a reliable discriminatory ability. Bootstrapping with 1000 replicates was performed to eliminate bias., the C-index of the prediction model was 0.855 and the calibration plot showed slight fluctuations between the prediction curve and the ideal curve (the diagonal line), indicating good calibration of the prediction model and good agreement between the nomogram-predicted and observed probabilities of in-hospital MACE after PCI (Figure 4).
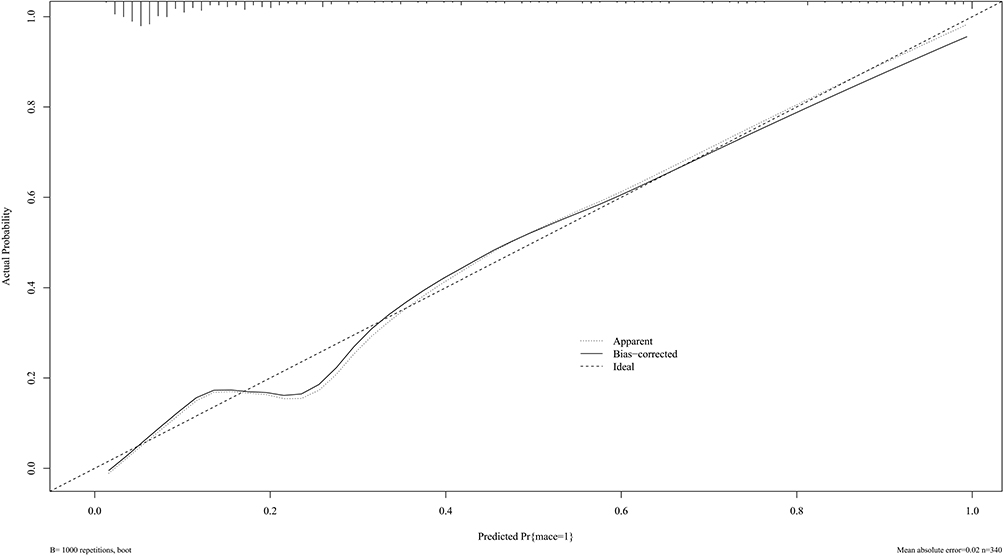 |
Figure 4 Calibration curve for predicting the probability nomogram of in-hospital MACE after primary PCI. The calibration plot shows the agreement between the predicted (x-axis) and observed (y-axis) risks of in-hospital MACE after PCI; the x-axis indicates the predicted risk of in-hospital MACE, and the y-axis indicates the observed risk of in-hospital MACE. Further, the calibration plot shows the predicted risk of in-hospital MACE for primary PCI after bootstrapping with 1000 replicates. The diagonal line indicates that the ideal curve is consistent with the actual curve and the solid line indicates the actual performance of the prediction model. The proximity of the solid line to the dashed diagonal line indicates the accuracy of the prediction model. |
Comparison of the Clinical Performance Between the Nomogram and TIMI Score Using DCA
DCA was used to compare the clinical performance of the nomogram and TIMI scores in this study. Pt is the threshold probability of in-hospital MACE after primary PCI in DCA patients. The DCA revealed that when Pt was > 0, the nomogram model started to gain more net benefits relative to the hypothesis that all patients were negative or positive for in-hospital MACE after primary PCI. The net benefit gained by the nomogram was greater than that of the TIMI score when the Pt ranged between 0 and 0.92. The above results suggest that, compared to the TIMI score, the nomogram has a better net benefit in a larger range of Pt, indicating that the nomogram has some advantages in clinical practice (Figure 5).
 |
Figure 5 DCA of the nomogram model and TIMI score. In the DCA of the nomogram and TIMI score, the y-axis indicates the net benefit, the blue line indicates the nomogram, and the red line indicates the TIMI score. The gray line indicates the hypothesis that all patients who underwent primary PCI had in-hospital MACE, while the black horizontal line indicates the hypothesis that all patients who underwent primary PCI did not have in-hospital MACE. Two competing strategies were tested: (1) prediction of the probability of in-hospital MACE after primary PCI using a TIMI score, and (2) prediction of the probability of in-hospital MACE after primary PCI using a nomogram. The net benefit was obtained by comparing the first strategy with second strategy. As an example, in a population with approximately 250 MACE per 1000 person in hospital, for a decision threshold of 60% hospital risk of death, compared with not using any model the Nomogram model would identify 102 additional true MACE per 1000 subjects, without increasing the number of false positive predictions. Not using a model would assume that all subjects have the same risk and is illustrated by the two alternatives of either assuming all are at low risk or that all are at high risk. The corresponding net benefit of using TIMI score model is 50 additional true deaths. |
Taking the occurrence of adverse events after discharge as the dependent variable and the line chart score as the covariable, the time-dependent ROC curve analysis (Figure 6) was constructed to obtain the ROC curve for predicting the adverse events of emergency PCI patients after discharge. The results suggest that the nomogram score has a certain value in predicting the occurrence of adverse events in emergency PCI patients within 3 years after discharge. The area under the ROC curve for 180 days was 0.659, the CUT off value was 86.29, the specificity was 85.2%, and the sensitivity was 55.2%. Taking the nomogram score 86.29 as the boundary, Kaplan-Meier survival analysis showed that there were significant differences in the risk of adverse events after discharge among patients in different groups (LogRank test, P < 0.05) (Figure 7).
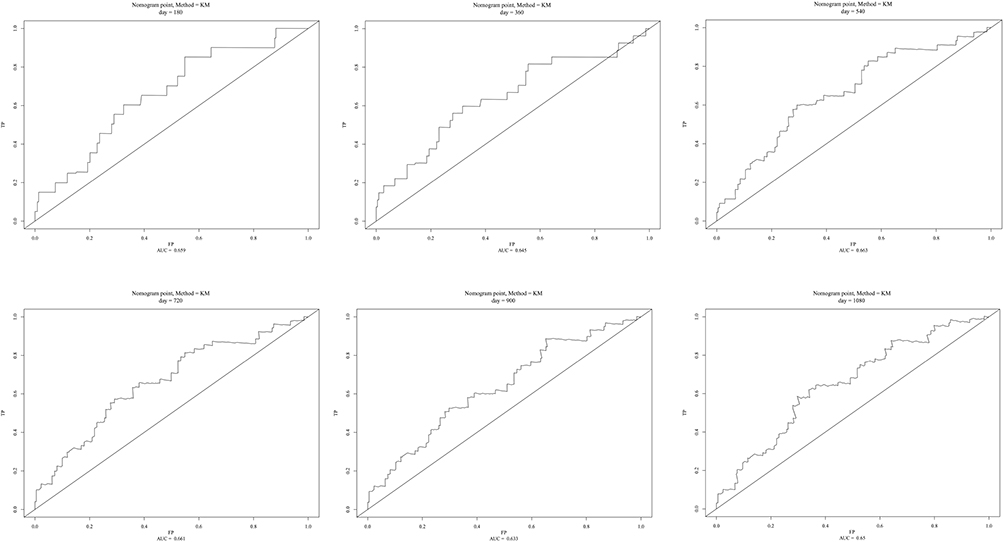 |
Figure 6 Prediction of adverse events in emergency PCI patients after discharge by time-dependent ROC curve. |
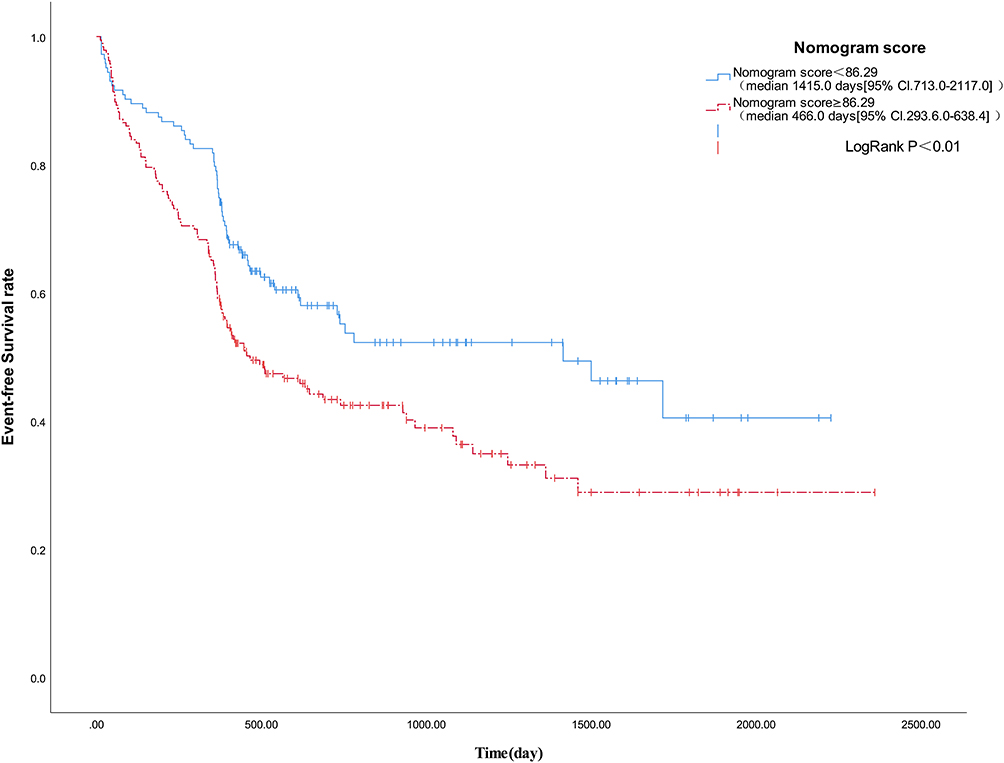 |
Figure 7 Evaluation of event-free survival of emergency PCI patients after discharge by Nomogram score. |
Discussion
Primary PCI has become the main treatment for STEMI and has greatly reduced the overall mortality of AMI; however, MACE still occur frequently during hospitalization, with an in-hospital mortality rate of nearly 3%. Therefore, it is important to predict the occurrence of in-hospital MACE after primary PCI. Modeling studies have assessed the prognosis of myocardial infarction. Quanmei et al constructed a nomogram to predict the occurrence of cardiac MACE after STEMI based on radiological parameters,19,20 and Nan et al developed a risk model to predict in-hospital mortality after primary PCI in patients with STEMI.20 However, these studies were either based on images of patients and complicated modeling, or set a single event as the endpoint, which limited the predictive value of the models. In this study, the nomogram was constructed based on common biochemical and pathophysiological indicators of the patients for predicting in-hospital MACE after PCI. This model included more comprehensive parameters, had a more concise structure, and better operability and reproducibility.
PTH is an independent predictor of CAD21 and hospitalization due to HF.22 Prospective studies have found that increased PTH levels are associated with increased mortality, particularly cardiovascular mortality.23 However, no studies have correlated PTH levels with the occurrence of in-hospital MACE in patients undergoing primary PCI. In our study, we found a significant correlation between PTH levels and the occurrence of in-hospital MACE using the Spearman correlation test, and the ROC curve showed that PTH has some predictive value for the occurrence of in-hospital MACE in patients undergoing primary PCI. The results of the LASSO regression suggest that PTH, CysC, CRP, LDH, FBG, and Killip Class II–IV were independent risk factors for in-hospital MACE after primary PCI. In addition, in the comparison of general information, we found a significantly higher PTH level in patients who developed HF after PCI, which is also consistent with the results of previous studies.
CysC, a member of the superfamily of endogenous cysteine protease inhibitors, is small, can be freely filtered by the glomerulus without being secreted or reabsorbed by renal tubular epithelial cells, and may be a more sensitive marker of renal function than creatinine.24,25 CysC is involved in the development of CAD and has predictive value for CAD prognosis.26,27 Studies have shown that elevated levels of CysC are associated with an increased risk of cardiovascular mortality in the elderly28 and in patients with stable CAD27 or non-STEMI.4 In our study, LASSO regression analysis showed that both CysC and eGFR were independently associated with the occurrence of in-hospital MACE after primary PCI. However, in the results of multivariable logistic regression analysis, eGFR was not an independent risk factor for in-hospital MACE after primary PCI, which may be attributed to the small sample size of the study, with other variables, such as sex, age, and weight influencing eGFR, and the fact that CysC is more sensitive to changes in renal function relative to eGFR. Considering that CysC can reflect renal function to some extent, we selected six parameters, including PTH, CysC, CRP, LDH, FBG, and Killip Class IV, to construct the prediction model.
In patients with myocardial infarction, CRP can deposit in the infarcted region of the myocardium and exert a pro-myocyte necrotic effect.29,30 CRP is also clearly associated with coronary microcirculatory dysfunction (MVD) after AMI, and the development of MVD often suggests poor prognosis after AMI.31 In 2019, Jun et al found that elevated levels of high-sensitivity CRP were significantly associated with the post-PCI incidence of poor outcomes.6 Moreover, LDH can be used as a single protein biomarker for AMI diagnosis.32 High LDH levels in AMI reflect a larger infarct size and, therefore, may predict a poor prognosis.33 In addition, FBG level is an independent predictor of AMI prognosis. Studies have demonstrated that FBG level on admission is also an independent predictor of all-cause mortality after AMI, even after the correction for glycosylated hemoglobin,5 possibly because the levels of FBG after admission in patients with AMI reflect the intensity of stress to some extent, which not only increases insulin resistance but is also related to the levels of adrenaline and cortisol.34 Killip classification is a useful tool for assessing cardiac function in patients with AMI. As reported by Jun et al, Killip classification (Grades II–IV) is an independent risk factor for in-hospital mortality in patients with AMI, and those with Killip Class II–IV have a higher likelihood of cardiogenic shock, HF, and ventricular fibrillation during hospitalization.35 Based on the above results, it could be inferred that PTH, CysC, LDH, CRP, FBG, and Killip class play important roles in assessing in-hospital prognosis in patients with AMI, and our study further confirmed the value of these factors in the prognosis of AMI.
In this study, 63 clinical parameters were analyzed using LASSO regression analysis. Combining the results of LASSO analysis with the previously reported risk factors of in-hospital MACE in AMI patients, a multivariate logistic regression analysis was performed, and a nomogram was constructed with the variables PTH, CysC, LDH, CRP, FBG, and Killip Class II–IV, which perfectly avoided the instability of single models and greatly increased the reliability of the nomogram. In the subsequent test for discrimination, the C-index of the nomogram was 0.894, suggesting excellent discrimination ability, and the calibration plot after bootstrapping with 1000 replicates showed that the predictive curve fluctuated slightly around the ideal curve, indicating that the prediction model had good calibration ability. In addition, DCA was used to compare the clinical utility of the nomogram and the TIMI score, and the results showed that the application value of our nomogram was significantly better than that of the TIMI score system. The above findings suggest that the nomogram is valuable in predicting the occurrence of in-hospital MACE after primary PCI, and can facilitate earlier interventions for patients. In addition, we also use the nomogram score to predict the occurrence of adverse events after discharge. The results of time-dependent ROC curve suggest that the nomogram model has a certain diagnostic efficacy. KM curve analysis showed that there were significant differences in the risk of adverse events after discharge among patients with different nomogram score group, indicating that our nomogram model also has a certain value in predicting the short-term prognosis of patients.
Study Limitations
Previous research has reported that experienced surgeons can effectively reduce perioperative mortality rates.36 Therefore, in our study, all surgeons involved possessed extensive surgical experience in order to minimize the occurrence of adverse events during the perioperative period and reduce any remaining influencing factors as far as possible. Tokarek et al found that performing surgeries during rest time may result in a higher perioperative mortality rate compared to surgeries performed during working hours.37 In our study, eight surgeons took turns on duty, ensuring that all on-duty surgeons received adequate rest during the day to prevent adverse outcomes caused by surgeon-related factors.
This study had some limitations. First, clinical parameters, such as PTH, were sampled only once, without monitoring for their dynamic levels. Moreover, the time intervals between the sampling time and the onset of AMI were also different for each patient owing to the different time intervals between the admission time and the onset of AMI, which may have contributed to some bias in the model. Second, our sample size was relatively small. Multicenter studies with larger sample sizes are necessary to further assess the accuracy of PTH-based nomograms for predicting the occurrence of in-hospital MACE after primary PCI. Finally, because of the small sample size, the nomogram constructed in our study was internally validated without external validation.
Conclusion
For patients with AMI, PTH level on admission is an independent risk factor for in-hospital MACE after primary PCI. The PTH-based nomogram in this study had good discriminative and calibrating abilities in predicting the occurrence of in-hospital MACE after primary PCI, indicating applicative values in clinical practice.
Data Sharing Statement
The datasets used and/or analyzed in this study are available from the corresponding author upon reasonable request.
Ethics Approval and Consent to Participate
The study was approved by the medical ethics committee of The 904th Hospital of the PLA Joint Logistics Support Force (No. 20160102) and conformed to the ethical standards for medical research involving human subjects, as laid out in the 1964 Declaration of Helsinki and its later amendments. All patients signed an informed consent form upon admission, granting permission for their medical data to be used for clinical research purposes. All methods were performed in accordance with the applicable guidelines and regulations.
Author Contributions
All authors made a significant contribution to the work reported, whether that is in the conception, study design, execution, acquisition of data, analysis and interpretation, or in all these areas; took part in drafting, revising or critically reviewing the article; gave final approval of the version to be published; have agreed on the journal to which the article has been submitted; and agree to be accountable for all aspects of the work.
Funding
This study received the support of Grants from the Wuxi Science and Technology Bureau Medical and Public Health Technology Innovation Application Project (N20202035).
Disclosure
The authors declare that they have no competing interests.
References
1. Samsky MD, Morrow DA, Proudfoot AG, Hochman JS, Thiele H, Rao SV. Cardiogenic shock after acute myocardial infarction: a review. JAMA. 2021;326(18):1840–1850.
2. Zhang XF, Hu DY, Ding RJ, Wang HC, Yan LX. Status and trend of cardio-cerebral-vascular diseases mortality in China: data from national disease surveillance system between 2004 and 2008. Zhonghua xin xue guan bing za zhi. 2012;40(3):179–187.
3. Li J, Li X, Wang Q, et al. ST-segment elevation myocardial infarction in China from 2001 to 2011 (the China PEACE-Retrospective Acute Myocardial Infarction Study): a retrospective analysis of hospital data. Lancet. 2015;385(9966):441–451.
4. Flores-Blanco PJ, López-Cuenca Á, Januzzi JL, et al. Comparison of Risk Prediction With the CKD-EPI and MDRD Equations in Non-ST-Segment Elevation Acute Coronary Syndrome. Clin Cardiol. 2016;39(9):507–515.
5. Hadjadj S, Coisne D, Mauco G, et al. Prognostic value of admission plasma glucose and HbA in acute myocardial infarction. Diabet Med. 2004;21(4):305–310.
6. Shitara J, Ogita M, Wada H, et al. Clinical impact of high-sensitivity C-reactive protein during follow-up on long-term adverse clinical outcomes in patients with coronary artery disease treated with percutaneous coronary intervention. J Cardiol. 2019;73(1):45–50.
7. Grønhøj MH, Gerke O, Mickley H, et al. Associations between calcium-phosphate metabolism and coronary artery calcification; a cross sectional study of a middle-aged general population. Atherosclerosis. 2016;251:101–108.
8. Kestenbaum B, Katz R, de Boer I, et al. Vitamin D, parathyroid hormone, and cardiovascular events among older adults. J Am Coll Cardiol. 2011;58(14):1433–1441.
9. Anderson JL, Vanwoerkom RC, Horne BD, et al. Parathyroid hormone, vitamin D, renal dysfunction, and cardiovascular disease: dependent or independent risk factors? Am Heart J. 2011;162(2):331–339.e332.
10. Gutiérrez-Landaluce C, Aceña Á, Pello A, et al. Parathormone levels add prognostic ability to N-terminal pro-brain natriuretic peptide in stable coronary patients. ESC Heart Failure. 2021;8(4):2713–2722.
11. Ibanez B, James S, Agewall S, et al. 2017 ESC Guidelines for the management of acute myocardial infarction in patients presenting with ST-segment elevation: the Task Force for the management of acute myocardial infarction in patients presenting with ST-segment elevation of the European Society of Cardiology (ESC). Eur Heart J. 2018;39(2):119–177.
12. Kolh P, Windecker S. ESC/EACTS myocardial revascularization guidelines 2014. Eur Heart J. 2014;35(46):3235–3236.
13. Morrow DA, Antman EM, Charlesworth A, et al. TIMI risk score for ST-elevation myocardial infarction: a convenient, bedside, clinical score for risk assessment at presentation: an intravenous nPA for treatment of infarcting myocardium early II trial substudy. Circulation. 2000;102(17):2031–2037.
14. Killip T, Kimball JT. Treatment of myocardial infarction in a coronary care unit. A two year experience with 250 patients. Am J Cardiol. 1967;20(4):457–464.
15. Kozuch M, Kralisz P, Korecki J, et al. Early and long-term prognosis of patients with coronary artery disease treated with percutaneous coronary interventions in 2005. Experience of single large-volume PCI center. Adv Med Sci. 2011;56(2):222–230.
16. Lin MJ, Yang WC, Chen CY, et al. Hypertension and chronic kidney disease affect long-term outcomes in patients with stable coronary artery disease receiving percutaneous coronary intervention. Sci Rep. 2018;8(1):17673.
17. Zhang L, Xu C, Liu J, et al. Baseline plasma fibrinogen is associated with haemoglobin A1c and 2-year major adverse cardiovascular events following percutaneous coronary intervention in patients with acute coronary syndrome: a single-centre, prospective cohort study. Cardiovasc Diabetol. 2019;18(1):52.
18. Sheng J, Liu N, He F, Cheng C, Shen S, Sun Y. Changes in the neutrophil-to-lymphocyte and platelet-to-lymphocyte ratios before and after percutaneous coronary intervention and their impact on the prognosis of patients with acute coronary syndrome. Clinics. 2021;76:e2580.
19. Ma Q, Ma Y, Wang X, et al. A radiomic nomogram for prediction of major adverse cardiac events in ST-segment elevation myocardial infarction. Eur Radiol. 2021;31(2):1140–1150.
20. Gao N, Qi X, Dang Y, et al. Establishment and validation of a risk model for prediction of in-hospital mortality in patients with acute ST-elevation myocardial infarction after primary PCI. BMC Cardiovasc Disord. 2020;20(1):513.
21. Kamycheva E, Sundsfjord J, Jorde R. Serum parathyroid hormone levels predict coronary heart disease: the Tromsø Study. Eur j Cardiovascular Prevention Rehabilitation. 2004;11(1):69–74.
22. Sugimoto T, Tanigawa T, Onishi K, et al. Serum intact parathyroid hormone levels predict hospitalisation for heart failure. Heart. 2009;95(5):395–398.
23. Schierbeck LL, Jensen TS, Bang U, Jensen G, Køber L, Jensen JE. Parathyroid hormone and vitamin D--markers for cardiovascular and all cause mortality in heart failure. Eur J Heart Fail. 2011;13(6):626–632.
24. Ix JH, Shlipak MG, Chertow GM, Whooley MA. Association of cystatin C with mortality, cardiovascular events, and incident heart failure among persons with coronary heart disease: data from the Heart and Soul Study. Circulation. 2007;115(2):173–179.
25. Royakkers AA, Korevaar JC, van Suijlen JD, et al. Serum and urine cystatin C are poor biomarkers for acute kidney injury and renal replacement therapy. Intensive Care Med. 2011;37(3):493–501.
26. Keller T, Messow CM, Lubos E, et al. Cystatin C and cardiovascular mortality in patients with coronary artery disease and normal or mildly reduced kidney function: results from the AtheroGene study. Eur Heart J. 2009;30(3):314–320.
27. Dupont M, Wu Y, Hazen SL, Tang WH. Cystatin C identifies patients with stable chronic heart failure at increased risk for adverse cardiovascular events. Circ Heart Fail. 2012;5(5):602–609.
28. Malmgren L, McGuigan FE, Christensson A, Akesson KE. Longitudinal Changes in Kidney Function Estimated from Cystatin C and Its Association with Mortality in Elderly Women. Nephron. 2020;144(6):290–298.
29. Barrett TD, Hennan JK, Marks RM, Lucchesi BR. C-reactive-protein-associated increase in myocardial infarct size after ischemia/reperfusion. J Pharmacol Exp Ther. 2002;303(3):1007–1013.
30. Griselli M, Herbert J, Hutchinson WL, et al. C-reactive protein and complement are important mediators of tissue damage in acute myocardial infarction. J Exp Med. 1999;190(12):1733–1740.
31. Tong DC, Whitbourn R, MacIsaac A, et al. High-Sensitivity C-Reactive Protein Is a Predictor of Coronary Microvascular Dysfunction in Patients with Ischemic Heart Disease. Front Cardiovascular Med. 2017;4:81.
32. Mazhar F, Tariq SR, Bashir F. Age- and gender-based studies of trace metal levels and various enzymes associated with myocardial infarction. Biol Trace Elem Res. 2011;140(2):139–150.
33. Chareonthaitawee P, Christian TF, Hirose K, Gibbons RJ, Rumberger JA. Relation of initial infarct size to extent of left ventricular remodeling in the year after acute myocardial infarction. J Am Coll Cardiol. 1995;25(3):567–573.
34. van der Horst IC, Nijsten MW, Vogelzang M, Zijlstra F. Persistent hyperglycemia is an independent predictor of outcome in acute myocardial infarction. Cardiovasc Diabetol. 2007;6:2.
35. Shiraishi J, Kohno Y, Nakamura T, et al. Predictors of in-hospital outcomes after primary percutaneous coronary intervention for acute myocardial infarction in patients with a high Killip class. Internal Med. 2014;53(9):933–939.
36. Zabojszcz M, Januszek R, Siudak Z, et al. Association between the mortality rate and operator volume in patients undergoing emergency or elective percutaneous coronary interventions. Kardiol Pol. 2020;78(2):138–146.
37. Tokarek T, Dziewierz A, Plens K, et al. Percutaneous coronary intervention during on- and off-hours in patients with ST-segment elevation myocardial infarction. Hellenic j Cardiol. 2021;62(3):212–218.
 © 2023 The Author(s). This work is published and licensed by Dove Medical Press Limited. The
full terms of this license are available at https://www.dovepress.com/terms
and incorporate the Creative Commons Attribution
- Non Commercial (unported, 3.0) License.
By accessing the work you hereby accept the Terms. Non-commercial uses of the work are permitted
without any further permission from Dove Medical Press Limited, provided the work is properly
attributed. For permission for commercial use of this work, please see paragraphs 4.2 and 5 of our Terms.
© 2023 The Author(s). This work is published and licensed by Dove Medical Press Limited. The
full terms of this license are available at https://www.dovepress.com/terms
and incorporate the Creative Commons Attribution
- Non Commercial (unported, 3.0) License.
By accessing the work you hereby accept the Terms. Non-commercial uses of the work are permitted
without any further permission from Dove Medical Press Limited, provided the work is properly
attributed. For permission for commercial use of this work, please see paragraphs 4.2 and 5 of our Terms.