Back to Journals » Psychology Research and Behavior Management » Volume 16
Psychometric Properties and Factor Structure of the Spanish Version of Technostress Scale (RED/TIC) in Ecuadorian Teachers During the COVID-19 Pandemic
Authors Ortega-Jiménez D ![]() , López-Guerra VM
, López-Guerra VM ![]() , Ramírez MDR, Angelucci LT
, Ramírez MDR, Angelucci LT ![]()
Received 18 August 2023
Accepted for publication 26 November 2023
Published 8 December 2023 Volume 2023:16 Pages 4973—4987
DOI https://doi.org/10.2147/PRBM.S436047
Checked for plagiarism Yes
Review by Single anonymous peer review
Peer reviewer comments 3
Editor who approved publication: Dr Igor Elman
David Ortega-Jiménez,1 Victor Manuel López-Guerra,1 Marina del Rocío Ramírez,1 Luisa T Angelucci2
1Department of Psychology, Universidad Técnica Particular de Loja, Loja, Ecuador; 2Faculty of Humanities and Education, Universidad Católica Andrés Bello, Caracas, Venezuela
Correspondence: David Ortega-Jiménez, Department of Psychology, Universidad Técnica Particular de Loja (UTPL), Loja, 110107, Ecuador, Tel +593 988 888 784, Fax +593 07 370 1444, Email [email protected]
Background: Although the use of technology is a trend, since the COVID-19 pandemic, its use has been exacerbated, especially in educational processes, causing techno-stress among teachers.
Purpose: In order to contribute to the lack of validated and adapted instruments in Latin America, this study aimed to analyze the psychometric properties and factorial structure of the Spanish version of the technostress scale in a large sample of Ecuadorian teachers.
Methods: A non-probabilistic intentional sample of 2850 teachers (mean age 40 years, SD= 9.65; 65% female) from various schools throughout the Ecuadorian territory was surveyed online using a cross-sectional design. Data analysis included exploratory (EFA) and confirmatory factor analysis (CFA), factorial invariance, assessment of internal consistency, sex differences in technostress scale scores and convergent validity.
Results: The EFA yielded a structure of four factors: skepticism, fatigue, anxiety and inefficiency. Through CFA, the hierarchical model that included a general factor and four nested factors had a better fit, and that model remained invariant across sex, age and public and private institutions. Total omega value (ω) was 0.962 for the total scale and hierarchical omega values (ωh) were 0.886 for the general factor, as well as 0.30, 0.22, 0.12 and 0.21 for the respective nested factors (skepticism, fatigue, anxiety and inefficiency). Moreover, the Resources, Experiences, Demands for Information and Communication Technologies (RED/TIC) scores were significantly higher among women, although effect sizes of comparison of those sex differences were very small. Finally, the RED/TIC scores correlated with the Depression, Anxiety and Stress Scale (DASS-21).
Conclusion: The RED/TIC scale has adequate psychometric properties in primary and high school teachers, and its use in that population is supported, which provides a valuable tool for the evaluation and detection of technostress in teachers and facilitates the investigation of this multifactorial phenomenon in Latin America.
Keywords: psychometric properties, factor structure, technostress, teachers, Ecuador
Introduction
The use of Information and Communication Technologies (ICTs) in today’s world is practically an obligatory conduct, due to their accelerated progress and the ground they have gained in almost all areas of life (communication, education, health, economy, recreation).1
In recent years, in the context of the pandemic, the use of technology has been inevitable, evidencing an increase in teleworking, which can be defined as work carried out outside the workplace (remotely) and with the use of modern communication technologies.2 Different studies indicate that teleworking represents a risk of stress, since it favors competition between work and home and also requires concentration and perseverance under pressure conditions. Then, there could be possible adverse consequences for the well-being of people and psychological and physical alterations.3,4
The report from the Institute for Occupational Safety, Health and Well-being of Spain5 provides results of a study on the manifestations of techno-stress and its possible consequences on the occupational health of workers from countries in the Hispanic world. The results indicate that between 64% and 68% present problems to work well with ICTs, even being forced to take a break from the activities of their position to attend to the technical difficulties they encounter. In addition, 20% say they feel exhausted always or frequently after making use of these technologies.
The same report indicates that a large part of the workers surveyed (45%) do not have specific training for the use of ICTs and consider that working through them means a challenge with different demands (working for longer periods of time, remembering many things, risking being wrong, performing repetitive actions, handling a large amount of information). Over time, these demands can become the reasons for techno-stress or techno-fatigue.5
One of the groups that was affected by teleworking was that of teachers, who had to quickly adjust their study plans and learn to use technology to teach their classes and evaluate their students. They were also often forced to implement methodologies based on ICTs under the guidelines of their respective organizations and increase their work activities even during vacations.6,7 The integration of ICTs in teaching functions has implied a transformation in the way of organizing their work, all of which has resulted in different psychological effects, among which depression, anxiety and stress stand out.8,9
The increase in the levels of stress and anxiety in teachers linked to the use of technology has been associated with what is known as techno-stress. This phenomenon has been evidenced in different parts of the world and in Latin American countries such as Mexico,10 Chile11 Ecuador,12 Colombia13 and Peru.14
The first approximation to the term technostress was the one proposed by Brod,15 defining it as an adaptation disease derived from the lack of ability to deal with new technologies in a healthy way. Later, Weil and Rosen16 defined it as the negative impact on attitudes, behaviors or thoughts, being a direct or indirect product of the use of technologies.
Salanova et al17 proposed a concept of the techno-stress experience as
A negative psychological state associated with the use or threat of use of ICTs in the future. This experience is related to feelings of anxiety, mental fatigue, skepticism and inefficiency (p. 9).
Technology anxiety has been used as a term to describe the fear, apprehension and agitation that people experience when interacting with technology. Fatigue refers to performing an activity to a greater extent than usual, resulting in a decrease in energy. Skepticism is defined as the manifestation of indifferent, distant and detached attitudes towards the use of ICTs. For its part, inefficiency is a cognitive component of techno-effort and refers to the level of inefficiency perceived from its use.18
On the other hand, Wang et al19 defined techno-stress as the discomfort, fear, tension and anxiety experienced when learning and using technology directly or indirectly, which ultimately ends in psychological and emotional problems that prevent further learning or using information technology. Lei and Ngai20 affirmed that it is a state of mental or physiological stimulation derived from the use of ICTs for work purposes and is generally related to an increase in work overload, accelerated pace and, in some way, personal carelessness.
Technostress has been related to loneliness and depression,21 as well as behavioral problems. In addition, among the consequences of technostress are psychosomatic complaints (sleep disturbances, headaches, gastrointestinal problems, muscle pain) and work effects (absenteeism, performance failures), which could even develop burnout.22
In the educational field, it is recognized that the use of ICTs provides both students and teachers with learning environments that allow them to manage a large number of resources to take advantage of information.23 However, when attention is placed on the psychological impact that the repeated use of ICTs can lead to, there is evidence that it can be associated with performance problems, impaired concentration, decreased well-being,24 skepticism, work fatigue, anxiety. In addition, it can influence their quality of life, family dynamics, interpersonal relationships at work and in society.25,26
It is important to point out that the techno-stress of teachers can be increased due to the lack of effective strategies to improve how adequately and timely teachers respond to emerging changes, such as a well-equipped work environment with didactic resources, good internet, perception of self-efficacy, flexibility, among others.27,28 In this sense, it has been shown that coping strategies focused on the problem and emotion, such as seeking support or distancing from ICTs, have been the most used to reduce levels of techno-stress.29
Given the current validity of the phenomenon, one of the aspects that needs to be investigated in the study of techno-stress is its measurement. In this regard, various instruments for measuring techno-stress have been created, among which can be mentioned the Computer Anxiety Rating Scale (CARS-C) that measures anxiety towards technology, the General Attitudes Toward Computers Scale (GATCS-C) that evaluates a series of attitudes towards computers and technology, the Computer Thoughts Survey (CTS-C), which assesses specific thoughts that people have when working with technology,30,31 the Computer Technology Hassles Scale and the Computer Hassles Scale that evaluate the damage produced by the use of technologies,32,33 the Technostress Inhibitors scale that measures the organizational mechanisms that reduce stress due to the use of ICT.34 More recently, the Technostress Creators scale assesses factors that create stress due to the use of technology.35
The previously mentioned instruments are mostly for English-speaking people, while for Spanish-speaking people the test Resources Experiences Demands for Information and Communication Technologies (RED/TIC, acronym in Spanish) has been used. It is a useful and simple instrument to assess techno-stress that was prepared by Salanova et al17 as part of the WONT Psychosocial Prevention Research team at Unsiversitat Jaume I in Castellón, Spain. The original test measures four dimensions (skepticism, fatigue, anxiety, and inefficiency) that aim to assess psychosocial risks and harm based on the RED Model (Resources-Emotions-Demands).22 The original 16-item instrument presented a first-order factorial structure of four factors and adequate internal consistency through Cronbach’s alpha in each of its subscales: fatigue (α = 0.92), anxiety (α = 0.83), skepticism (α = 0.93), inefficiency (α = 0.84).
There are few validations carried out on the RED/TIC scale, but it is worth mentioning the one carried out by Carlotto and Gonçalves.36 They adapted and translated the original instrument of 16 items into Portuguese, working with a sample of 368 Brazilian workers who used ICTs. Also, they carried out a Confirmatory Factor Analysis (CFA), and a factorial structure was evidenced adjusting to the four-factor model proposed by the original authors.22 In addition, these factors showed a Cronbach’s alpha greater than 0.70, demonstrating that RED/TIC is a valid and reliable instrument for the Brazilian population.
Despite having been used in the Spanish and Brazilian population, no studies were found in Ecuador or in other Latin American countries that adapt and verify the psychometric properties of the RED/TIC scale. Ecuador does not escape the global trend of the use of ICTs, since in the country distance education and teleworking are modalities that increased during the pandemic. However, they have gained momentum and their tendency is to be maintained over time, which requires a constant update by the teacher regarding the management of technology. This is a practice that brings a series of consequences that must be prevented and addressed once they occur.
Based on what has been said previously, it is imperative to use an instrument with cultural relevance, validity and reliability in the Ecuadorian teaching population, and that allows the evaluation of techno-stress and can provide information to prevent it or, if required, to intervene. From this need arises the objective of studying the psychometric properties and factorial structure of the RED/TIC scale, which has proven to be brief and useful in different fields.36,37
Materials and Methods
Participants
A nonprobabilistic and intentional sample of 3432 Ecuadorian teachers from primary and secondary school were invited by email or mobile phone to participate in the study, and they then completed a computerized survey. Then, 584 out of 3432 participants were deleted due to missing data. Therefore, the analyzed sample was composed of 2850 teachers, and the participants’ demographic data are described in Table 1.
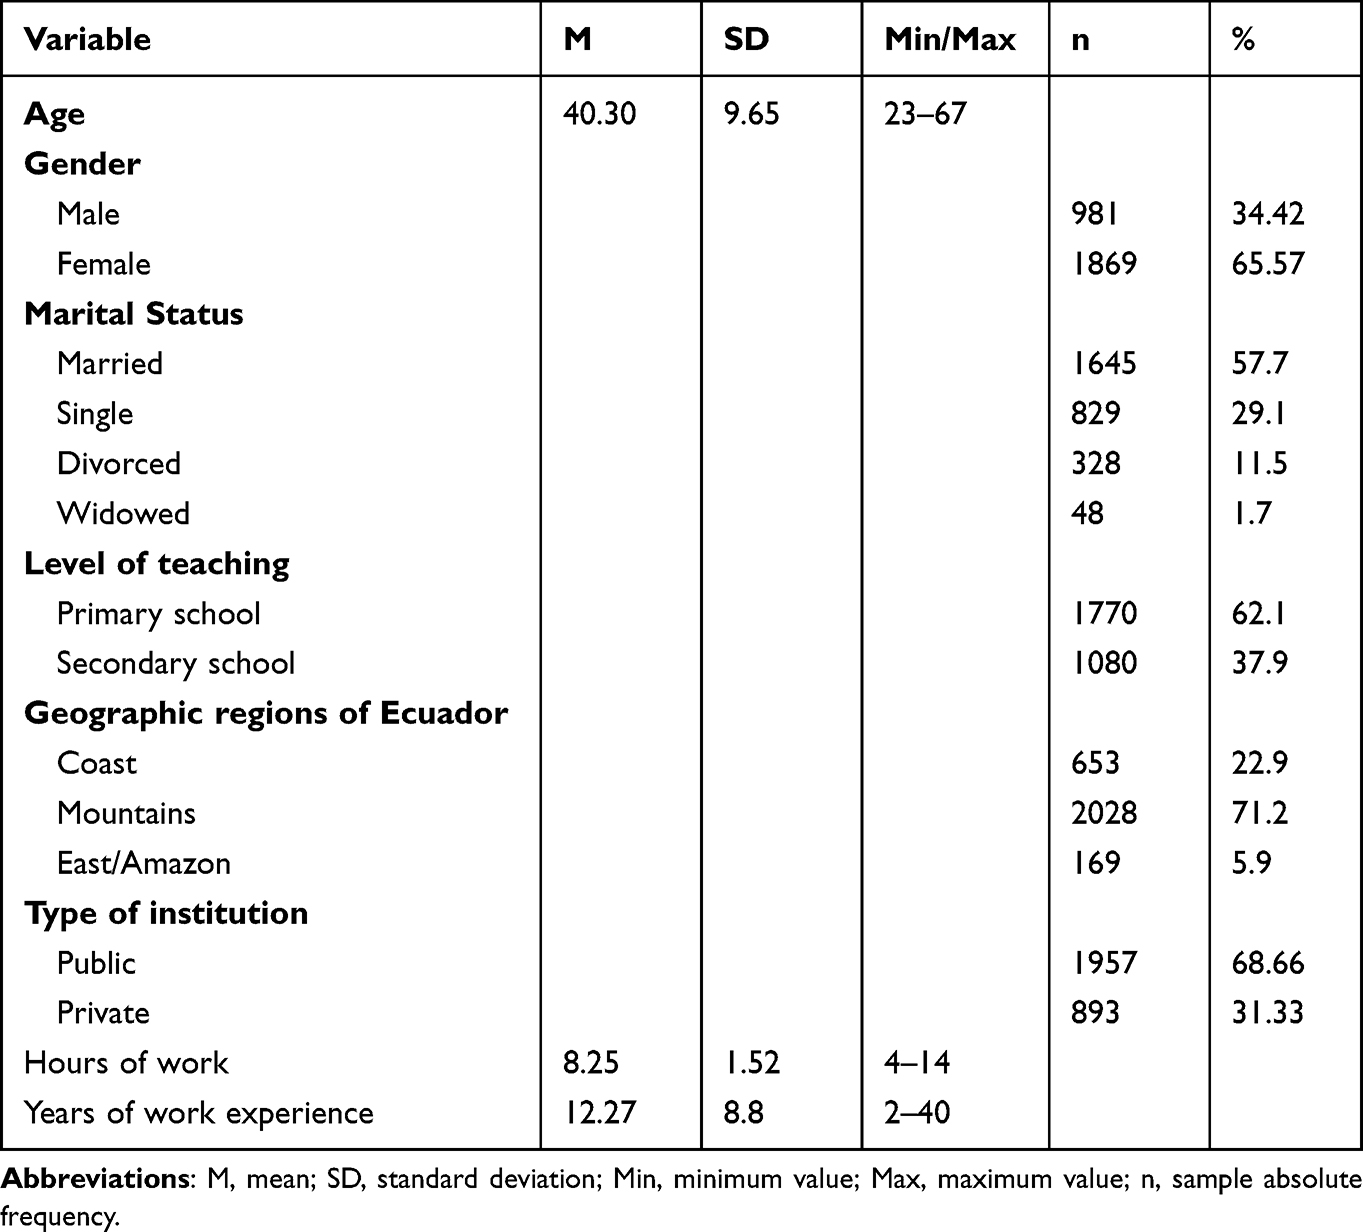 |
Table 1 Participants’ Demographics |
Measurement Instruments
Sociodemographic data. This section included information regarding basic sociodemographic data, such as age, sex, marital status and employment status.
The Technostress Questionnaire by Salanova and others,22 to assess technostress. It is self-administered with 16 items, with 4 subscales: skepticism (items 1, 2, 3 and 4), fatigue (items 5, 6, 7 and 8), anxiety (items 9, 10, 11 and 12), inefficiency (items 13, 14, 15 and 16). The range of scores for each of the items ranges from 0 (not at all/never) to 6 (always/ every day), with high scores indicating the presence of technostress. An example of one of the items is the following: “with the passage of time, technologies interest me less and less”. The original scale presents a structure of four first-order factors (skepticism, fatigue, anxiety, inefficiency) each with an optimal internal consistency (Cronbach’s alpha) of: skepticism (α = 0.93), fatigue (α = 0.92), anxiety (α = 0.83) and inefficiency (α = 0.84).22 Furthermore, this instrument has a total internal consistency of α = 0.70.37
The Depression, Anxiety and Stress Scale [DASS-21]38 is a self-administered instrument consisting of 21 items and three subscales: anxiety evaluates situational anxiety and the subjective experience of anxious affect (items 2, 4, 7, 9, 15, 19 and 20), depression evaluates dysphoria, hopelessness, devaluation of life, self-depreciation, lack of motivation and inertia (items 3, 5, 10, 13, 16, 17 and 21), and stress evaluates difficulty relaxing, nervous excitement, ease of getting upset or irritated (items 1, 6, 8, 11, 12, 14 and 18). The items are answered on a Likert-type scale with a response range from 0 to 3 that goes from “not at all applicable to me” to “very applicable to me”, where a higher score indicates a greater presence of symptoms. An example of a question is the following: “I had a hard time relaxing”. Studies reaffirm the structure of three factors of the scale with excellent validity and reliability. Cronbach’s alpha was between α = 0.70 to α = 0.93 for the total test, while its dimensions present the following values: depression α = 0.88 to α = 0.93, anxiety α = 0.88 to α = 0.92, stress α = 0.89 to α = 0.92.39–41
Design and Procedure
A cross-sectional study was conducted. The data collection was carried out for 8 weeks between the months of October and November 2022. The average duration of the application was 30 minutes, and 71 educational institutions nationwide participated. The teachers were sent, by email or mobile phone, a link for an online survey on SurveyMonkey that allowed them access to the informed consent form and the objectives of the study. The study was approved by the Ethics Committee for Research in Human Beings (Comité de Ética de Investigación en Seres Humanos of the Technical Particular University of Loja, Ecuador, UTPL-CEISH, 4 of January 2022-Oficio-CEISH-01-2022), and conducted according to the principles expressed in the Declaration of Helsinki (World Medical Association [WMA], 2013).42 All participants provided individual consent to voluntarily participate in the study and received no economic compensation for their participation.
Statistical Analysis
The statistical analyses were carried out using the IBM Statistical Package for the Social Sciences (SPSS) software (IBM Inc., Chicago, IL, EE.UU.; version 26.0), AMOS version 25.0 (IBM Inc., Armonk, NY, United States), Computer Software Jamovi version 2.3.24 and Bifactor Indices Calculator: A Microsoft Excel-Based tool to calculate various indices relevant to bifactor CFA models.43
Firstly, a descriptive analysis (mean [M] and standard deviation [S]) of the teachers’ responses to the four factors of the techno-stress scale was performed.
Secondly, the factorial structure was analyzed by performing an exploratory (EFA) and confirmatory (CFA) analysis. Following the recommendation of Harrington44 that indicates that, to obtain the factorial structure, both the EFA and the CFA must be performed in different samples, the total sample (N= 2850) was divided into two homogeneous independent random subsamples (nA=1425) and (nB=1425). The chi-square statistical test did not reveal significant differences in both subsamples, so the random selection helped maintain the same proportion of sociodemographic characteristics in each one of them. The first subsample (nA) was used to perform an EFA in order to determine the adequacy of factorial loading on each item of the RED/TIC scale. Additionally, the adequacy of matrix to perform the EFA was tested using the Kaiser-Meyer-Olkin (KMO) test and Bartlett´s test of sphericity. For the EFA, the maximum likelihood method was used in combination with oblimin rotation, retaining factor loads greater than 0.30 in the rotated matrix. The common practice is to retain factor loadings above 0.30 or 0.40.45 The second subsample (nB) was used to perform a CFA. The selected indices to assess the goodness of fit of the CFA were the chi ratio squared (χ2) by degrees of freedom (CMIN/DF), the Bentler comparative fit index (CFI), the Tucker-Lewis index (TLI), the standardized root mean squared residual (SRMR), the root mean square error of approximation (RMSEA), the Akaike information criterion (AIC), and the Bayesian information criterion (BIC). Good fitness of the model was tested using the following indices: CMIN/DF ≤ 3 is adequate, ≥ 2 is optimal;46 CFI and TLI ≥ 0.90 is adequate, ≥ 0.95 is optimal; RMSEA and the SRMR ≤ 0.08 is adequate, ≤ 0.05 is optimal.47 AIC and BIC were used to evaluate alternative models with the smaller value in each case indicating the best fitting model.46
In order to assess the hierarchical model, additional statistical measures, such as Explained Common Variance (ECV), Percentage of Uncontaminated Correlations (PUC), replicability construct using H coefficient, omega coefficient (ω), and hierarchical omega coefficient (ωh), should be considered. Values greater than 0.70 for ECV and PUC support an essentially unidimensional structure of RED/TIC scale.48 Moreover, values included in the range 0.30–0.70 for the ωh, H and ECV indices reflect a substantive contribution of the factors or dimensions in explaining the construct variance. Those values being lower than 0.30 indicates a poor contribution, and those values being greater than 0.70 indicates an excessive contribution.49
Thirdly, we assessed the factorial invariance of the RED/TIC across the second subsample (nB), taking into account the following models: configural invariance (Model configural, MC), which indicates a factorial structure without restrictions (baseline); metric invariance (Model metric, MM), where equivalence restrictions are established between factor loads; scalar invariance (Model Scalar, SC), that is, load and intercept equivalence restrictions; and strict invariance (Model Strict, ST), which takes into account the equivalence restrictions of factor loads, intercepts, and residuals. Invariance tests for gender, age (< 38 or > 38 years old, that is, the median of the sample) and type of school (public or private) were only planned for the best fitting model. We assessed the measurement invariance and its levels in accordance with the recommendations of Cheung and Rensvold (2002):50 ΔCFI ≤ 0.01 and ΔRMSEA ≤ 0.015.
Fourthly, a multivariate analysis of variance (MANOVA) test was developed, offering the advantage of reducing type I error by assessing the sex differences of all items in the same analysis and control the effects of age throughout the covariance analysis. Effect sizes of principal comparisons of sex differences were calculated using eta squared (η2), taking into account values for small (0.01–0.05), medium (0.06–0.13) and large (0.14) effects.43
Fifthly, internal consistency was analyzed based on the omega coefficient (ω) and hierarchical omega coefficient (ωh), considering values ≥ 0.70 and 0.30 as satisfactory for ω and ωh, respectively. Finally, the convergent validity is analyzed from the Pearson correlation (r) between the scores of the RED/TIC and the scores of the Depression, Anxiety, and Stress Scale (DASS-21). The size of the Pearson correlation values (r) can vary from 0.10 to 0.29 (small), from 0.30 to 0.49 (medium), and from 0.50 to 1.0 (large).51 In particular, r = 0.50 to 0.69 represents a solid value, r = 0.70 to 0.89 represents a very solid value, and r ≥ 0.90 means the relationship between the variables is perfect.52
It should be noted that, given the potential common method variance (CMV) issues when using a homogeneous sample, as in this study, Harman’s single-factor test was used.49 The result of the Principal Component Analysis (PCA) generated by including the items from the two scales revealed 4 factors that account for 63.5% of the total variance. The first unrotated factor captured only 46.56% of the variance in the data. Therefore, these results suggested that CMV is not an issue in this study, as the two underlying assumptions were not met (that is, no factor emerged and the first factor did not capture most of the variance).
Results
Descriptive Analysis
As can be seen in Figure 1, all the dimensions of the techno-stress scale present low scores in a greater proportion, although with heterogeneous and asymmetric distributions and with extreme cases towards high scores. Teachers show less techno-stress due to inefficiency and more due to fatigue (Skepticism M= 1.44 SD=1.24; Fatigue= M= 1.70 SD=1.40; Anxiety M= 1.45 SD=1.35; Inefficiency M= 1.18 SD=1.24).
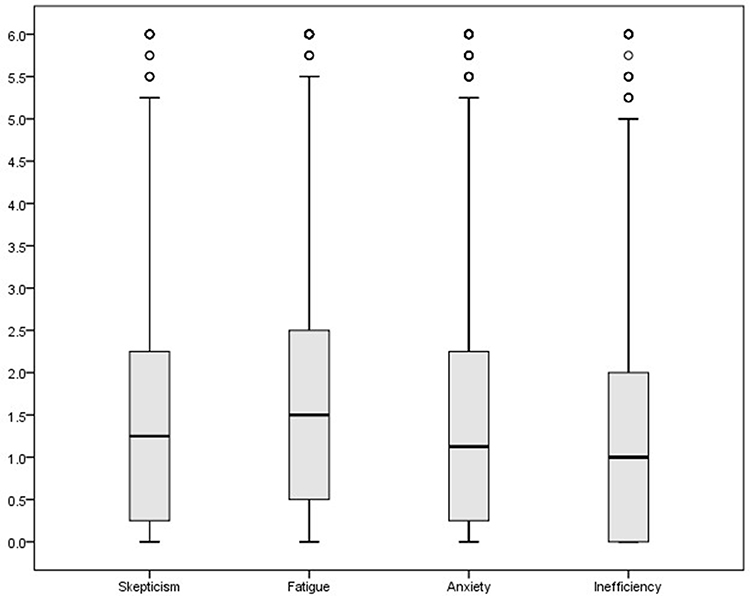 |
Figure 1 Box plot of the technostress dimensions. |
When classifying the teachers using the normative data of Salanova et al17 for a general sample of workers (N = 741), they are in the medium-high category. This indicates that, although the sample does not present techno-stress or techno-fatigue, there is a tendency to its manifestation in an important part of the sample.
Exploratory Factorial Analysis Using Subsample nA
A preliminary analysis of data suggests that the items of the RED/TIC scale showed a distribution within the limits of normality. According to Arenas et al,18 who describe criteria about maximum values for skewness (2) and kurtosis (7), our analysis showed maximum values of 1.71 for skewness and 2.76 for kurtosis (see Table 2). Likewise, the Kaiser–Meyer–Olkin (KMO, 0.951) and the Bartlett’s sphericity tests were significant (χ2 = 15,565; p < 0.001), showing data adequacy for factor analysis.
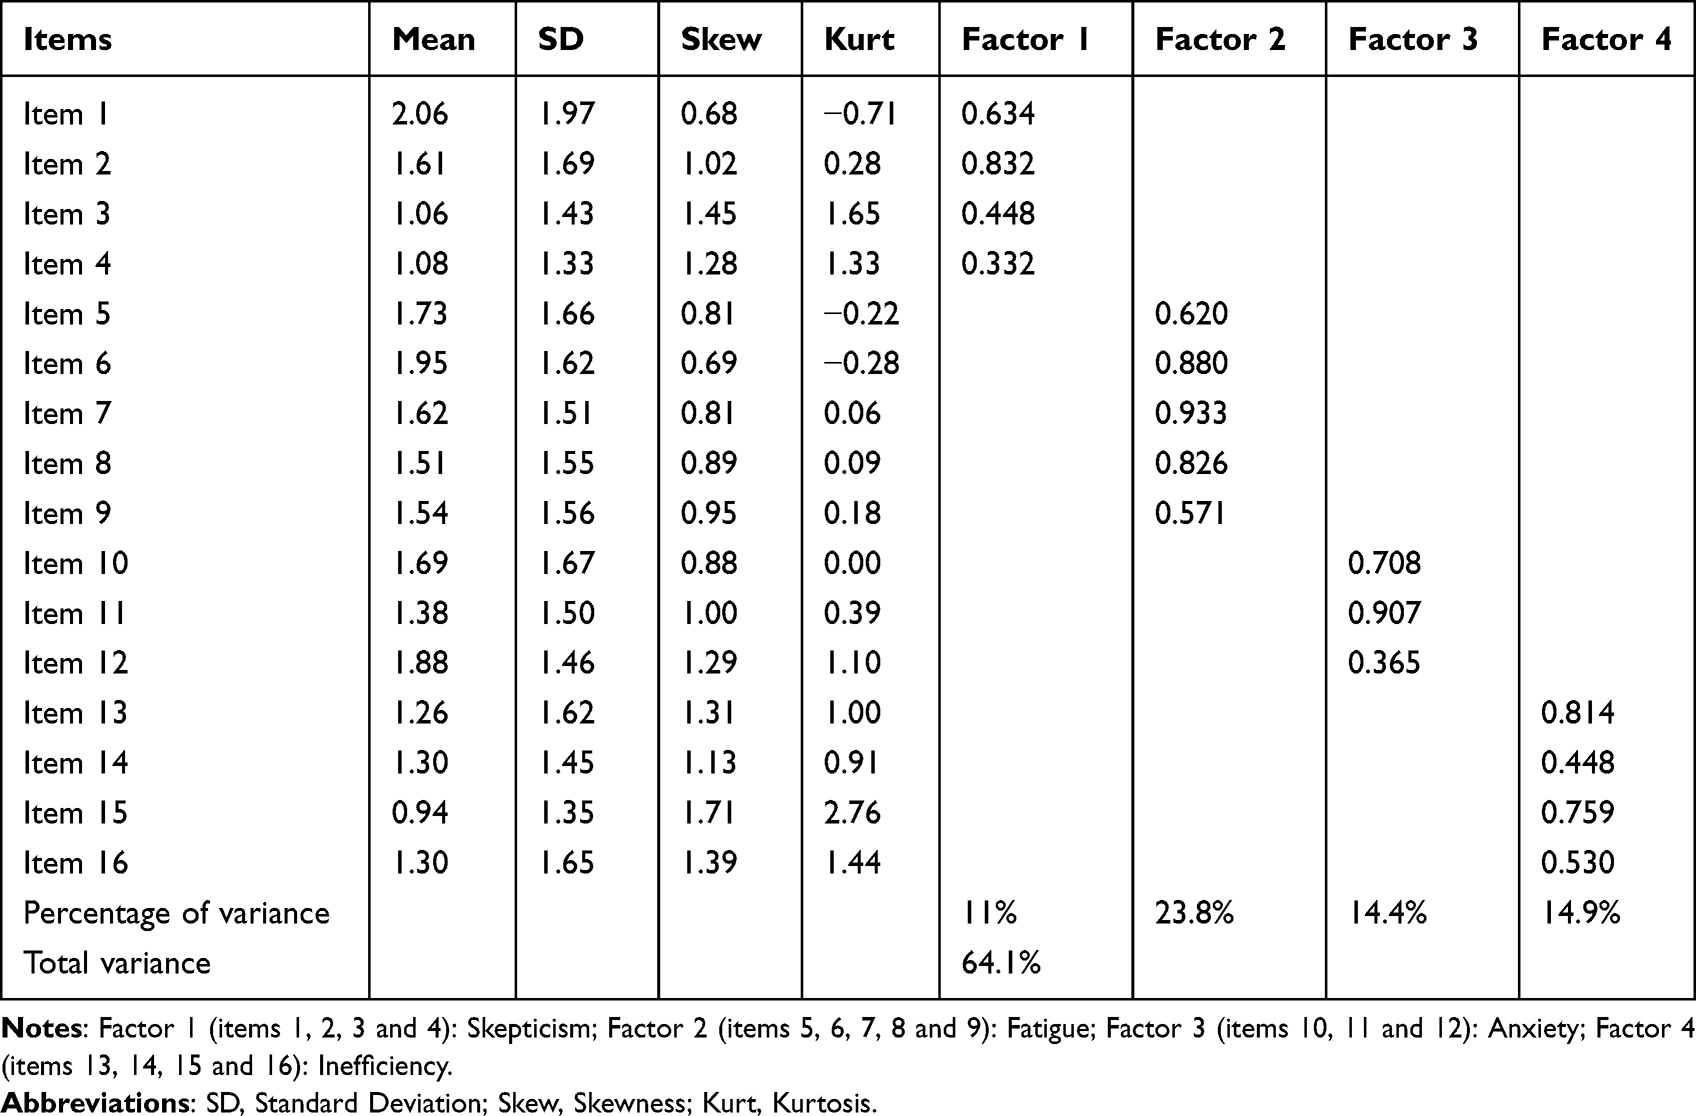 |
Table 2 Descriptive Statistics and Factor Loadings for RED/TIC |
From the set of items, four factors were obtained coinciding with the original structure of Salanova et al17 scale, which explains 64.1% of the total cumulative variance (Factor 1: 11%; Factor 2: 23.8%; Factor 3: 14.4%; Factor 4: 14.9%). It should be noted that item 9, which refers to tension and anxiety when working with technology, loaded on factor 2 (fatigue) and not on factor 3 (anxiety), as proposed by the original authors (see Table 2).
Confirmatory Factorial Analysis Using Sub Sample nB
To determine the factorial structure of RED/TIC, we compared the goodness-of-fit indices of eight different models of the Spanish version of the scale. Model 1: a one-dimensional structure where each item is represented by a single factor, thus including all sixteen items assessed within a single overall factor. Model 2: first order four-factor structure, namely skepticism (includes items 1 to 4), fatigue (includes items 5 to 8), anxiety (includes items 9 to 12), and inefficiency (includes items: 13 to 16), as proposed by the original authors of the scale (Salanova et al, 2007).17 Model 3: is similar to model 2, but taking into account the covariations between the errors of the items: 1–2, 5–4, 5–9, 8–9 and 13–15. Model 4: the items are arranged into four first-order factors, according to the results of AFE, where item 9 loaded on factor 2 (fatigue). Model 5: is similar to model 4 but taking into account the co-variations between the errors of the items 1–2, 6–15, 9–14 13–15. Model 6: a four-factor model but of second order, similar to model 4. Model 7: a second-order 4-factor model but respecified taking into account the correlated errors between items 6–15, 9–14 and 13–15. Model 8: a hierarchical structure that combines a general factor and four nested factors (skepticism, fatigue, anxiety and inefficiency).
The CMIN/DF, CFI, TIL, SRMR, RMSEA, AIC and BIC goodness-of-fit indices of Models 1–7 were not as adequate as those presented by Model 8 (CMIN/DF= 5.31; CFI = 0.976; TLI = 0.967; SRMR= 0.064; RMSEA = 0.055; AIC = 16,032; BIC = 16,116) (see Table 3), these results suggest that a hierarchical model that included a general factor and four nested factors had a better fit (see Figure 2).
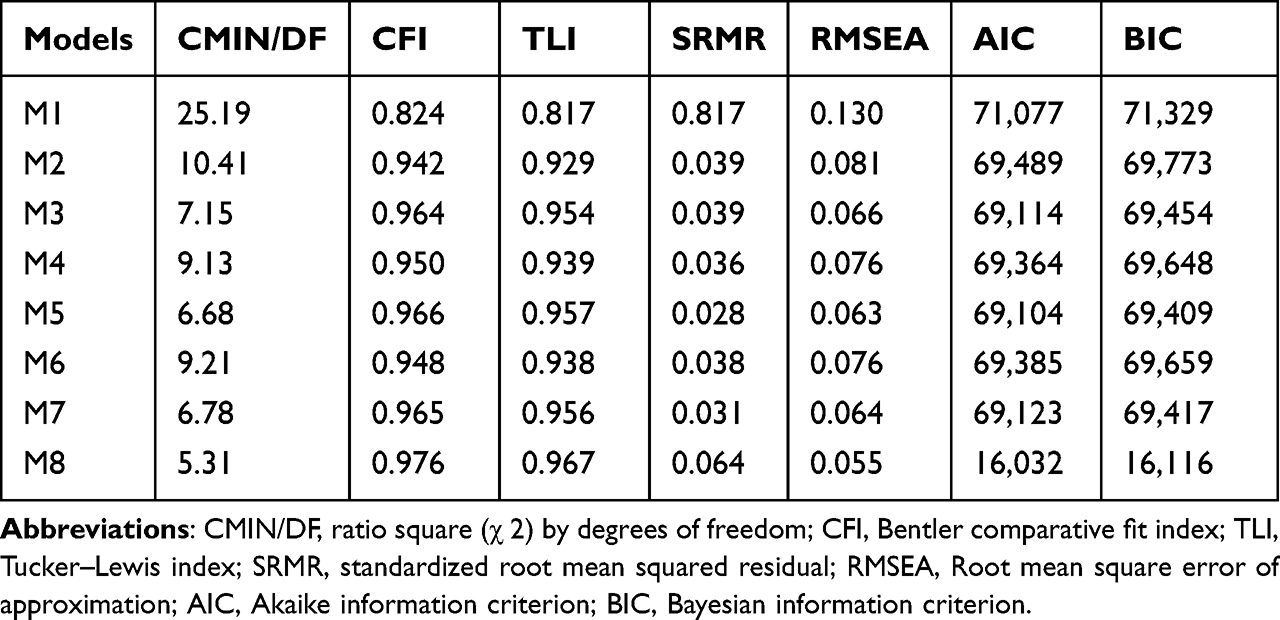 |
Table 3 Goodness-of-Fit Indices for the Confirmatory Factor Analysis |
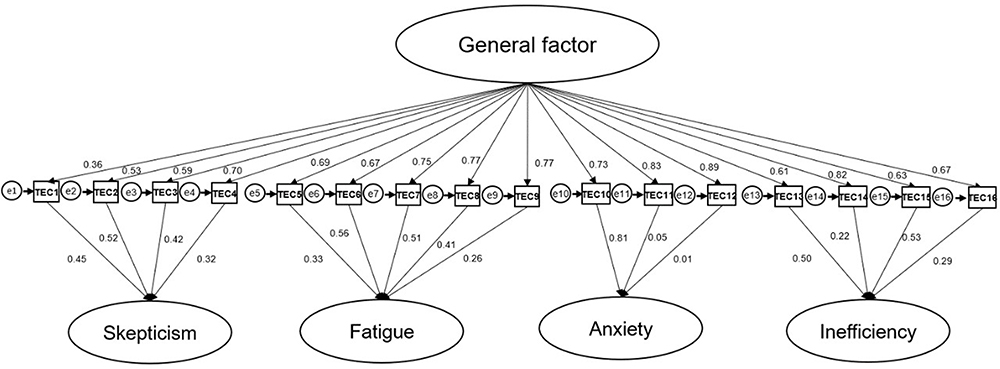 |
Figure 2 Hierarchical structure that combines a general factor and four nested factors. |
On the other hand, the additional assessment of the hierarchical model revealed that all factor loadings of Model 8 were mostly greater than 0.30 and positive. As can be seen in Table 4, the value of the PUC is less than 0.80, the value of the general ECV factor is greater than 0.60, and the OmegaH of the general factor is greater than 0.70. According to Reise et al,53 these indicators suggest the presence of some multidimensionality that is not severe enough to disqualify the interpretation of the instrument as primarily unidimensional. Specifically, the general factor of Model 8 explained the 74.4% of variance of technostress, and the four nested factors explained the 7, 8.5, 6.1 and 6.1%, respectively. Model 8 also showed ωh and H indices (ranging in the interval 0.30–0.70) suggesting a substantive contribution not only of the general factor but also of the nested factor skepticism explaining the variance of technostress (see Table 4).
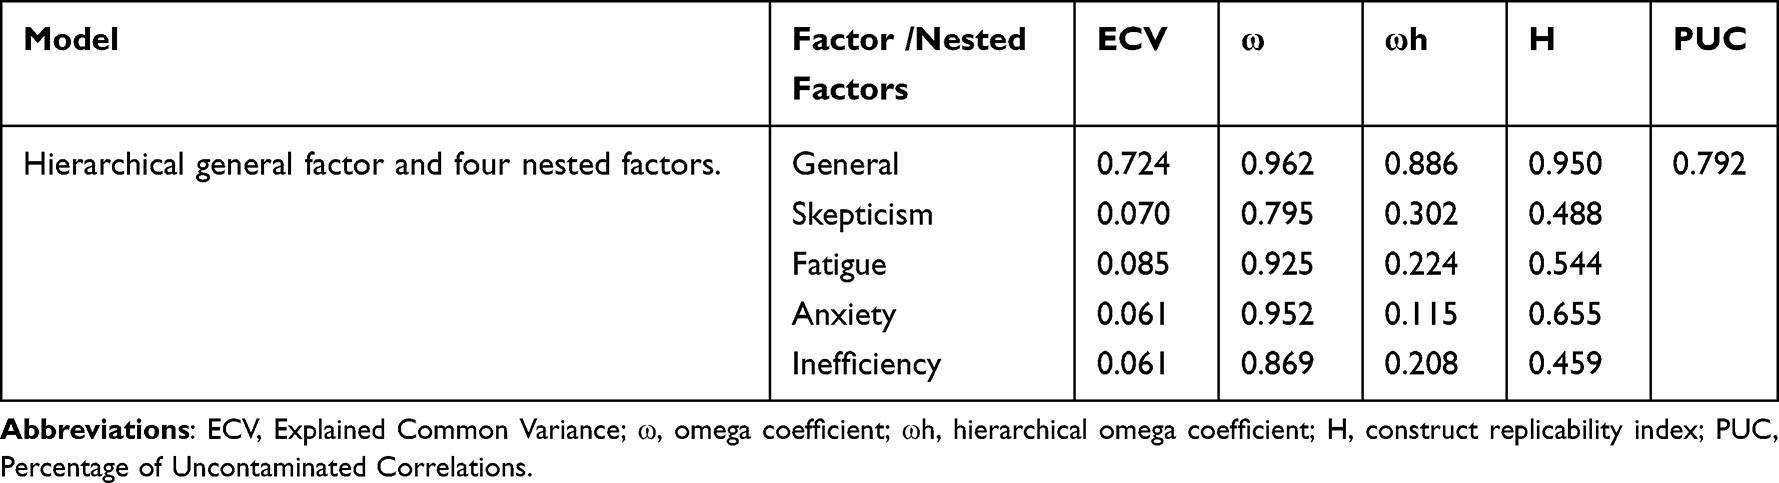 |
Table 4 Hierarchical Model Index |
The fit indices of hierarchical model 8, both for the total sample and separated by sex, are presented in Table 5, showing a satisfactory fit in each of them. Next, configurational invariance (MC) was analyzed, displaying indicators of good fit (CFI = 0.968 and RMSEA = 0.040). Metric invariance (MM) resulted in good fit indices (CFI = 0.968; RMSEA = 0.040), being equal to the values of MC because they do not present differences (ΔCFI = 0.000 and ΔRMSEA = 0.000). These results indicate that the factor loadings are invariant between the groups of men and women, where covariances are compared. On the other hand, the scalar invariance (SC) shows indices equal to the previous model (CFI = 0.968; RMSEA = 0.040) without differences (∆CFI = 0.000 and ∆RMSEA = 0.000), accepting invariance between thresholds. Finally, the strict invariance (ST) reflects a good fit (CFI = 0.968; RMSEA = 0.040) without differences (∆CFI = 0.000 and ∆RMSEA = 0.000), confirming the invariance of the residuals. Overall, the combined results demonstrated the factorial invariance of the Ecuadorian version of the RED/TIC across gender (both male and female). Similar results were also obtained in relation to age (≤38; ≥39), and public and private institutions (see Table 5).
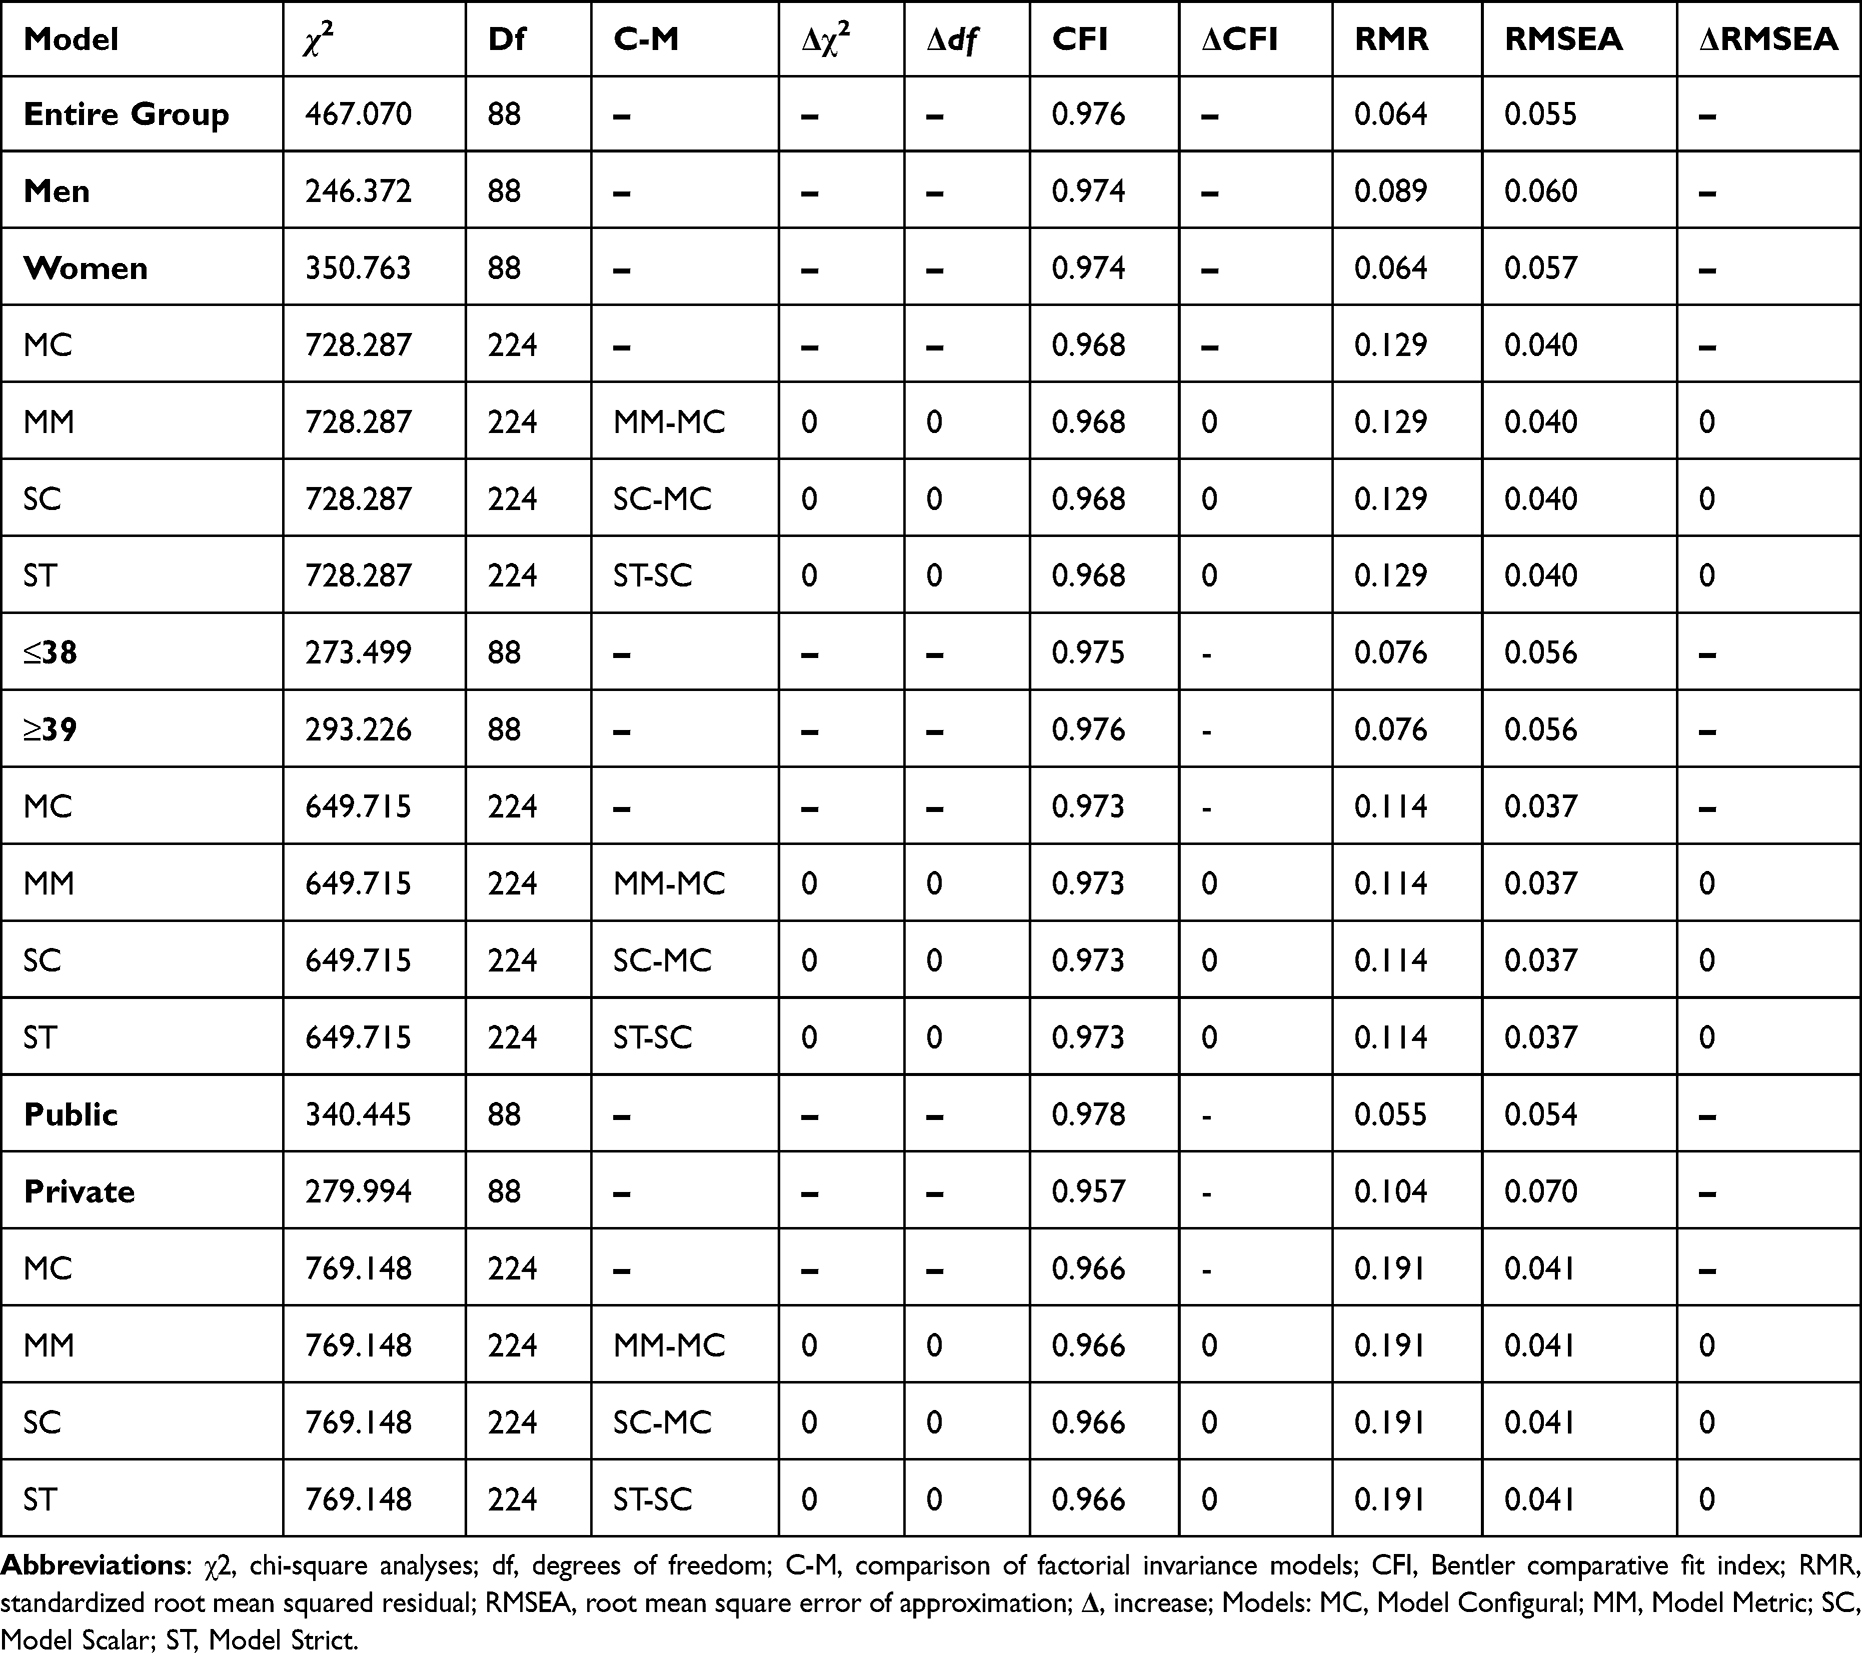 |
Table 5 Factorial Invariance for the Total Sample and by Gender, Age and Type of Institution of Hierarchical Model |
Internal Consistency
The internal consistency of hierarchical Model 8 of the RED/TIC scale showed satisfactory outcomes for the total scale (ω = 0.96, ωh = 0.89) and in the omega coefficient of its four nested factors: skepticism (ω = 0.80, ωh = 0.30), fatigue (ω = 0.93, ωh = 0.22), anxiety (ω = 0.95, ωh = 0.12) and inefficiency (ω = 0.87, ωh = 0.21).
Sex Differences in the Spanish Version of Technostress Scale in Ecuador
Other measures of validity by method of contrasted groups, we evaluated whether the RED/TIC scores differed by sex, controlling age. In general, female participants reported significantly (5%) higher technostress scores (M = 23.51; SD = 17.68) than males (M = 22.30; SD = 18.66) in the total score (F = 11.52, p < 0.001, η2 = 0.012). Such statistically significant differences were also found throughout most RED/TIC items, except for items 3 (referring to the contribution of technologies in their work), 4 (referring to the meaning of working with these technologies), 7 (referring to fatigue after working with technologies) and 8 (referring to how difficult it is to concentrate after working with technologies). When comparing the dimensions, significant differences are found in all of them, where women show more technostress in reference to skepticism [(F = 5.67, p < 0.01, η2 = 0.006): women (M = 1.45; SD = 1.22) and men (M = 1.41; SD = 1.27)], fatigue [(F = 3.43, p < 0.05, η2 = 0.004): women (M = 1.73; SD = 1.39), men (M = 1.63; SD = 1.43)], anxiety [(F = 12.62, p < 0.001, η2 = 0.013): women (M = 1.49; SD = 1.35), men (M = 1.37; SD = 1.35)], and inefficiency [(F = 18.15, p < 0.001, η2 = 0.019): women (M = 1.20; SD = 1.22) men (M = 1.15; SD = 1.27)]. However, the effect sizes of the comparison of such sex differences were slight, being greater that of anxiety and inefficiency (see Table 6).
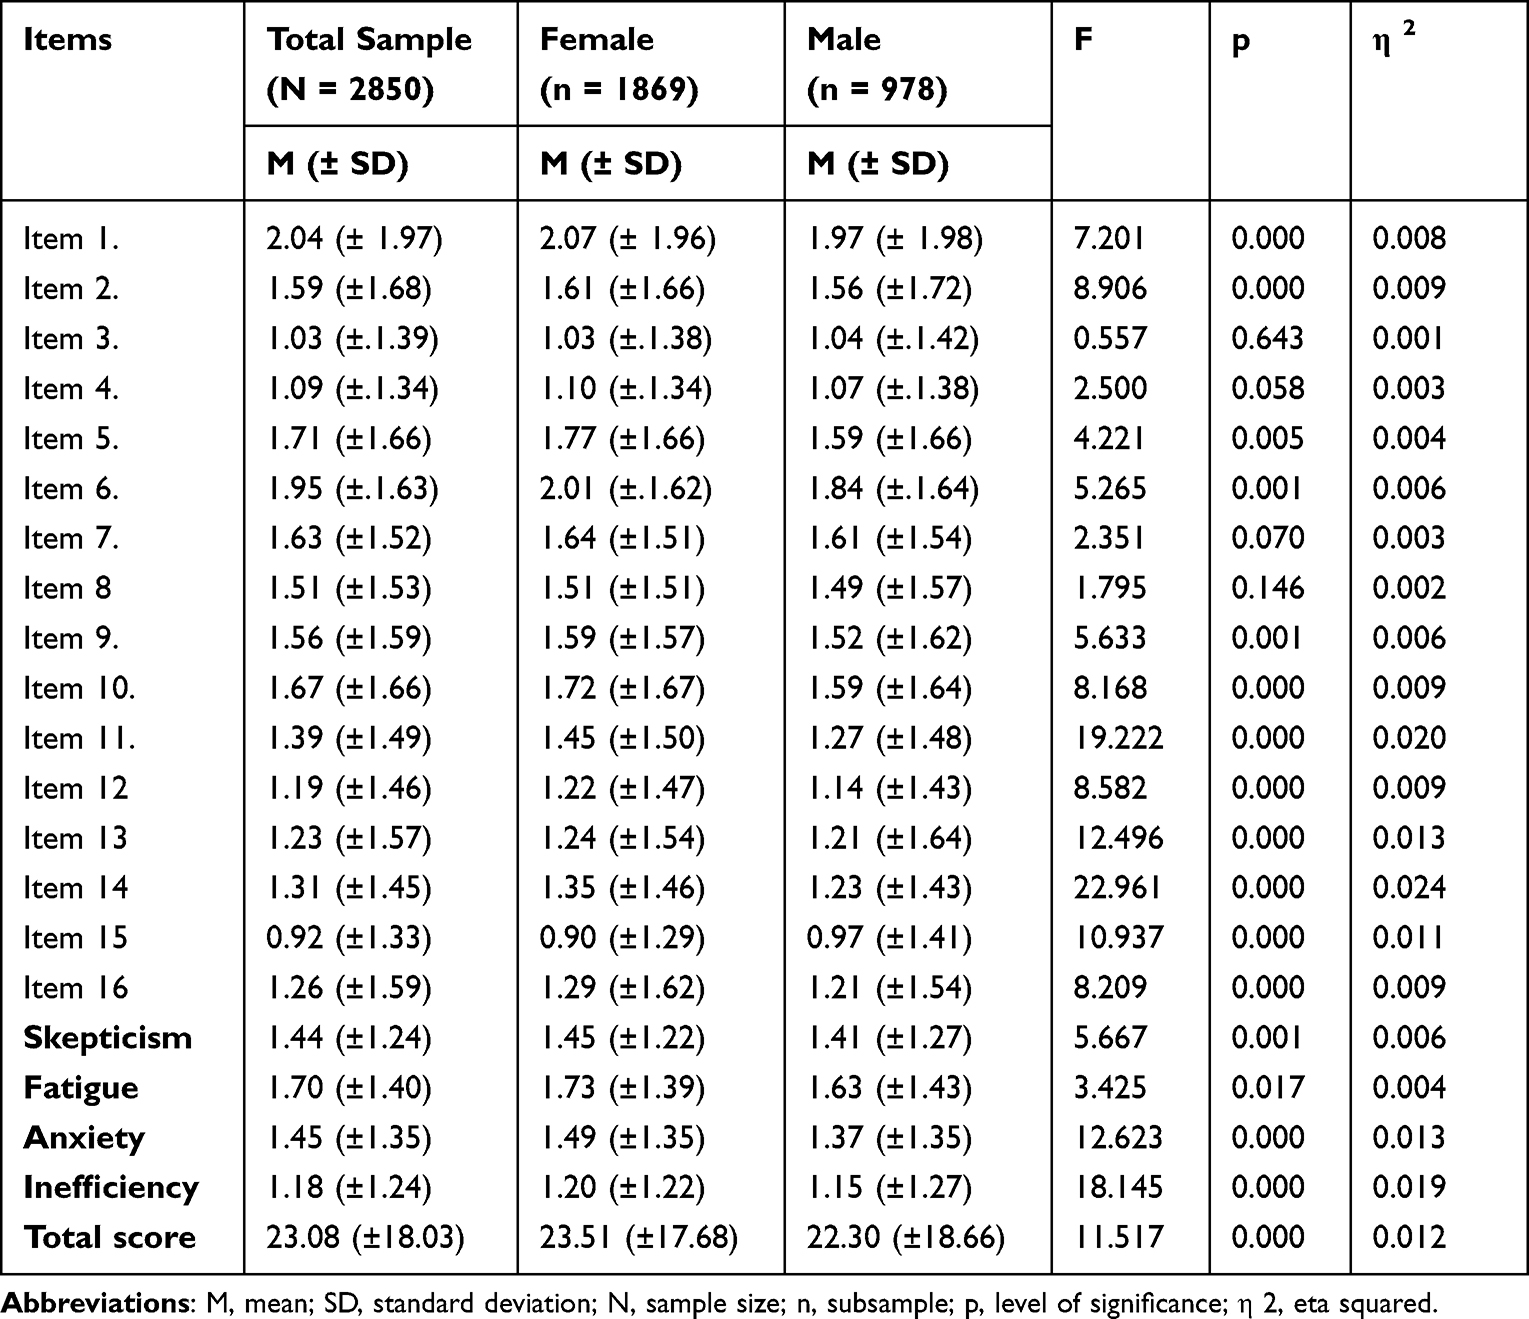 |
Table 6 Sex Differences in the Scores of the Technostress Scale (Item by Item) |
Convergent Validity
To determine convergent validity, a correlation analysis was performed between the RED/TIC scores and the DASS-21 Depression, Anxiety and Stress Scale with the complete sample (n=2280). Table 7 shows high and positive correlations were obtained with the scale to assess anxiety, depression and stress (DASS-21).
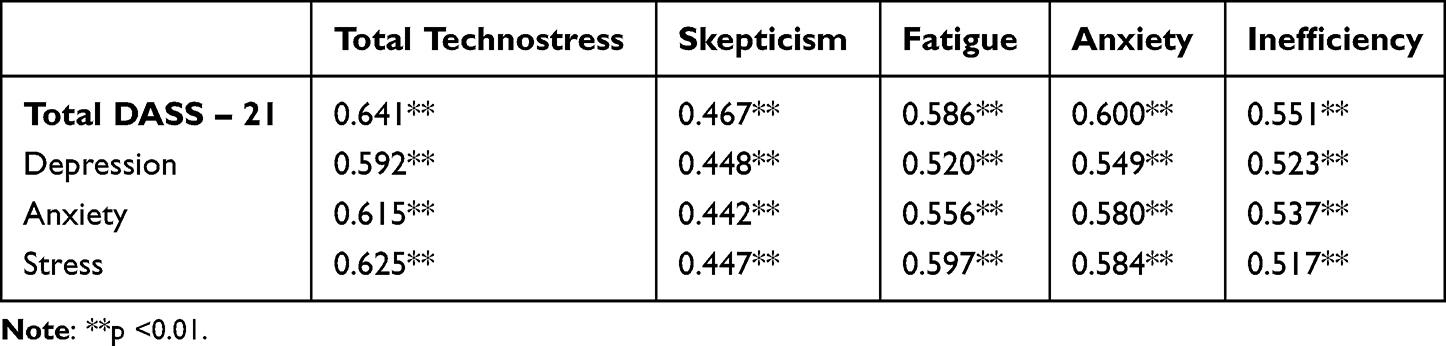 |
Table 7 Correlations of Technostress Scores and Mental Health |
Discussion
The main goal of the present study was to analyze the psychometric properties of the Spanish version of the technostress scale in Ecuadorian primary and secondary education teachers in order to address to the lack of validated and adapted instruments in Latin America. To our knowledge, no research had previously evaluated both the psychometric properties and factor structure in the Ecuadorian culture. In this study, it has been empirically verified, through construct validity (EFA and CFA), factorial invariance, reliability (omega and hierarchical omega coefficients), sex differences in technostress scale scores and convergent validity (Pearson’s correlations), that the RED/TIC is a reliable and valid tool for measuring technostress in teachers.
When first evaluating the behavior of technostress in the group of teachers, they are in the medium-high category.17 Despite the fact that the majority do not present technostress or techno-fatigue, there is a tendency towards its manifestation in an important part of the sample. These data coincide with studies carried out in Chile,11 with the exception of inefficiency since the data classify their teachers with low levels of it. Similarly, comparing with studies from Mexico where all dimensions are classified as medium high,10 this study shows that teachers perceive important demands regarding the use of ICTs in their daily work that must be taken into account at the organizational level.
Regarding the differences between the dimensions, it coincides with previous studies in the sense that the least source of stress comes from inefficiency and greater technostress in fatigue and anxiety.11,22 Although this particular group does not present greater anxiety, it does present greater fatigue. This means it perceives tiredness and cognitive exhaustion due to the continued use of ICTs, which could lead it not to assimilate or structure the information.22 However, as a positive, it presents lower values in beliefs of inefficiency with the use of ICTs, compared to the other dimensions, that is, they perceive some capacities for the adequate use of ICTs.17
In relation to the exploratory factorial analysis, the results indicated a factorial structure of four factors for the RED/TIC scale that explains 64.1% of the variance of the techno-stress construct. This structure is consistent with the original model12 and with the study on Brazilian workers36 and in Chilean teachers.11 It should be noted that item 9 was the only one that did not load in the expected factor (anxiety).
Although in the EFA it was found that the RED/TIC scale consists of four factors as reflected in the results of previous studies that reported that the RED/TIC has a structure of four first-order factors,11,17,36 in the CFA, when considering the measurements of the errors, a good fit of said model was not found. Therefore, a CFA of other models was carried out. In this sense, the hierarchical model that included a general factor and four nested factors (skepticism, anxiety, fatigue and inefficiency) has a better goodness of fit, among all the models evaluated. The hierarchical model has the advantage of being able to use both a one-dimensional solution (that is, using the cut-off point and the total score as a single variable) and a four-dimensional solution to evaluate the phenomenon of technostress in more detail. These results support the idea that technostress is a multidimensional construct, with the 4 dimensions originally proposed.17
Regarding measurement invariance, results of our study showed that the hierarchical model remained invariant across sex, age and private and public institutions. Researchers can proceed with examining the mean of those groups having confidence that, if any group differences are found, they are due to actual differences in technostress levels and not to an artefact of measurement error.54
On the other hand, our analyses revealed good internal consistency, not only for the total score but also for its four nested factors: skepticism, fatigue, anxiety and inefficiency. Such good reliability of the scale’s total score is similar or even higher than those reported in previous research, both in the 16-item version of the instrument17,36 and in the 22-item version.55,56
Regarding other measures of validity, the technostress construct was expected to be differentiated by sex. According to gender studies in the area of health and technology, there are greater problems in the group of women.57 This assumption was verified in this study, since it was found that women present greater techno-stress than men in the total score and in all four dimensions. Although there is a greater magnitude of effect in the total score and the dimensions of inefficiency and anxiety, it must be taken into account that the magnitudes of the effect are small. The fact that women present greater technostress, and particularly more in the dimensions of anxiety and inefficiency, shows the tendency in this group of female teachers to negatively perceive the use of technology, to experience emotional tension and discomfort due to the use of some type of ICT, and to have negative thoughts about the skills and competencies in the use of ICTs.
These results coincide with the study by Salanova et al,17 who found differences based on sex in the general sample of workers, but only in the anxiety scale where women presented higher scores than men. In other studies,58 differences by sex have been found in anxiety, fatigue and inefficiency, reporting higher scores in women than in men. Villavicencio et al59 scored higher on techno-fatigue in women, but not on techno-anxiety.
These findings can be explained, especially in contexts such as the pandemic, by the conflict of multiple roles in women, which makes them prone to be a more vulnerable group when it comes to teleworking.11,60 Another explanation, which may not be exclusive, is the use and differential attitude of technology by gender. It has been found that men make greater use of digital tools and educational platforms,61 as well as maintain more favorable attitudes towards the use of technology than women.62 This could result in greater security and less perception of threat in the adoption of a technology in the workplace. In fact, Grande de Prado et al63 found that men feel more competent in solving technical problems and identifying technological needs and responses.
On the other hand, the use of technologies, and especially abruptly as has occurred during the pandemic, is capable of altering people’s daily lives, sometimes leading to a negative impact on health.5,8,9 The incorporation of ICTs can become a source of real stress that causes tension and anxiety in workers who do not use technology on a daily basis in their work activity.19
Thus, in terms of convergent validity, high and positive correlations were obtained between the RED/TIC scores and the scale to assess anxiety, depression and stress (DASS-21). These findings are consistent with the literature where techno-stress has been associated with depression,20 and with anxiety and stress.9,10
Limitations and Practical Implications
Several limitations of the study merit mention. First, our study should be considered with caution because the sample was only with primary and secondary school teachers, but no university teachers or trainers were considered. Second, we only tested the measurement invariance among sex, age and public and private institutions, and it was not possible to assess other variables. For example, we were unable to evaluate measurement invariance across different ethnic groups, as most of the teachers were mestizos (that is, mixed-race). Third, this represents a cross-sectional study, so measurement invariance, internal consistency as well as convergent validity should be replicated in future longitudinal designs. Fourth, although the anonymity of the data was guaranteed and the information provided was used for research purposes only, the use of a self-report tool (such as the RED/TIC) may be subject to some inaccuracies in data collection due to possible memory biases, social desirability, and acquiescent responses.
It should be noted that some studies work with 5 dimensions with this techno-stress scale.26,55 This research only works with the 4 original dimensions most related to techno-stress (skepticism, anxiety, fatigue and inefficiency), however, it is possible to take addiction into account as another dimension.
Finally, another limitation is related to the sample used in this study, which is not representative of the 21 countries in which Spanish is the native language. This limitation may affect the external validity of the results of this study. Therefore, for future research, it is recommended to use samples that include different Spanish-speaking countries.
Despite these limitations, the sample size and the values found empirically support our findings. In other words, the Spanish version of the RED/TIC scale constitutes a reliable and valid instrument that will facilitate Technostress research in primary and secondary school teachers in Ecuador or in countries in which Spanish is the primary language, which makes it a useful base tool for possible intervention programs in the group of teachers. The findings have crucial implications for teachers and education professionals. The adoption of technology in education is likely to continue, making it vital to address and manage technostress among teachers. Tailored interventions and support mechanisms can be developed based on the specific dimensions of technostress identified in this study. Also, this scale provides healthcare professionals with a valuable tool for assessing and addressing technostress among teachers. Recognizing the multifactorial nature of technostress allows for more precise interventions and support strategies. And finally, the validation of the RED/TIC scale in the Ecuadorian teaching population marks a significant advancement in research on technostress in Latin America.
Conclusion
The use of technology and teleworking are two situations that have increased in recent times and were accentuated during the most critical period of the pandemic. The trend is that, although a new normality eventually returns, there is no turning back in terms of the use of ICTs, hence the emerging interest in the implications that this brings in the field of health. The present theoretical review shows that one of the consequences is techno-stress. Although it can occur in different work environments, this work focused specifically on the teaching population as one of the most affected by the new working conditions that arose and have forced teachers to constantly adapt to technological updates that do not stop. Due to all of the above, it was considered necessary to study the psychometric properties and factorial structure of RED/TIC to measure techno-stress, and it was found that the hierarchical model that included a general factor and four nested factors had a better fit. This model offers a one-dimensional solution, that is, the cut-off point and the total score of the scale can be used as a single variable and a four-nested-factor solution (skepticism, fatigue, anxiety and inefficiency) to further assess the phenomenon of techno-stress. These findings suggest that technostress is a multifactorial phenomenon.
In addition, it was empirically verified that the instrument presents convergent validity and optimal internal consistency, that is, it can be used safely and accurately in the Ecuadorian teaching population, which is a significant advance for researchers in the area and healthcare professionals.
The results derived from this research allow healthcare professionals and researchers from countries where Spanish is the main language to have a 16-item, easy-to-use instrument that measures technostress in an academic context, in a valid and reliable way.
Data Sharing Statement
Data from this study will be available upon request to the corresponding author. However, the data are not publicly available for privacy and ethical reasons.
Author Contributions
All authors made a significant contribution to the work reported, whether that is in the conception, study design, execution, acquisition of data, analysis and interpretation, or in all these areas; took part in drafting, revising or critically reviewing the article; gave final approval of the version to be published; have agreed on the journal to which the article has been submitted; and agree to be accountable for all aspects of the work.
Disclosure
The authors report that there are no conflicts of interest in this work.
References
1. Borle P, Reichel K, Niebuhr F, Voelter-Mahlknecht S. How are techno-stressors associated with mental health and work outcomes? A systematic review of occupational exposure to information and communication technologies within the technostress model. Int J Environ Res Public Health. 2021;18:8673. doi:10.3390/ijerph18168673
2. Buira J. El teletrabajo. Entre el mito y la realidad. Vol. 44. Editorial UOC; 2012.
3. Rappaccioli R, Hernández F, Zamora A. Repercusiones en la salud a causa del teletrabajo. Rev Méd Sinerg. 2021;6(2):e641. doi:10.31434/rms.v6i2.641
4. Velandia AMC, Cuervo ZEB, Rojas GYF. Efecto del teletrabajo en la salud de los trabajadores de las PYMES de la ciudad de Bogotá durante la pandemia del COVID-19. Rev Ing Mat Cienc Inf. 2023;10(19):73–82. doi:10.21017/rimci.2023.v10.n19.a130
5. Instituto de Seguridad y Bienestar Laboral (ISBL). Informe ObservaPRL.org sobre Tecnoestrés. Available from: https://isbl.eu/observatorio-tecnoestres-2020/2020.
6. Aktan O, Toraman Ç. The relationship between technostress levels and job satisfaction of teachers within the COVID-19 period. J Educ Techno Soc. 2022;27(7):10429–10453. doi:10.1007/s10639-022-11027-2
7. Solís García P, Lago Urbano R, Real Castelao S. Consequences of COVID-19 confinement for teachers: family-work interactions, technostress, and perceived organizational support. Int J Environ Res Public Health. 2021;18(21):1–9. doi:10.3390/ijerph182111259
8. Cortez J. El estrés docente en tiempos de pandemia. Dilemas Contemp. 2021;6(1):1–11. doi:10.46377/dilemas.v8i.2560
9. Fernández- Batanero JM, Román-Graván P, Reyes-Rebollo MM, Montenegro-Rueda M. Impact of educational technology on teacher stress and anxiety: a literature review. Int J Environ Res Public Health. 2021;18(2):1–13. doi:10.3390/ijerph18020548
10. Garcia M, Solis L, Unda S. Technostress in university teachers during the COVID-19 pandemic. RevEDU. 2022;10(1):1–14. doi:10.37467/gkarevedu.v10.3036
11. Estrada C, Vega A, Castillo D, Müller S, Boada J. Technostress of Chilean teachers in the context of the COVID-19 pandemic and teleworking. Int J Environ Res Public Health. 2021;18(10):1–14. doi:10.3390/ijerph18105458
12. Carrión N, Castelo W, Guerrero J, Criollo L, Jaramillo M. Factores que influyen en el tecnoestrés docente durante la pandemia por la COVID-19 en Ecuador. Rev Inf Cient. 2022;101(2):1–12.
13. Gañán-Moreno A, Correa-Pérez JJ, Ochoa-Duque SA, Orejuela-Gómez JJ. Tecnoestrés laboral derivado de la virtualidad obligatoria por prevención del COVID-19 en docentes universitarios de Medellín (Colombia). Trabalho (En)Cena. 2021;6(1):1–23. doi:10.20873/2526-1487e021003
14. Estrada Araoz EG, Gallegos Ramos NA, Huaypar Loayza KH, Paredes Valverde Y, Quispe Herrera R. Tecnoestrés en estudiantes de una universidad pública de la Amazonía peruana durante la pandemia COVID-19. Rev Bras Educ Camp. 2021;6:e12777. doi:10.20873/uft.rbec.e12777
15. Brod C. Technostress: The Human Cost of the Computer Revolution. USA: Addison-Wesley Publishing Company; 1984.
16. Weil M, Rosen L. Technostress: Coping with Technology @work, @home, @play. New York: J. Miley; 1997.
17. Salanova M, Llorens S, Cifre EY, Nogareda C. El tecnoestrés: concepto, medida e intervención psicosocial. Nota Técnica de Prevención 730 Insst Es; 2007.
18. Arenas Moreno A, Sanclemente Ibáñez FJ, Terán Tinedo V, Di Marco D. Spanish validation of the technostress creators scale. Psicothema. 2023;35(1):98–108. doi:10.7334/psicothema2022.198
19. Wang K, Shu Q, Tu Q. Technostress under different organizational environments: an empirical investigation. Comput Hum Behav. 2008;24(6):3002–3013. doi:10.1016/j.chb.2008.05.007
20. Lei CF, Ngai WT. The double-edged nature of technostress on work performance: a research model and research agenda. In:
21. Naval C, Sádaba-Chalezquer CY, Bringué X. Impacto de las Tecnologías de la Información y de la Comunicación (TIC) en las Relaciones Sociales de los Jóvenes Navarros. Navarra: Gobierno de Navarra. Instituto Navarro de Deporte y Juventud; 2003.
22. Salanova M, Llorens S, Cifre E. The dark side of technologies: technostress among users of information and communication technologies. Int J Psychol. 2013;48(3):422–436. doi:10.1080/00207594.2012.680460
23. Sánchez-Gómez M, Adelantado-Renau M, Beltran-Valls M. Tecnoestrés docente: la importancia de las competencias digitales y la edad. In: En Buzón OY, Romero C, editors. Metodologías activas con TIC en la educación del siglo XXI. Madrid: Dykinson; 2021:2171–2190.
24. Syvänen A, Mäkiniemi JP, Syrjä S, Heikkilä-Tammi K, Viteli J. When does the educational use of ICT become a source of technostress for Finnish teachers? Seminar Net. 2016;12(2):95–109. doi:10.7577/seminar.2281
25. Alcas Zapata N, Alarcón Diaz HH, Venturo Orbegoso CO, Alarcón Diaz MA, Fuentes Esparrell JA, López Echevarria TI. Tecnoestrés docente y percepción de la calidad de servicio en una universidad privada de Lima. Propós Represent. 2019;7(3):231–247. doi:10.20511/pyr2019.v7n3.388
26. Ruiz V. Validez factorial de una escala de nivel de percepción de los factores psicosociales del Tecnoestrés en las pymes de Piedras Negras Coahuila. Rev RAITES. 2018;4(7):58–77.
27. Gabr HM, Soliman SS, Allam HK, Raouf S. Effects of remote virtual work environment during COVID-19 pandemic on technostress among Menoufia University Staff, Egypt: a cross-sectional study. Environ Sci Pollut Res Int. 2021;28(38):53746–53753. doi:10.1007/s11356-021-14588-w
28. Chou H, Chou C. A multigroup analysis of factors underlying teachers’ technostress and their continuance intention toward online teaching. Comput Educ. 2021;175:1–12. doi:10.1016/j.compedu.2021.104335
29. Rohwer E, Flöther JC, Harth V, Mache S. Overcoming the “dark side” of technology-a scoping review on preventing and coping with work-related technostress. Int J Environ Res Public Health. 2022;19(6):1–30. doi:10.3390/ijerph19063625
30. Rosen L, Sears DY, Weil M. Computerphobia. Behav Res Methods Instrum Comput. 1987;19(2):167–179. doi:10.3758/BF03203781
31. Rosen LY, Weil M. Measuring technophobia. In: A Manual for the Administration and Scoring of the Computer Anxiety Rating Scale, the Computer Thoughts Survey and the General Attitude Toward Computer Scale. USA: Chapman University; 1992.
32. Hudiburg R. Psychology of computer use: VII. Measuring technostress: computer-related stress. Psychol Rep. 1989a;64(3):767–772. doi:10.2466/pr0.1989.64.3.767
33. Hudiburg R. Psychology of computer use: XVII. The computer technology hassles scale: revision, reliability, and some correlates. Psychol Rep. 1989b;65(3_suppl2):1387–1394. doi:10.2466/pr0.1989.65.3f.1387
34. Ragu-Nathan T, Tarafdar M, Ragu-Nathan B, Tu Q. The consequences of technostress for end users in organizations: conceptual development and empirical validation. Inf Syst R. 2008;19(4):417–433. doi:10.1287/isre.1070.0165
35. Nimrod G. Technostress: measuring a new threat to well-being inlater life. Aging Ment Health. 2018;22(8):1080–1087. doi:10.1080/13607863.2017.1334037
36. Carlotto MS, Gonçalves SG. Tradução, adaptação e exploração de propriedades psicométricas da Escala de Tecnoestresse (RED/TIC). Psicol Estud. 2010;15(1):157–164. doi:10.1590/S1413-73722010000100018
37. Penado Abilleira M, Rodicio-García ML, Ríos-de Deus MP, Mosquera-González MJ. Technostress in Spanish university teachers during the COVID-19 pandemic. Front Psychol. 2021;12:617650. doi:10.3389/fpsyg.2021.617650
38. Lovibond P, Lovibond S. The structure of negative emotional states: comparison of the depression anxiety stress scales (DASS) with the Beck depression and anxiety inventories. Behav Res Ther. 1995;33(3):335–343. doi:10.1016/0005-7967(94)00075-u
39. Alagarsamy S, Sugirthan N, Mehrolia S, Elangovan N. Translation and validation of the Tamil version of depression anxiety stress scales-21. Affect Disord Rep. 2022;10:100398. doi:10.1016/j.jadr.2022.100398
40. Antúnez Z, Vinet EV. Escalas de depresión, ansiedad y estrés (DASS-21): validación de la versión abreviada en estudiantes universitarios chilenos. Ter Psico. 2012;30(3):49–55. doi:10.4067/S0718-48082012000300005
41. Kakemam E, Navvabi E, Albelbeisi AH, Saeedikia F, Rouhi A, Majidi S. Psychometric properties of the Persian version of Depression Anxiety Stress Scale-21 Items (DASS-21) in a sample of health professionals: a cross-sectional study. BMC Health Serv Res. 2022;22(1):1–9. doi:10.1186/s12913-022-07514-4
42. World Medical Association. World Medical Association Declaration of Helsinki: ethical principles for medical research involving human subjects. JAMA. 2013;310(20):2191–2194. doi:10.1001/jama.2013.281053
43. Dueber DM. Bifactor Indices Calculator: A Microsoft Excel-Based Tool to Calculate Various Indices Relevant to Bifactor CFA Models. Kentucky: University of Kentucky; 2017.
44. Harrington D. Confirmatory Factor Analysis. Oxford, UK: Oxford University Press; 2009.
45. Lloret-Segura S, Ferreres-Traver A, Hernandez-Baeza A, Tomas-Marco I. Exploratory item factor analysis: a practical guide revised and updated. An de Psicol. 2014;30(3):1151–1169. doi:10.6018/analesps.30.3.199361
46. Byrne BM. Structural Equation Modeling with AMOS: Basic Concepts, Applications, and Programming.
47. Hu L, Bentler PM. Cutoff criteria for fit indexes in covariance structure analysis: conventional criteria versus new alternatives. Struct Equ Modeling. 1999;6(1):1–55. doi:10.1080/10705519909540118
48. Rodriguez A, Reise SP, Haviland MG. Evaluating bifactor models: calculating and interpreting statistical indices. Psychol Methods. 2016;21(2):137–150. doi:10.1037/met0000045
49. Tehseen S, Ramayah T, Sajilan S. Testing and controlling for common method variance: a review of available methods. J Manag Sci. 2017;4(2):142–168. doi:10.20547/jms.2014.1704202
50. Cheung GW, Rensvold RB. Evaluating goodness-of-fit indexes for testing measurement invariance. Model Struct Equat. 2002;9:233–255. doi:10.1207/S15328007SEM0902_5
51. Cohen J. Statistical Power Analysis for the Behavioral Sciences. Hillsdale NJ: Erlbaum; 1988.
52. Byrne B. Structural Equation Modeling with AMOS.
53. Reise SP, Bonifay WE, Haviland MG. Scoring and modeling psychological measures in the presence of multidimensionality. J Pers Assess. 2013;95(2):129–140. doi:10.1080/00223891.2012.725437
54. Putnick DL, Bornstein MH. Measurement invariance conventions and reporting: the state of the art and future directions for psychological research. Dev Rev. 2016;41:71–90. doi:10.1016/j.dr.2016.06.004
55. Villavicencio EY, Cazares M. Adaptación y validación de la escala de tecnoadicción del cuestionario red-tecnoestrés, en una población laboral mexicana. Rev Iberoam. 2021;29(1):1–17. doi:10.48102/pi.v29i1.176
56. Eidman L, Basualdo Felleau SE. Adaptación y validación de la escala RED-tecnoestrés en población de estudiantes universitarios argentinos. Academo. 2021;8(2):178–188. doi:10.30545/academo.2021.jul-dic.7
57. Lambert EG, Altheimer I, Hogan NL. An exploratory examination of a gendered model of the effects of role stressors. Women Crim Justice. 2010;20(3):193–217. doi:10.1080/08974454.2010.490473
58. Días Pocinho M, Costa García J. Impacto psicosocial de la tecnología de información y comunicación (tic): tecnoestrés, daños físicos y satisfacción laboral. Acta Colomb Psicol. 2008;11(2):127–139.
59. Villavicencio-Ayub E, Ibarra Aguilar DG, Calleja N. Technostress in the Mexican population and its relationship with sociodemographic and labor variables. Psicogente. 2020;23(44):27–53.
60. Angelucci L, De Abreu Y. Influencia de la satisfacción con los servicios, las preocupaciones acerca de la COVID-19, la valoración de la COVID-19, el sexo y la edad sobre la salud mental en estudiantes y docentes venezolanos. Analogías del Comportamiento. 2021;18:83–99.
61. Quesada BC, Muñoz VZ, Tomás MSA. El uso de tecnologías de asistencia sanitaria digital por parte de la población mayor desde una perspectiva de género e intrageneracional. Teknokultura. 2021;18(2):103–113. doi:10.5209/tekn.74199
62. Cai Z, Fan XY, Du J. Género y actitudes hacia el uso de la tecnología: un metanálisis. Comput Educ. 2017;105:1–13. doi:10.1016/j.compedu.2016.11.003
63. Grande-de-Prado M, Cañón-Rodríguez R, García-Martín S, Cantón-Mayo I. Competencia digital: docentes en formación y resolución de problemas. Educar. 2021;57(2):381–396. doi:10.5565/rev/educar.1159
 © 2023 The Author(s). This work is published and licensed by Dove Medical Press Limited. The
full terms of this license are available at https://www.dovepress.com/terms
and incorporate the Creative Commons Attribution
- Non Commercial (unported, 3.0) License.
By accessing the work you hereby accept the Terms. Non-commercial uses of the work are permitted
without any further permission from Dove Medical Press Limited, provided the work is properly
attributed. For permission for commercial use of this work, please see paragraphs 4.2 and 5 of our Terms.
© 2023 The Author(s). This work is published and licensed by Dove Medical Press Limited. The
full terms of this license are available at https://www.dovepress.com/terms
and incorporate the Creative Commons Attribution
- Non Commercial (unported, 3.0) License.
By accessing the work you hereby accept the Terms. Non-commercial uses of the work are permitted
without any further permission from Dove Medical Press Limited, provided the work is properly
attributed. For permission for commercial use of this work, please see paragraphs 4.2 and 5 of our Terms.