Back to Journals » Drug Design, Development and Therapy » Volume 8
Provisional in-silico biopharmaceutics classification (BCS) to guide oral drug product development
Authors Wolk O, Agbaria R, Dahan A ![]()
Received 5 June 2014
Accepted for publication 1 July 2014
Published 24 September 2014 Volume 2014:8 Pages 1563—1575
DOI https://doi.org/10.2147/DDDT.S68909
Checked for plagiarism Yes
Review by Single anonymous peer review
Peer reviewer comments 4
Omri Wolk, Riad Agbaria, Arik Dahan
Department of Clinical Pharmacology, School of Pharmacy, Faculty of Health Sciences, Ben-Gurion University of the Negev, Beer-Sheva, Israel
Abstract: The main objective of this work was to investigate in-silico predictions of physicochemical properties, in order to guide oral drug development by provisional biopharmaceutics classification system (BCS). Four in-silico methods were used to estimate LogP: group contribution (CLogP) using two different software programs, atom contribution (ALogP), and element contribution (KLogP). The correlations (r2) of CLogP, ALogP and KLogP versus measured LogP data were 0.97, 0.82, and 0.71, respectively. The classification of drugs with reported intestinal permeability in humans was correct for 64.3%–72.4% of the 29 drugs on the dataset, and for 81.82%–90.91% of the 22 drugs that are passively absorbed using the different in-silico algorithms. Similar permeability classification was obtained with the various in-silico methods. The in-silico calculations, along with experimental melting points, were then incorporated into a thermodynamic equation for solubility estimations that largely matched the reference solubility values. It was revealed that the effect of melting point on the solubility is minor compared to the partition coefficient, and an average melting point (162.7°C) could replace the experimental values, with similar results. The in-silico methods classified 20.76% (±3.07%) as Class 1, 41.51% (±3.32%) as Class 2, 30.49% (±4.47%) as Class 3, and 6.27% (±4.39%) as Class 4. In conclusion, in-silico methods can be used for BCS classification of drugs in early development, from merely their molecular formula and without foreknowledge of their chemical structure, which will allow for the improved selection, engineering, and developability of candidates. These in-silico methods could enhance success rates, reduce costs, and accelerate oral drug products development.
Keywords: biopharmaceutics classification system, in-silico, intestinal permeability, partition coefficient, solubility
Introduction
Oral administration is the most comfortable and widespread route of drug intake. Indeed, the majority of drug products worldwide are oral dosage forms.1,2 This makes gastrointestinal (GI) absorption a determining factor in the successful development of candidate bioactive molecules into marketable drug products. In 1995, Amidon et al introduced the Biopharmaceutics Classification System (BCS) as a scientific paradigm for drug absorption analyses.3 In principle, the BCS identified the solubility of the drug in the GI milieu, and its permeability across the intestinal epithelium, as the two key parameters in the intestinal absorption process.4–7 The BCS is often referred to in the context of drug regulation, as it was adopted by the US Food and Drug Administration (FDA) and European Medicines Association (EMA) as the basis for granting oral drug product manufacturers waivers from in-vivo bioequivalence studies.8,9 While the importance of biowaivers for cost reduction of drug products is undisputed, it is arguable that the BCS can be of even greater use in the development of new molecular entities (NMEs) into marketable drug products.10–12 Early BCS classification would allow selection and engineering of candidate molecules with favorable biopharmaceutical properties from the general pool, and selection of suitable polymorphic forms and salts. It may also indicate the strategy that should be adopted in formulation development, in order to improve the absorption of a candidate drug.2,11,13,14
BCS classification requires knowledge of a candidate’s solubility and permeability. Solubility can be estimated using established in-vitro methods such as the shake flask method.15–18 Permeability is ideally estimated by perfusion of intestinal segments in humans.19–21 However, these experiments are complicated, costly, and require the exposure of healthy human volunteers to drugs. Alternatively, permeability may be estimated using validated cell culture methods or animal intestinal perfusion studies.22–25 Both solubility and permeability estimations require synthesis and formulation of the drug, which are not available at early development phases, and are costly and time-consuming processes. It was therefore suggested that drugs can be provisionally classified by the BCS according to physicochemical estimations rather than by experiments.5,12,26–28 The main objective of this work was to study the utility of in-silico predictions of physicochemical properties, in order to guide the estimations of permeability, solubility and early BCS classification of drugs. The BCS classification was also compared to the Biopharmaceutics Drug Disposition Classification System (BDDCS).29 Our results demonstrate that in-silico calculations of physicochemical properties are useful for the early classification of drugs according to the BCS, thus may be extremely useful in the research and development (R&D) process of oral drug products.
Methods
Drug dataset
The World Health Organization (WHO) Model List of Essential Medicines, as well as lists of the most-sold drugs in Great Britain (GB), Israel (IL), Japan (JP), South Korea (KR), Spain (ES) and the United States (US) were used as sources for the drug database in our study. From these national lists, drugs were chosen for the compiled database in the study if they met the following two criteria: 1) immediate release solid oral dosage form; and 2) highest dose strength on the lists. Drug selection was from databases available at the following Internet web sites: www.fda.gov,www.medicines.org.uk, www.health.gov.il, www.portalfarma.com, jpora452.rsjp.net, www.kimsonline.co.kr, ezdrug.mfds.go.kr, and www.who.int.
Octanol/water partition coefficients
The partition coefficients between n-octanol and water for the unionized form of the drugs (LogP) were estimated based on several approaches. The BioLoom 5.0 software (BioByte, Claremont, CA, USA) provides a large database of empirical measurements of LogP (MLogP) from which relevant values for our drug dataset were obtained. This software, along with ChemDraw Ultra 8.0 software (CambridgeSoft, Cambridge, MA, USA) was also utilized for theoretical calculations of LogP, using algorithms based on the contributions of functional groups (CLogP) as developed and described by Hansch and Leo.30,31 Drug chemical structures were taken from the Merck Index.32 Moreover, LogP values were calculated using the Molecular Operating Environment (MOE) Version 2004.03 (Chemical Computing Group, Montreal, Quebec, Canada) developed by Crippen and Wildman, which is based on atomic contribution to hydrophobicity (ALogP).33,34 Finally, a simplified algorithm which relies on element contribution (KLogP) was derived merely from the drug’s molecular formula, while disregarding its chemical structure. The number of repetitions of each of the elements (eg, C, H, N, O, F, P, S, Cl, and Br) that are commonly present in organic compounds was calculated for the drugs on the compiled dataset, then fitted against the experimental MLogP by linear regression using the Microsoft Office Excel 2010 “LINEST” function, resulting in the equation:
KLogP = (nH × H) + (nC × C) + (nN × N) + (nO × O) + (nF × F) + (nP × P) + (nS × S) + (nCl × Cl) + (nBr × Br) |
where ni = number of type i atoms, and i is the partial contribution of the element: H =−0.0060, C =0.2463, N =−0.3163, O =−0.4515, F =−0.1033, P =−0.7753, S =0.0450, Cl =0.6534, and Br =−0.2781.
Correlation of partition coefficients with human jejunal permeability
The classification of the permeability was validated based on correlations between human intestinal permeability for 29 reference drugs 19–21,28,35 and the above-mentioned partition coefficients (CLogP, AlogP, or KLogP). Metoprolol was selected as the marker compound for permeability, since fraction dose absorbed of 95% was previously demonstrated.36–38 Hence, drugs that were similarly categorized by both partition coefficients values and human intestinal permeability (high/high or low/low respectively, with regards to metoprolol) are considered to be correctly classified, while drugs that were categorized as low/high and high/low by the two methods are termed false negatives and false positives, respectively.
Solubility
Literature solubility
Drug solubility data (mg/mL) were taken from the Merck Index,32 the United States Pharmacopeia (USP),39 the KFDA ezDrug Information, and the Japanese prescription information (available at the above-mentioned websites). Whenever significant dissimilarities were found between the above sources, the lowest value was selected for the calculations of dose number. For many drugs, the above-mentioned sources provide only a literal description rather than a specific value of solubility. In such cases, we adopted the USP solubility categorization (Table 1) and estimated the solubility to be the lower limit of the relevant solubility range. Drugs listed as practically insoluble (pi) were assigned using a more conservative value of 0.01 mg/mL rather than the USP definition of 0.1 mg/mL.
 | Table 1 Solubility definitions |
In-silico solubility of the drugs
The lipophilicity of a drug is inversely correlated to its aqueous solubility. This well-known fact was instrumental to the development of the thermodynamic equation for solubility of non-electrolytes in water by Amidon and Williams:40
Log Cs = 1.05 – 0.0099MP – PC |
where Cs is the molar aqueous solubility of the drug at 25°C, MP is the melting point (in °C) for the uncharged form of the drug molecule, and PC is the partition coefficient.
By placing in-silico partition coefficient estimations (CLogP, AlogP, or KLogP) in the equation, we were able to calculate the solubility for a total of 185 drugs on the dataset for which melting points were measured.
Calculations of dose number
The dimensionless dose-normalized solubility, dose number (D0), was calculated using the equation
|

where M0 is the maximum dose strength (mg), Cs is either the reference or in-silico estimated solubility (mg/mL), and V0 =250 mL, based on the FDA recommendation to take solid oral drug forms with a full glass of water.
Drugs with D0 ≤1 were classified as high-solubility, and vice versa.
Results
Correlation between experimental and in-silico partition coefficients
The measured (MLogP) and calculated partition coefficients for 154 drugs are listed in Table S1 (available from: https://www.dovepress.com/get_supplementary_file.php?f=supplementary_file_68909_1.pdf). Excellent correlations were obtained between either BioLoom 5.0 (BioByte, Claremont, CA, USA) or ChemDraw 8.0 (Perkin–Elmer, Cambridge, MA, USA) CLogP estimations and the measured values (r2=0.97). Good correlation with measured partition coefficients were also obtained with in-silico ALogP (r2=0.82). Lower yet acceptable correlation was obtained also with KLogP, which is based exclusively on molecular formula without information of the chemical structure (r2=0.71).
Human permeability and partition coefficient correlation
The experimentally-measured human jejunal permeability data for 29 drugs, and the in-silico partition coefficient values, appear in Table S2 (available from: https://www.dovepress.com/get_supplementary_file.php?f=supplementary_file_68909_2.pdf) and are depicted in Figure 1. Classification using the various methods was similar and correct for 19–21 drugs (64.3%–72.4%). The data show that the classification of passively-absorbed drugs was generally correct. However, the permeability of polar drugs that are known to be absorbed via carrier-mediated mechanisms, such as cephalexin,41,42 enalapril,43 levodopa,44 L-leucine,44,45 phenylalanine,46,47 and valacyclovir48,49 tended to be underestimated using partition coefficient. On the other hand, false high-permeability classification was obtained for losartan50,51 which is a substrate for efflux transporters (false positives). Figure 2 presents the permeability classification using the different in-silico methods versus human jejunal permeability when the seven drugs that are known substrates for transporters were omitted from the analysis. It can be seen that the accuracy of the predictions was improved to 81.8%–90.9%.
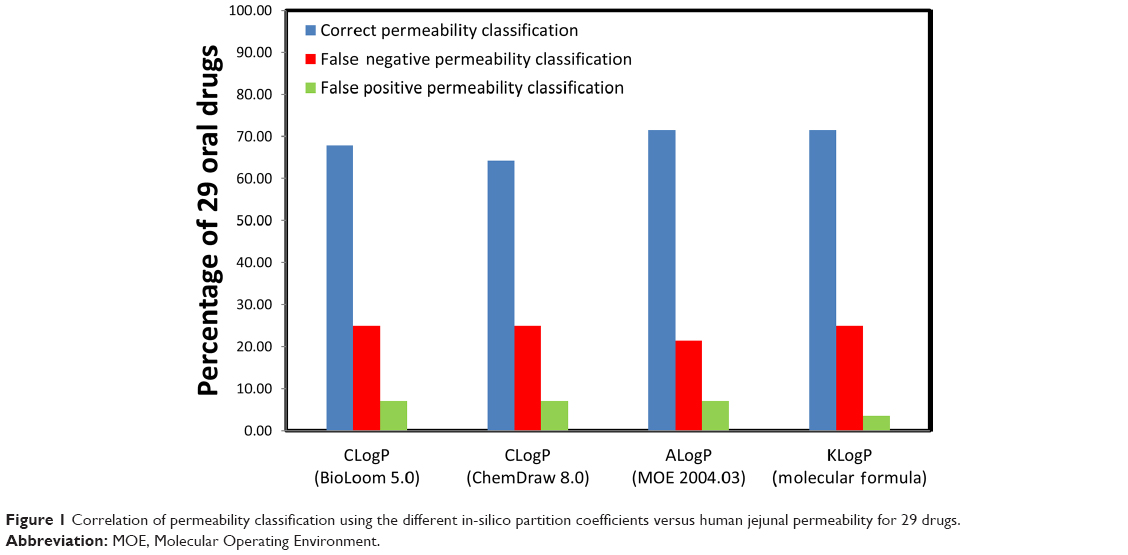 | Figure 1 Correlation of permeability classification using the different in-silico partition coefficients versus human jejunal permeability for 29 drugs. |
 | Figure 2 Correlation of permeability classification using the different in-silico partition coefficients versus human jejunal permeability for 22 drugs, following exclusion of drugs with known involvement of active influx/efflux transport processes in their intestinal absorption. |
Permeability, solubility, and provisional BCS classification
Permeability classification
Figure 3 illustrates the permeability classification of 363 drugs by comparing their CLogP, ALogP or KlogP values (1.49, 1.61, and 1.87, respectively) to those of metoprolol. The various in-silico partition coefficients produced similar permeability classifications; 57.02%–62.53% and 36.36%–39.94% of the drugs were classified as high- and low-permeability, respectively.
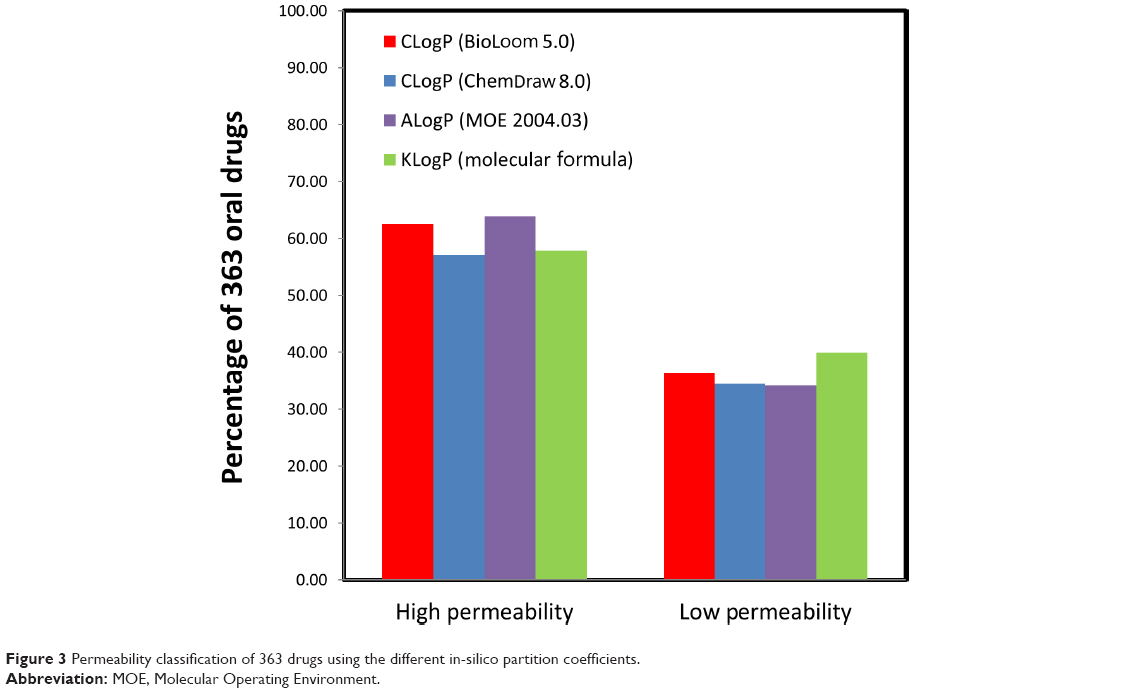 | Figure 3 Permeability classification of 363 drugs using the different in-silico partition coefficients. |
Solubility classification
The in-silico partition coefficient calculations and melting point data were used to estimate the solubility of 185 drugs. The maximum dose strengths, melting points, reference solubility, CLogP (BioLoom 5.0), KLogP, and the in-silico dose number (D0) calculated with both methods are listed in Table S3 (available from: https://www.dovepress.com/get_supplementary_file.php?f=supplementary_file_68909_3.pdf). The solubility categorization (Table 1) based on the various in-silico estimations versus literature solubility data are shown in Figure 4. In general, solubility estimations with the various partition coefficients matched the reference solubility values. However, solubility estimations based on KLogP significantly underestimated the number of practically insoluble drugs, and overestimated the number of very slightly soluble drugs (~19% difference). It is noteworthy that in-silico solubility estimations with the average melting point (162.7°C) versus experimental melting points produced similar results, with a maximal difference of ~6%. Figure 5 depicts a theoretical plot of the dependency of solubility on partition coefficient and melting point. It is evident from the figure that the effect of melting point on the solubility is very small compared to the effect of LogP. This theoretical plot explains the similar solubility categorization obtained with experimental versus average melting point, shown in Figure 4, indicating that the use of average melting point value in solubility estimations may not lead to significant loss of accuracy.
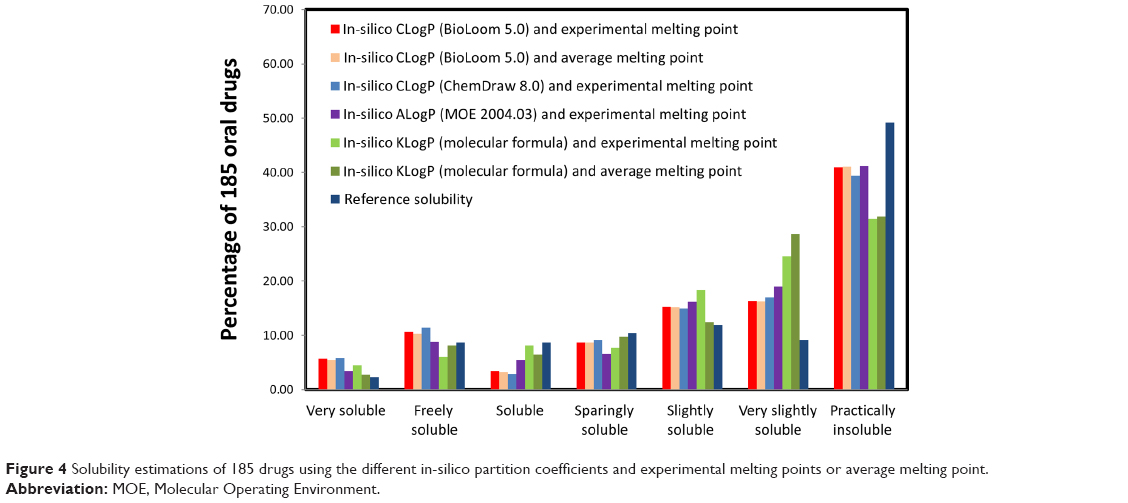 | Figure 4 Solubility estimations of 185 drugs using the different in-silico partition coefficients and experimental melting points or average melting point. |
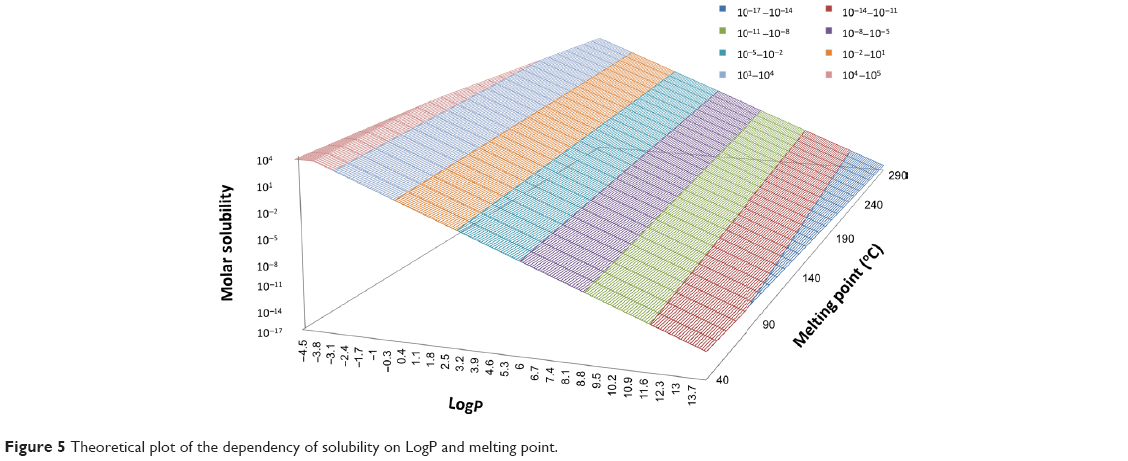 | Figure 5 Theoretical plot of the dependency of solubility on LogP and melting point. |
Solubility BCS classification was assigned for a given drug according to its dose number (D0), which was calculated using the maximal dose. This puts a theoretical limitation on the early assignment of the BCS solubility class, as the dosage range of any drug can only be assessed later on. Figure 6 plots the dependency of the dose number on solubility and the maximal dose. This plot reveals that in the maximal dose range commonly found for drugs and drug-like molecules (0.005–1,000 mg) any solubility value above 10 mg/mL would indicate a dose number ≤1, and hence a BCS high-solubility classification. Hence for solubility categories very soluble, freely soluble, soluble, and slightly soluble drugs (Table 1), a BCS high-solubility classification can be assigned. For drugs with lower solubility values, a theoretical dosage range can be used for the provisional solubility classification, as was previously shown.12,52
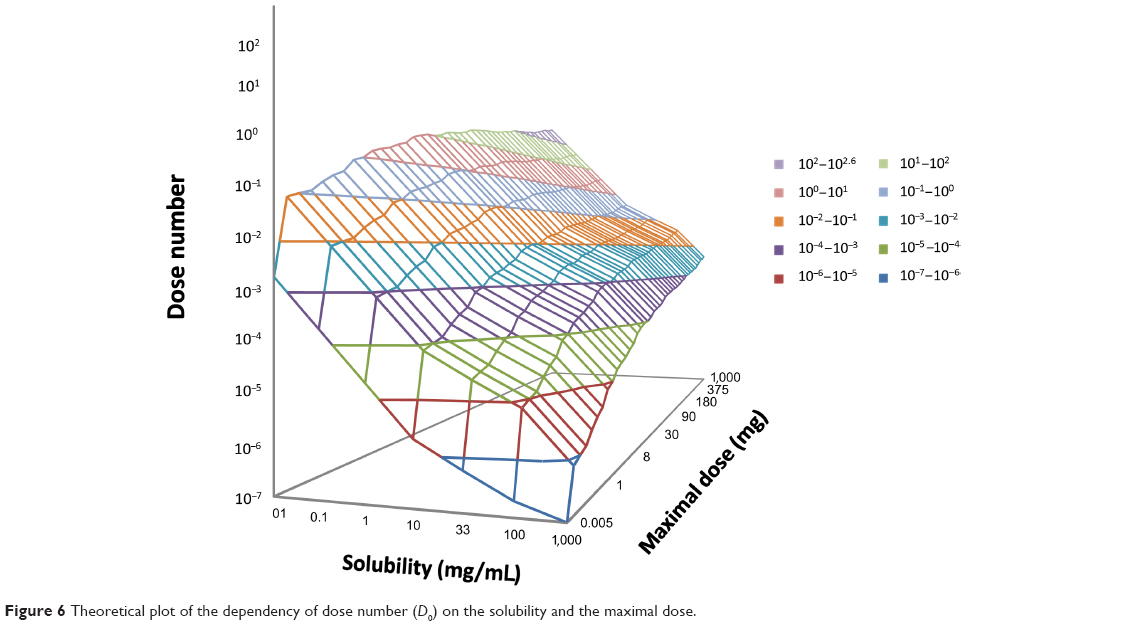 | Figure 6 Theoretical plot of the dependency of dose number (D0) on the solubility and the maximal dose. |
Provisional BCS classification
Provisional BCS classifications with the different in-silico methods are listed in Table S4 (available from: https://www.dovepress.com/get_supplementary_file.php?f=supplementary_file_68909_4.pdf) and shown in Figure 7. The distribution of LogP, melting point, and maximal dose was analyzed for drugs classified by the CLogP (BioLoom 5.0) and KLogP methods, and illustrated in Figure 8. The classification and distribution of drug properties in each BCS class as defined by Amidon et al3 are presented in Figure 9. It can be seen that the classification using the different approaches produced comparable results: on average, 20.76% (±3.07%) of drugs were classified as Class 1, 41.51% (±3.32%) as Class 2, 30.49% (±4.47%) as Class 3, and 6.27% (±4.39%) as Class 4. LogP values of drugs from Class 1–2 were higher than Class 3–4, and the distribution of values was narrower in Class 1 and Class 4 compared to Class 2 and 3 (Figure 8A). Melting point values had quite similar distributions in Class 1, Class 2, and Class 3, between the first and third quartiles (~107°C–208°C). The melting point values of Class 4 drugs were distributed in a significantly higher range, ~170°C–270°C (Figure 8B). Maximal dose range between the first and third quartiles was the lowest for Class 1 drugs (~1–10 mg), medium for Classes 2 and 3 (~25–250 mg), and highest for Class 4 drugs, with values ~300–600 mg (Figure 8C).
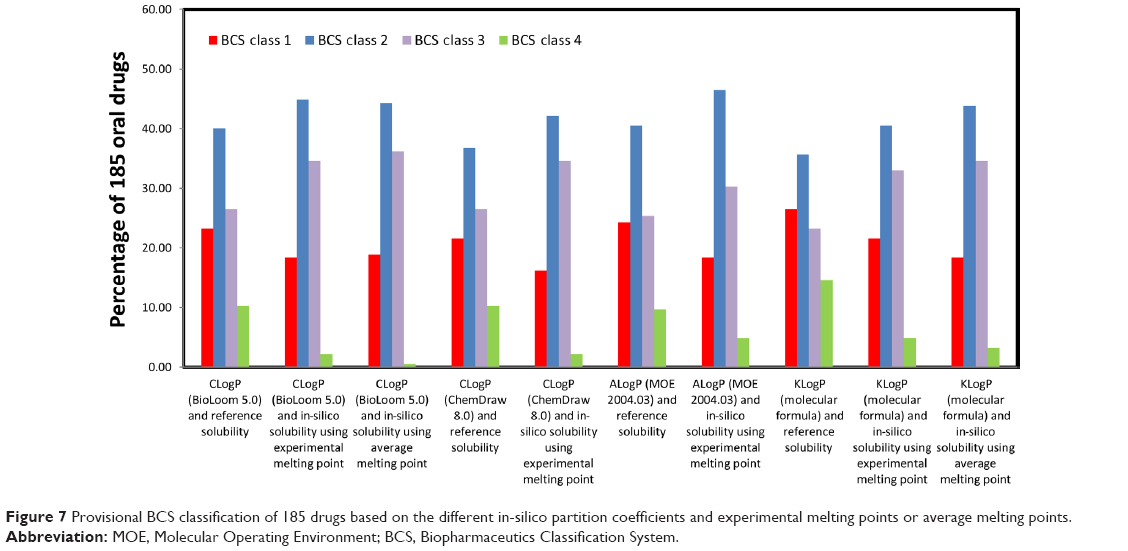 | Figure 7 Provisional BCS classification of 185 drugs based on the different in-silico partition coefficients and experimental melting points or average melting points. |
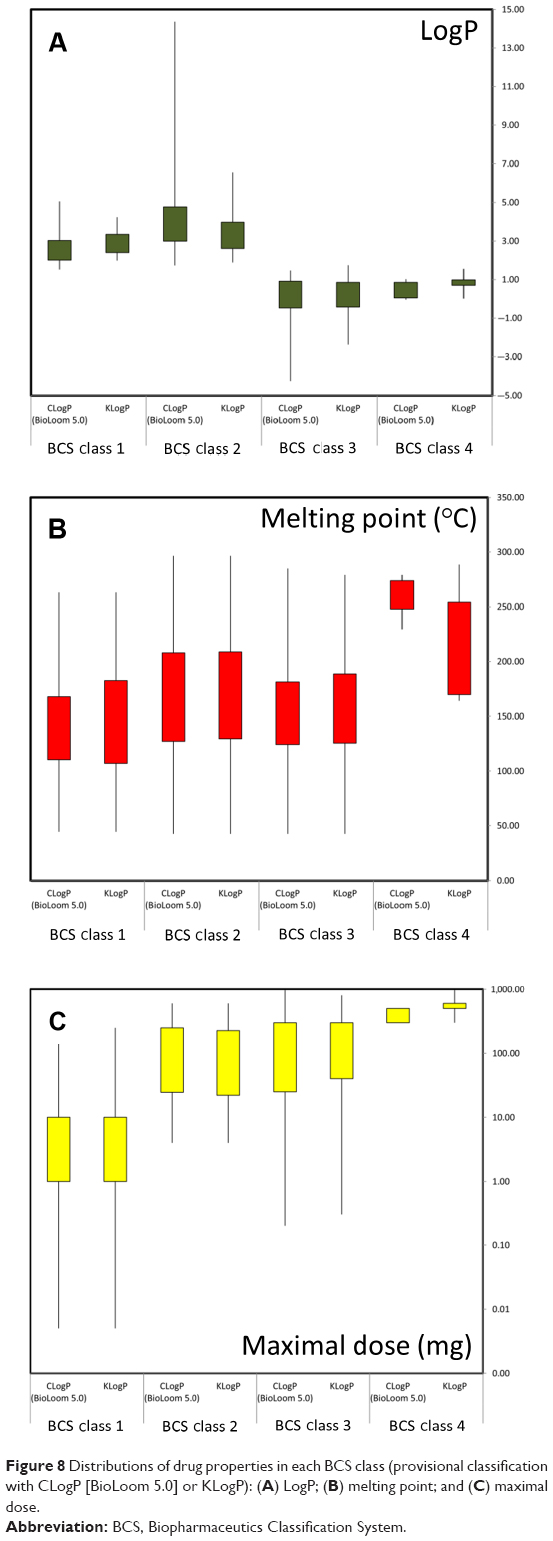 | Figure 8 Distributions of drug properties in each BCS class (provisional classification with CLogP [BioLoom 5.0] or KLogP): (A) LogP; (B) melting point; and (C) maximal dose. |
 | Figure 9 The BCS as defined by Amidon et al3 and the classification and distribution of drug properties in each BCS class. |
BDDCS and in-silico partition coefficient
We examined the correlation between our in-silico BCS classification and the BDDCS-based classification for 140 drugs29 and the results are shown in Figure 10. The BDDCS classified more drugs as Class 1 and fewer drugs as Class 3 in comparison to the provisional in-silico BCS classification (~10% difference). This observation may be attributed to the lower cutoff point (70%) used by Benet for metabolism, compared to the overly conservative permeability standard (metoprolol).38,53
 | Figure 10 Provisional BCS classification with in-silico methods (average) of 140 drugs versus their BDDCS classification. |
Discussion
Permeability classification
It has been shown before that the permeability of drugs can be predicted in-silico using calculable physicochemical drug properties. Kasim et al estimated the permeability of 123 immediate release oral drug products listed in the WHO List of Essential Drugs using octanol/water partition coefficient calculations.54 This work was later extended by Takagi et al to include the most popular oral immediate release drug products in the United States, Great Britain, Spain and Japan.55 The CLogP is a well-established and accurate method to assess the octanol/water partition coefficient (LogP). However, this algorithm demands foreknowledge of several intramolecular factors, including hydrogen bonding interactions and electronic and steric effects. In this work, In addition to CLogP, we used a simpler atomic LogP method, ALogP, that allowed some intramolecular factors to be neglected. More importantly, we examined the simplified KLogP method to calculate LogP, that is based solely on the molecular formula of the drug, while disregarding its chemical structure.
Provisional permeability classification using all four different in-silico approaches had comparable accuracy versus human jejunal permeability of 29 drugs (64.3%–72.4% correct classifications) as illustrated in Figure 1. In general, drugs that permeate the intestinal wall chiefly via passive transcellular diffusion were assigned the correct permeability classification by the different in-silico partition coefficients. In contrast, in-silico approaches failed to classify the permeability of drugs that were recorded as having significant involvement of active transport processes (either influx or efflux) in their absorption. Indeed, when such drugs were excluded from the analysis, accuracy was significantly improved (81.82%–90.91%, Figure 2). It is evident from these results that while passive permeability can be accurately predicted with in-silico LogP calculations, a separate module should be included in future intestinal permeation models in order to account for carrier-mediated processes.
Similar permeability classifications were obtained with the various algorithms for the 363 drugs on the database, with a maximal difference of ~5% (Figure 3). The results suggest that the simplified KLogP estimations are as reliable as the more sophisticated methods for provisional permeability classification.
The simplified approach chosen in this work was not without its limitations. First, in-silico approaches generally failed to classify the permeability of drugs that are actively absorbed via transporters (Figure 1). This was to be expected, as carrier-mediated processes depend on specific drug–protein interactions rather than lipophilicity. Moreover, our model did not account for other factors that may affect absorption, such as segmental-dependent permeability. Evidently, future models will have to be able to capture the full complexity of the intestinal tract in order to minimize the risk of false negative and false positive predictions, both of which may result in inappropriate development strategies and allocation of resources.
Solubility classification
Solubility can be experimentally determined more readily than permeability by using established in-vitro studies such as the shake flask method. However, such methods still require synthesis of the compound, which is often complicated, time consuming, costly, and may be futile if the molecule proves to be inadequate for further development. Therefore, we estimated the solubility of the drugs in our dataset using the inverse correlation between the lipophilicity of a drug and its molar solubility as described by Amidon and Williams.40 We chose this simplified approach over more complex models in order to demonstrate that reliable early BCS classification of drugs can be achieved even with minimal input data. The solubility estimations of 185 drugs with the various partition coefficients generally matched the reference solubility values. However, solubility estimations based on KlogP significantly underestimated the number of practically insoluble drugs and overestimated the number of very slightly soluble drugs (~19% difference, as shown in Figure 4). These results indicate that more sophisticated approaches for the estimation of LogP, and possibly additional physicochemical properties, are required for more refined estimations of borderline solubility.
In addition to the partition coefficient, solubility in-silico estimations require foreknowledge of the melting point. This puts a theoretical limitation on early solubility estimation, as currently, the melting point must be empirically measured. However, our theoretical plot of the dependency of solubility on partition coefficient and melting point (Figure 5) revealed that the effect of the melting point is minor in comparison to the partition coefficient, suggesting that the average melting point may be used as a substitute for the measured melting point in solubility estimations without significant loss of accuracy. Indeed, solubility estimations using the average melting point value (162.7°C) versus experimental melting points produced similar results, with a maximal difference of ~6% (Figure 4). Recent works suggest that melting point values can also be calculated in-silico. While current methods for melting point calculations are still limited, such algorithms may be incorporated to solubility models in the future, further refining them and allowing for accurate solubility predictions even in cases of extreme melting point values.56–58
An additional constraint for early solubility classification is the maximal allowed dose, as it can only be assessed in later R&D stages. A plot of the dependency of the dose number on solubility and the maximal dose (Figure 6) revealed that in the common dose range found for drugs (0.005–1,000 mg), any solubility value above 10 mg/mL would indicate a dose number ≤1. Hence drugs that were estimated as very soluble, freely soluble, soluble or slightly soluble can be provisionally assigned as high-solubility compounds. For drugs with lower solubility estimations, a theoretical dosage range can be used for solubility classification, as was previously shown.12,52
Provisional BCS classification
The provisional BCS classifications with the different in-silico approaches for 185 drugs produced comparable results; on average, 20.76% (±3.07%) of drugs were classified as Class 1, 41.51% (±3.32%) as Class 2, 30.49% (±4.47%) as Class 3, and 6.27% (±4.39%) as Class 4 (Figure 7). The variability between the different methods in assigning drugs to Class 4 was markedly higher than in the other classes (% coefficient of variation [CV] of 70% versus 7%–15%, respectively). The relatively small sample of Class 4 drugs in our dataset prevents us from conclusively determining the reason. However, our analysis of the distribution of physicochemical properties (Figure 8) may provide some insights: Class 4 drugs had a low and narrow range of partition coefficient values (Figure 8A) with significantly higher ranges of melting points (Figure 8B) and maximal doses (Figure 8C) compared to the other drug classes. These results indicate that BCS Class 4 assignments are the product of several unfavorable traits: a medium–low octanol/water partition ratio, a high melting point, and a high maximal dose. The difficulty to accurately estimate those traits in the earlier R&D stages may account for the poor prediction of Class 4 drugs.
It should be noted that the dataset was compiled exclusively from marketed drugs, and hence does not include compounds at different R&D stages. This could cause an overrepresentation of Class 1, which has favorable developability potential, while the more challenging classes of drugs may be underrepresented, potentially increasing the risk of false positive predictions.
BCS and BDDCS
In 2005 Wu and Benet developed the BDDCS as a complementary system to the BCS.59 The BDDCS classifies drugs according to their fraction dose metabolized rather than their intestinal permeability. It was suggested that these two classification systems are closely linked: the permeation of drugs across cellular membranes makes them readily available for biotransformation by metabolic enzymes; therefore, extensively-metabolized drugs are considered to be highly permeable, and drugs that are mainly excreted unchanged in the urine are low permeability compounds. While the BCS low/high permeability benchmark was set by the FDA as the permeability value of metoprolol, the poor/extensive metabolism benchmark varied from 50% to 70% or 90% over the years.52,60
In a recent publication, Benet noted that passive transcellular permeability is the main predictor of the fraction of drug metabolized.61 Therefore, provisional BCS classifications that are based on LogP calculations are expected to be well-correlated with BDDCS-based classifications. Takagi et al revealed an excellent correlation between their BCS classification of 168 drugs and the respective BDDCS classification for Classes 2 and 4, but lower correlation for Classes 1 and 3.55 Our work is in corroboration with this trend; the provisional in-silico BCS classification underestimated the number of Class 1 drugs while overestimating the number of Class 3 drugs on the database when compared to BDDCS. This trend may be attributed to the lower cutoff point used by Benet for metabolism (70%) compared to the overly conservative permeability marker used in our work (metoprolol).1,38,53 Indeed, when other, lower permeability cutoff standards were selected by Takagi et al the correlation between BDDCS and BCS was significantly enhanced.55
In development of NMEs, the BDDCS has important implications within such areas as brain distribution, enzyme/transporter interplay, and drug–drug interactions.60,61 While metabolism-based classification may misclassify drugs that are excreted unchanged into urine and bile but are highly absorbed (eg, amoxicillin, chloroquine, lomefloxacin, sotalol, trimethoprim, and zalcitabine), classification based merely on LogP calculations may be unable to predict drug transport when active influx/efflux processes are involved. For this reason, the BCS and BDDCS should be regarded as complementary rather than competing approaches.
Conclusion
This work demonstrates that in-silico calculations of physicochemical properties can be used in reliable estimations of solubility and permeability, and in early BCS classification. This classification can be derived from the most basic molecular data; the types of elements and their repetitions in the molecule; the average melting point; and estimations of the dosage range. Thus, drug candidates can be provisionally classified at the very earliest stages of development.
Purely in-silico-based BCS classification may be extremely useful throughout the R&D process: at the earliest stages of drug development, BCS classification would allow selection or engineering of candidate molecules with favorable biopharmaceutical properties for further development.2,11–14 Once a candidate molecule is selected and provisionally classified, appropriate polymorph and salt form can be selected, especially for a low solubility drug.16,62 Formulators can then use the provisional BCS classification to plan a strategy to improve its intestinal absorption; if the candidate molecule is classified as low solubility, it may benefit from formulation methods using nanoparticles,63,64 co-solvents,17,65,66 lipid-based formulations,67–70 cyclodextrin complexes,18,71–73 and other techniques. Low permeability of candidate molecules may be overcome by absorption enhancers.11,25,74,75 However, their unspecific nature may increase the absorption of toxins and other undesirable molecules, thus this approach is often ruled out for safety reasons.2,76 Targeting low permeability molecules to active influx transporters such as Pept 1 may be a more effective strategy for improving their absorption, as was demonstrated for several antiviral prodrugs.47,77,78 Class 4 compounds are extremely challenging to develop, and would require both solubility and permeability improvement approaches.
Lastly, BCS classification could be helpful in assessing the relevance of food–drug interactions. Taking the drug postprandial may delay the absorption of Class 1 drugs, since the rate-limiting step of intestinal absorption for these drugs is gastric emptying. Food intake promotes bile and pancreatic secretions that enable the solubilization and dissolution of low solubility (Class 2 and 4) compounds, and the enhanced viscosity of the gut content may prolong the dissolution and disintegration time of Class 3 drug products.79 Food intake also increases gastric pH, resulting in enhanced or decreased dissolution of acidic or basic drugs, respectively.2,11,80
In conclusion, simplified in-silico estimations of LogP, together with an average melting point and estimated dosage range, can be used for early provisional BCS classification of drugs from their molecular formula. This will allow selection/engineering of candidate molecules with favorable properties; selection of their appropriate polymorphic forms and salts; definition/optimization of their formulation needs; and detection of potential food–drug interactions. The expected overall effect of early BCS classification is enhanced success rates, reduced costs, and accelerated development process of oral drug products.
Disclosure
The authors have no conflicts of interest in this work.
References
Dahan A, Lennernäs H, Amidon GL. The fraction dose absorbed, in humans, and high jejunal human permeability relationship. Mol Pharm. 2012;9(6):1847–1851. | ||
Lennernäs H, Abrahamsson B. The use of biopharmaceutic classification of drugs in drug discovery and development: current status and future extension. J Pharm Pharmacol. 2005;57(3):273–285. | ||
Amidon GL, Lennernäs H, Shah VP, Crison JR. A theoretical basis for a biopharmaceutic drug classification: the correlation of in vitro drug product dissolution and in vivo bioavailability. Pharm Res. 1995;12(3): 413–420. | ||
Amidon KS, Langguth P, Lennernäs H, Yu LX, Amidon GL. Bioequivalence of oral products and the biopharmaceutics classification system: science, regulation, and public policy. Clin Pharmacol Ther. 2011; 90(3):467–470. | ||
Dahan A, Miller JM, Amidon GL. Prediction of solubility and permeability class membership: provisional BCS classification of the world’s top oral drugs. AAPS J. 2009;11(4):740–746. | ||
Löbenberg R, Amidon GL. Modern bioavailability, bioequivalence and biopharmaceutics classification system. New scientific approaches to international regulatory standards. Eur J Pharm Biopharm. 2000; 50(1):3–12. | ||
Martinez MN, Amidon GL. A mechanistic approach to understanding the factors affecting drug absorption: a review of fundamentals. J Clin Pharmacol. 2002;42(6):620–643. | ||
Center for Drug Evaluation and Research, US Food and Drug Administration. Guidance for Industry: Waiver of In Vivo Bioavailability and Bioequivalence Studies for Immediate-release Solid Oral Dosage Forms Based on a Biopharmaceutics Classification System. Rockville (MD): FDA; 2000. | ||
Yu LX, Amidon G, Polli J, et al. Biopharmaceutics classification system: the scientific basis for biowaiver extensions. Pharm Res. 2002; 19(7):921–925. | ||
Cook J, Addicks W, Wu Y. Application of the biopharmaceutical classification system in clinical drug development–an industrial view. AAPS J. 2008;10(2):306–310. | ||
Ku MS. Use of the biopharmaceutical classification system in early drug development. AAPS J. 2008;10(1):208–212. | ||
Pham–The H, Garrigues T, Bermejo M, González–Álvarez I, Monteagudo MC, Cabrera–Pérez MÁ. Provisional classification and in silico study of biopharmaceutical system based on caco-2 cell permeability and dose number. Mol Pharm. 2013;10(6):2445–2461. | ||
Dahan A, Wolk O, Kim YH, et al. Purely in silico BCS classification: science based quality standards for the world’s drugs. Mol Pharm. 2013; 10(11):4378–4390. | ||
Lennernäs H, Aarons L, Augustijns P, et al. Oral biopharmaceutics tools – time for a new initiative – an introduction to the IMI project OrBiTo. Eur J Pharm Sci. 2014;16(57):292–299. | ||
Fairstein M, Swissa R, Dahan A. Regional-dependent intestinal permeability and BCS classification: elucidation of pH-related complexity in rats using pseudoephedrine. AAPS J. 2013;15(2):589–597. | ||
Miller JM, Beig A, Carr RA, Spence JK, Dahan A. A win–win solution in oral delivery of lipophilic drugs: supersaturation via amorphous solid dispersions increases apparent solubility without sacrifice of intestinal membrane permeability. Mol Pharm. 2012;9(7):2009–2016. | ||
Miller JM, Beig A, Carr RA, Webster GK, Dahan A. The solubility–permeability interplay when using cosolvents for solubilization: revising the way we use solubility-enabling formulations. Mol Pharm. 2012;9(3): 581–590. | ||
Miller JM, Dahan A. Predicting the solubility–permeability interplay when using cyclodextrins in solubility-enabling formulations: model validation. Int J Pharm. 2012;430(1–2):388–391. | ||
Lennernäs H. Human intestinal permeability. J Pharm Sci. 1998;87(4): 403–410. | ||
Lennernäs H. Regional intestinal drug permeation: biopharmaceutics and drug development. Eur J Pharm Sci. 2014;16(57):333–341. | ||
Lennernäs H. Human in vivo regional intestinal permeability: importance for pharmaceutical drug development. Mol Pharm. 2014;11(1):12–23. | ||
Dahan A, Amidon GL. MRP2 mediated drug–drug interaction: indomethacin increases sulfasalazine absorption in the small intestine, potentially decreasing its colonic targeting. Int J Pharm. 2010;386(1–2):216–220. | ||
Dahan A, Sabit H, Amidon GL. The H2 receptor antagonist nizatidine is a P-glycoprotein substrate: characterization of its intestinal epithelial cell efflux transport. AAPS J. 2009;11(2):205–213. | ||
Dahan A, Sabit H, Amidon GL. Multiple efflux pumps are involved in the transepithelial transport of colchicine: combined effect of P-glycoprotein and multidrug resistance-associated protein 2 leads to decreased intestinal absorption throughout the entire small intestine. Drug Metab Dispos. 2009;37(10):2028–2036. | ||
Miller JM, Dahan A, Gupta D, Varghese S, Amidon GL. Enabling the intestinal absorption of highly polar antiviral agents: ion-pair facilitated membrane permeation of zanamivir heptyl ester and guanidino oseltamivir. Mol Pharm. 2010;7(4):1223–1234. | ||
Lipinski CA. Drug-like properties and the causes of poor solubility and poor permeability. J Pharmacol Toxicol Methods. 2000;44(1): 235–249. | ||
Lipinski CA, Lombardo F, Dominy BW, Feeney PJ. Experimental and computational approaches to estimate solubility and permeability in drug discovery and development settings. Adv Drug Deliv Rev. 2001; 46(1–3):3–26. | ||
Winiwarter S, Ax F, Lennernäs H, Hallberg A, Pettersson C, Karlén A. Hydrogen bonding descriptors in the prediction of human in vivo intestinal permeability. J Mol Graph Model. 2003;21(4):273–287. | ||
Benet LZ, Broccatelli F, Oprea TI. BDDCS applied to over 900 drugs. AAPS J. 2011;13(4):519–547. | ||
Hansch C, Leo AJ. Substituent Constants for Correlation Analysis in Chemistry and Biology. New York: Wiley; 1979. | ||
Leo AJ. Calculating log Poct from structures. Chemical Reviews. 1993; 93(4):1281–1306. | ||
O’Neil MJ, editor. The Merck Index: An Encyclopedia of Chemicals, Drugs, and Biologicals, 13th ed. Rahway (NJ): Merck; 2001. | ||
Ghose AK, Crippen GM. Atomic physicochemical parameters for three-dimensional-structure-directed quantitative structure-activity relationships. 2. Modeling dispersive and hydrophobic interactions. J Chem Inf Comput Sci. 1987;27(1):21–35. | ||
Wildman SA, Crippen GM. Prediction of physicochemical parameters by atomic contributions. J Chem Inf Comput Sci. 1999;39(5):868–873. | ||
Lennernäs H. Intestinal permeability and its relevance for absorption and elimination. Xenobiotica. 2007;37(10–11):1015–1051. | ||
Dahan A, Miller JM, Hilfinger JM, et al. High-permeability criterion for BCS classification: segmental/pH dependent permeability considerations. Mol Pharm. 2010;7(5):1827–1834. | ||
Regardh CG, Borg KO, Johansson R, Johnsson G, Palmer L. Pharmacokinetic studies on the selective beta1-receptor antagonist metoprolol in man. J Pharmacokinet Biopharm. 1974;2(4):347–364. | ||
Zur M, Gasparini M, Wolk O, Amidon GL, Dahan A. The low/high BCS permeability class boundary: physicochemical comparison of metoprolol and labetalol. Mol Pharm. 2014;11(5):1707–1714. | ||
Klasco RK, editor. USP DI® Drug Information for the Health Care Professional. Greenwood Village (CO): Thomson Micromedex; 2004. | ||
Amidon GL, Williams NA. A solubility equation for non-electrolytes in water. International Journal of Pharmaceutics. 1982;11(3):249–256. | ||
Chu XY, Bleasby K, Yabut J, et al. Transport of the dipeptidyl peptidase-4 inhibitor sitagliptin by human organic anion transporter 3, organic anion transporting polypeptide 4C1, and multidrug resistance P-glycoprotein. J Pharmacol Exp Ther. 2007;321(2):673–683. | ||
Ganapathy ME, Brandsch M, Prasad PD, Ganapathy V, Leibach FH. Differential recognition of beta-lactam antibiotics by intestinal and renal peptide transporters, PEPT 1 and PEPT 2. J Biol Chem. 1995; 270(43):25672–25677. | ||
Han HK, Rhie JK, Oh DM, et al. CHO/hPEPT1 cells overexpressing the human peptide transporter (hPEPT1) as an alternative in vitro model for peptidomimetic drugs. J Pharm Sci. 1999;88(3):347–350. | ||
Kanai Y, Endou H. Functional properties of multispecific amino acid transporters and their implications to transporter-mediated toxicity. J Toxicol Sci. 2003;28(1):1–17. | ||
Friedman DI, Amidon GL. Oral absorption of peptides: influence of pH and inhibitors on the intestinal hydrolysis of leu-enkephalin and analogues. Pharm Res. 1991;8(1):93–96. | ||
Amidon GL, Chang M, Fleisher D, Allen R. Intestinal absorption of amino acid derivatives: importance of the free alpha-amino group. J Pharm Sci. 1982;71(10):1138–1141. | ||
Dahan A, Khamis M, Agbaria R, Karaman R. Targeted prodrugs in oral drug delivery: the modern molecular biopharmaceutical approach. Expert Opin Drug Deliv. 2012;9(8):1001–1013. | ||
Yang, B, Hu Y, Smith DE. Impact of peptide transporter 1 on the intestinal absorption and pharmacokinetics of valacyclovir after oral dose escalation in wild-type and PepT1 knockout mice. Drug Metab Dispos. 2013;41(10):1867–1874. | ||
Yang B, Smith DE. Significance of peptide transporter 1 in the intestinal permeability of valacyclovir in wild-type and PepT1 knockout mice. Drug Metab Dispos. 2013;41(3):608–614. | ||
Soldner A, Benet LZ, Mutschler E, Christians U. Active transport of the angiotensin-II antagonist losartan and its main metabolite EXP 3174 across MDCK-MDR1 and caco-2 cell monolayers. Br J Pharmacol. 2000;129(6):1235–1243. | ||
Weiss J, Sauer A, Divac N, et al. Interaction of angiotensin receptor type 1 blockers with ATP-binding cassette transporters. Biopharm Drug Dispos. 2010;31(2–3):150–161. | ||
Broccatelli F, Cruciani G, Benet LZ, Oprea TI. BDDCS class prediction for new molecular entities. Mol Pharm. 2012;9(3):570–580. | ||
Incecayir T, Tsume Y, Amidon GL. Comparison of the permeability of metoprolol and labetalol in rat, mouse, and Caco-2 cells: use as a reference standard for BCS classification. Mol Pharm. 2013;10(3): 958–966. | ||
Kasim NA, Whitehouse M, Ramachandran C, et al. Molecular properties of WHO essential drugs and provisional biopharmaceutical classification. Mol Pharm. 2004;1(1):85–96. | ||
Takagi T, Ramachandran C, Bermejo M, Yamashita S, Yu LX, Amidon GL. A provisional biopharmaceutical classification of the top 200 oral drug products in the United States, Great Britain, Spain, and Japan. Mol Pharm. 2006;3(6):631–643. | ||
Bergström CAS, Norinder U, Luthman K, Artursson P. Molecular descriptors influencing melting point and their role in classification of solid drugs. J Chem Inf Comput Sci. 2003;43(4):1177–1185. | ||
Preiss U, Bulut S, Krossing I. In silico prediction of the melting points of ionic liquids from thermodynamic considerations: a case study on 67 salts with a melting point range of 337 degrees C. J Phys Chem B. 2010;114(34):11133–11140. | ||
Zhang Y, Maginn EJ. A comparison of methods for melting point calculation using molecular dynamics simulations. J Chem Phys. 2012; 136(14):144116. | ||
Wu CY, Benet LZ. Predicting drug disposition via application of BCS: transport/absorption/elimination interplay and development of a biopharmaceutics drug disposition classification system. Pharm Res. 2005;22(1):11–23. | ||
Custodio JM, Wu CY, Benet LZ. Predicting drug disposition, absorption/elimination/transporter interplay and the role of food on drug absorption. Adv Drug Deliv Rev. 2008;60(6):717–733. | ||
Benet LZ. The role of BCS (biopharmaceutics classification system) and BDDCS (biopharmaceutics drug disposition classification system) in drug development. J Pharm Sci. 2013;102(1):34–42. | ||
Dahan A, Beig A, Ioffe–Dahan V, Agbaria R, Miller J. The twofold advantage of the amorphous form as an oral drug delivery practice for lipophilic compounds: increased apparent solubility and drug flux through the intestinal membrane. AAPS J. 2013;15(2):347–353. | ||
Dahan A, Miller JM. The solubility-permeability interplay and its implications in formulation design and development for poorly soluble drugs. AAPS J. 2012;14(2):244–251. | ||
Morgen M, Bloom C, Beyerinck R, et al. Polymeric nanoparticles for increased oral bioavailability and rapid absorption using celecoxib as a model of a low-solubility, high-permeability drug. Pharm Res. 2012; 29(2):427–440. | ||
Beig A, Miller JM, Dahan A. Accounting for the solubility–permeability interplay in oral formulation development for poor water solubility drugs: the effect of PEG-400 on carbamazepine absorption. Eur J Pharm Biopharm. 2012;81(2):386–391. | ||
Miller JM, Beig A, Krieg BJ, et al. The solubility–permeability interplay: mechanistic modeling and predictive application of the impact of micellar solubilization on intestinal permeation. Mol Pharm. 2011;8(5): 1848–1856. | ||
Dahan A, Hoffman A. Use of a dynamic in vitro lipolysis model to rationalize oral formulation development for poor water soluble drugs: Correlation with in vivo data and the relationship to intra-enterocyte processes in rats. Pharm Res. 2006;23(9):2165–2174. | ||
Dahan A, Hoffman A. The effect of different lipid based formulations on the oral absorption of lipophilic drugs: the ability of in vitro lipolysis and consecutive ex vivo intestinal permeability data to predict in vivo bioavailability in rats. Eur J Pharm Biopharm. 2007;67(1):96–105. | ||
Dahan A, Hoffman A. Rationalizing the selection of oral lipid based drug delivery systems by an in vitro dynamic lipolysis model for improved oral bioavailability of poorly water soluble drugs. J Control Release. 2008;129(1):1–10. | ||
Koga K, Takarada N, Takada K. Nano-sized water-in-oil-in-water emulsion enhances intestinal absorption of calcein, a high solubility and low permeability compound. Eur J Pharm Biopharm. 2010;74(2): 223–232. | ||
Beig A, Agbaria R, Dahan A. Oral delivery of lipophilic drugs: the tradeoff between solubility increase and permeability decrease when using cyclodextrin-based formulations. PLoS One. 2013;8(7):e68237. | ||
Beig A, Miller JM, Dahan A. The interaction of nifedipine with selected cyclodextrins and the subsequent solubility-permeability trade-off. Eur J Pharm Biopharm. 2013;85(3):1293–1299. | ||
Dahan A, Miller JM, Hoffman A, Amidon GE, Amidon GL. The solubility–permeability interplay in using cyclodextrins as pharmaceutical solubilizers: mechanistic modeling and application to progesterone. J Pharm Sci. 2010;99(6):2739–2749. | ||
Miller JM, Dahan A, Gupta D, Varghese S, Amidon GL. Quasi-equilibrium analysis of the ion-pair mediated membrane transport of low-permeability drugs. J Control Release. 2009;137(1):31–37. | ||
Sharma P, Varma MV, Chawla HP, Panchagnula R. In situ and in vivo efficacy of peroral absorption enhancers in rats and correlation to in vitro mechanistic studies. Farmaco. 2005;60(11–12):874–883. | ||
Sun J, Dahan A, Amidon GL. Enhancing the intestinal absorption of molecules containing the polar guanidino functionality: a double-targeted prodrug approach. J Med Chem. 2010;53(2):624–632. | ||
Gupta D, Varghese Gupta S, Dahan A, et al. Increasing oral absorption of polar neuraminidase inhibitors: a prodrug transporter approach applied to oseltamivir analogue. Mol Pharm. 2013;10(2):512–522. | ||
Varghese Gupta S, Gupta D, Sun J, et al. Enhancing the intestinal membrane permeability of zanamivir: a carrier mediated prodrug approach. Mol Pharm. 2011;8(6):2358–2367. | ||
Radwan A, Amidon GL, Langguth P. Mechanistic investigation of food effect on disintegration and dissolution of BCS class III compound solid formulations: the importance of viscosity. Biopharm Drug Dispos. 2012; 33(7):403–416. | ||
Dahan A, Duvdevani R, Shapiro I, Elmann A, Finkelstein E, Hoffman A. The oral absorption of phospholipid prodrugs: in vivo and in vitro mechanistic investigation of trafficking of a lecithin-valproic acid conjugate following oral administration. J Control Release. 2008; 126(1):1–9. |
 © 2014 The Author(s). This work is published and licensed by Dove Medical Press Limited. The
full terms of this license are available at https://www.dovepress.com/terms
and incorporate the Creative Commons Attribution
- Non Commercial (unported, 3.0) License.
By accessing the work you hereby accept the Terms. Non-commercial uses of the work are permitted
without any further permission from Dove Medical Press Limited, provided the work is properly
attributed. For permission for commercial use of this work, please see paragraphs 4.2 and 5 of our Terms.
© 2014 The Author(s). This work is published and licensed by Dove Medical Press Limited. The
full terms of this license are available at https://www.dovepress.com/terms
and incorporate the Creative Commons Attribution
- Non Commercial (unported, 3.0) License.
By accessing the work you hereby accept the Terms. Non-commercial uses of the work are permitted
without any further permission from Dove Medical Press Limited, provided the work is properly
attributed. For permission for commercial use of this work, please see paragraphs 4.2 and 5 of our Terms.