Back to Journals » International Journal of Nanomedicine » Volume 18
Proteomics and Metabolomics Analysis Reveals the Toxicity of ZnO Quantum Dots on Human SMMC-7721 Cells
Authors Yang Y, Wang X, Song Z, Zheng Y, Ji S
Received 7 October 2022
Accepted for publication 9 December 2022
Published 15 January 2023 Volume 2023:18 Pages 277—291
DOI https://doi.org/10.2147/IJN.S389535
Checked for plagiarism Yes
Review by Single anonymous peer review
Peer reviewer comments 2
Editor who approved publication: Dr Yan Shen
Yanjie Yang, Xu Wang, Zhenhua Song, Yafei Zheng, Shaoping Ji
Henan Provincial Engineering Center for Tumor Molecular Medicine, School of Basic Medical Sciences, Henan University, Kaifeng, 475004, People’s Republic of China
Correspondence: Shaoping Ji, School of Basic Medical Sciences, Henan University, Kaifeng, 475004, People’s Republic of China, Tel +86 371 2388 0585, Fax +86 371 2388 0585, Email [email protected]
Purpose: ZnO quantum dots (QDs) are composed of less toxic metals than other QDs but have the same interesting photochemical properties. Thus, they have received considerable attention recently. Nevertheless, their toxicity cannot be ignored.
Methods: In this study, we incubated ZnO QDs with human SMMC-7721 cells for 24 h to assess their nanotoxicity through proteomics (Fold change > 1.5 and p-value < 0.05) and metabolomics (Fold change ≥ 1.5; VIP ≥ 1; p-value < 0.05) analyses.
Results: Both of 174 and 219 significantly changed metabolites were identified in human SMMC-7721 cells treated with 20 and 50 μg/mL ZnO QDs, respectively. ZnO QDs significantly modified metabolic pathways, including purine metabolism, ferroptosis, morphine addiction, alcoholism, cGMP-PKG signaling, and Cushing syndrome. Moreover, we identified 105 and 8 differentially expressed proteins in cells treated with 20 and 50 μg/mL ZnO QDs, and the pathways of alcoholism and Cushing syndrome were enriched.
Conclusion: ZnO QDs did not affect cell viability in a CCK8 assay, but disturbed the level of intracellular metabolites and proteins at 20 μg/mL. The KEGG analyses of the metabolomics and proteomics data both enriched the alcoholism and Cushing syndrome pathways. These results provide an experimental basis for future research on the safe use of nanomaterials.
Keywords: ZnO quantum dots, cytotoxicity, proteomics, metabolomics
Introduction
Semiconductor quantum dots (QDs) have unique optical properties, including narrow and tunable fluorescence emission spectra, wide excitation wavelength ranges, and good resistance to photochemical degradation and photobleaching.1,2 QDs have potential applications in many fields, such as bioimaging, biolabeling, nanomedicine, and optoelectronics.1,3,4 Because of this extensive application range, intentional and unintentional environmental contamination is inevitable In this context, ZnO QDs have received considerable attention recently. Indeed, they are composed of less toxic metals than other QDs while keeping interesting photochemical properties. For example, EGCG-modified ZnO QDs potential to be a safe and effective treatment material for diabetic wound.5 ZnO QDs with sunlight-driven antibacterial activity can be used for communicable disease protective wearables.6 Sarkar et al reported that luminescent defect-engineered ZnO QDs have potential as a new, safe, and economical multifunctional active ingredient for skin UV protection.7 ZnO QDs was also used to fabricated gas sensor for NO2 and methanol detection.8,9 Moreover, ZnO QDs was reported significantly promoted tomato (Solanum lycopersicum) and pumpkin (Cucurbita moschata Duch.) growth in comparison with the equivalent concentrations of other sizes of ZnO particles.10,11
Current toxicity studies on ZnO QDs mainly explored aspects such as cytotoxicity, antibacterial activity, reactive oxygen species (ROS) production, oxidative stress, and apoptosis.4,12–16 Traditional, single end-point approaches are difficult to achieve toxicity assessment of the growing number of new nanomaterials.17 However, omics techniques including transcriptomics, proteomics, and metabolomics are promising high throughput methods used in predictive toxicology, which could also detect unsuspected subtle changes before conventional methods.18,19 The metabolome is defined as the quantitative collection of low-molecular-weight molecules (metabolites) required for the growth and proper function of a cell.20 Untargeted metabolomic have been an unbiased tool for revealing unforeseen biological effects on cellular or animal models.18,21 The effect of ZnO QDs on metabolome has not been reported, except little research of other sized ZnO particles. Meanwhile, proteomics technologies can identify thousands of de-regulated dynamic proteins and their interactions in a cell or organism under different environmental conditions.22,23 Furthermore, the proteome and metabolome are directly interconnected, as protein levels influence the metabolic profile, and metabolite affect protein expression.19 Proteome data affected by ZnO QDs is lacking, and more studies are necessary in these directions.
The liver is an important organ of metabolic clearance and a major site of ZnO QDs accumulation.24,25 To investigate the toxicity of ZnO QDs, we selected the human SMMC-7721 cell line, which is commonly used in in vitro models to elucidate cytotoxicity mechanisms on hepatocytes.26 We first utilized a multi-omics (proteomics and metabolomics) approach to gain more information and better understand the nanotoxicity of ZnO QDs. Moreover, we analyzed the differentially expressed proteins and metabolites to identify the metabolic pathways affected by ZnO QDs and elucidate the toxicity mechanisms.
Materials and Methods
Materials
We synthesized and characterized ZnO QDs as described in previous reports.16,27 We acquired fetal bovine serum (FBS) from Hyclone (Logan, UT, USA), RPMI-1640, trypsin, penicillin-streptomycin and phosphate-buffered saline (PBS) from Corning (New York, NY, USA), dimethyl sulfoxide from Sigma (St Louis, MO, USA), and a Cell Counting Kit 8 (CCK-8) from Beyotime (Shanghai, China). Other chemicals and reagents used were of analytical grade.
Cell Culture
The human SMMC-7721 cells were purchased from the Cell Bank of Chinese Academy of Sciences (Shanghai, China). We cultured the cells in RPMI 1640 containing 10% FBS and 1% penicillin-streptomycin. We maintained the cells at 37°C in a humidity- and CO2-controlled incubator (Thermo Forma, OH, USA). We performed all the cell experiments under a clean atmosphere. The experimental procedures complied with the “Proteomics and metabolomics analysis of the toxicity of ZnO quantum dots on human SMMC-7721 cells” guidelines approved by the Committee of Medical Ethics and Welfare for Experimental Animals of Henan University School of Medicine (no. HUSOM2021-323).
Cell Viability Assay
We assessed cell viability through a CCK-8 assay. Briefly, we seeded human SMMC-7721 cells into 96-well plates (5.0×10³ cells/well). We then added ZnO QDs in RPMI 1640 (final concentrations of 0, 10, 20, 30, 40, 50, 60, 70, 80, and 90 µg/mL). After 24 h of incubation, we washed the cells with PBS to remove the excess of QDs. Then, we added 200 µL of fresh medium and 20 µL of CCK-8 reagent per well and incubated the cells at 37°C for 2 h. Finally, we measured the absorbance at 450 nm using a microplate reader. For all the assays, we performed three independent experiments, each in triplicate.
Metabolomics Analysis
Sample Preparation
We incubated human SMMC-7721 cells with 0, 20, or 50 µg/mL ZnO QDs for 24 h, then collected them. We weighed 25 mg of each sample, then added 800 μL of a cold methanol, acetonitrile and water solution (2:2:1, v:v:v). We also added the internal standard at this point. Next, we homogenized the mixture and performed ultrasonic extraction. We then centrifugated the mixture, dried it under a vacuum, and re-suspended it before carrying out the ultra-performance liquid chromatography-tandem mass spectrometry (UPLC-MS/MS) analysis. We prepared quality control (QC) samples by mixing aliquots of all the samples and injected them every 10 samples throughout the analytical run.
UPLC-MS/MS Analysis
We analyzed the samples using a 2D UPLC system (Waters, USA) coupled with a Q Exactive high-resolution mass spectrometer (Thermo Fisher Scientific, USA). We performed the chromatographic separations on a Waters BEH C18 column (2.1 × 100 mm, 1.7 μm) at 45°C, with a flow rate of 0.35 mL/min and an injection volume of 5 μL. For positive-mode MS, the mobile phase consisted of 0.1% formic acid (solution A) and 100% methanol with 0.1% formic acid (solution B); for negative-mode MS, it consisted of 10 mM carbamate (solution A) and 95% methanol with 10 mM carbamate (solution B).
The optimized elution conditions were: 0–1 min, 2% B solution; 1–9 min, 2–98% B solution; 9–12 min, 98% B solution; 12–12.1 min, 98–2% B solution; and 12.1–15 min, 2% B solution. We obtained primary mass spectra by scans from 70 to 1050 m/z at a resolution of 70 K, an automatic gain control (AGC) of 3×10⁶, and a maximum injection time of 100 ms. We selected the top 3 based on the parent ion strength, with a resolution of 17.5 K, AGC of 1 × 10⁵, maximum injection time of 50 ms, and stepped normalized collisional energy of 20, 40 and 60 eV for secondary information. The experimental conditions for the electrospray ionization source were: sheath gas flow rate, 40 arbitrary units; aux gas flow rate, 10 arbitrary units; spray voltage (|KV|), 3.80 for the positive mode and 3.20 for the negative mode; gas temperature, 350°C.
Data Processing and Statistical Analysis
We processed raw UPLC-MS/MS data (peak extraction, peak alignment, and compound identification) using Compound Discoverer 3.1 (Thermo Fisher Scientific, USA). We used the MetaX R software package (BGI, China) for data preprocessing, statistical analysis, metabolite classification and functional annotation. We also conducted unsupervised principal component analysis (PCA) and supervised partial least squares-discriminant analysis (PLS-DA). We selected significantly modified metabolites based on fold change ≥1.5; VIP values of the first two principal components of the PLS-DA model ≥ 1; and p-value of Student’s t-test < 0.05. We achieved the molecular identification of metabolites by automatically matching the purified mass spectra with the BGI Library, mzCloud and ChemSpider database. Finally, we performed an enrichment analysis of the disturbed metabolites using the KEGG (Kyoto Encyclopedia of Genes and Genomes) database and considered that p < 0.05 indicated significantly enriched targets.
Proteomics Analysis
Protein Sample Preparation
We treated human SMMC-7721 cells with 0, 20 or 50 µg/mL ZnO QDs for 24 h. Next, we added a 1 × Cocktail with ethylenediamine tetraacetic acid and without sodium dodecyl sulfate. We placed the sample on ice for 5 min and added dithiothreitol to a final concentration of 10 mM. We then sonicated the suspension to lyse the cells, centrifuged at 4°C and 25,000 g for 15 min, collected the supernatant, and incubated it at 56°C for 60 min. We then added iodoacetamide to a final concentration of 55 mM and incubated the samples for 45 min in the dark. After centrifugation, we quantified the proteins in the supernatant using the Bradford method. Finally, we analyzed the proteins by sodium dodecyl sulfate-polyacrylamide gel electrophoresis.
Proteolysis and IBT Labeling
We diluted the protein solution (100 µg) with 0.5 M tetraethylammonium bromide, added 5 µg of trypsin, and incubated at 37°C for 4 h. After salt removal, we dried the peptides under a vacuum.
We dissolved the peptides in 200 mM tetraethylammonium bromide to obtain a final concentration of 40 µg/µL. Next, we placed 100 µg of peptides in tubes and added 2 mg of IBT reagent (BGI, Shenzhen, China) dissolved in 80 µL of isopropanol in each tube. We rapidly mixed, shook, and centrifuged the tubes, then checked that the pH was between 7.0 and 8.0. We then incubated the mixture was at room temperature for 2 h to obtain sufficient labeling. We labeled control samples as “C”, 20 µg/mL ZnO QDs-treated samples as Z20, and 50 µg/mL ZnO QDs-treated samples as Z50. The isobaric tagging of samples was performed as follows: C1:118C; C2:119; C3:115N; Z20-1:115C; Z20-2: 116N; Z20-3: 116C; Z50-1: 117N; Z50-2: 117C; and Z50-3: 118N.
Peptide Fractionation and UHPLC-MS/MS
We dissolved 20 µg samples of dried peptides in mobile phase A (5% acetonitrile, pH = 9.8) and fractionated them on a Shimadzu LC-20AD system, using a 5 µm × 20 cm × 180 µm with a 5%–35% gradient of buffer B (95% acetonitrile, pH = 9.8). According to the chromatographic elution peaks at 214 nm, we obtained 20 components, which we freeze-dried.
We dissolved the dried peptide samples in mobile phase A (2% acetonitrile, 0.1% formic acid), then centrifuged the solutions at 20,000 g for 10 min. We separated the obtained supernatant on a Thermo UltiMate 3000 UHPLC system. The sample was enriched in trap column and desalted, then placed on a self-packed C18 column (75 μm × 3 μm × 25 cm). The liquid-phase gradient was: 0–5 min, 5% mobile phase B (98% acetonitrile, 0.1% formic acid); 5–45 min, 5–25% B; 45–50 min, 25–35% B; 50–52 min, 35%–80% B; 52–54 min, 80% B; 54–60 min, 5% B; flow rate, 300 nL/min.
The UHPLC system was connected to the mass spectrometer; peptides were ionized by a nano-electrospray ionization source and passed to a Q-Exactive HF X tandem mass spectrometer (Thermo Fisher Scientific, San Jose, CA, USA) for data-dependent acquisition. The MS parameters were: ion source voltage, 1.9 kV; MS1 scanning range, 350–1500 m/z; the resolution for MS1, 60,000; MS2 starting m/z, 100; resolution for MS2, 30,000; AGC for MS1, 3 × 10⁶; AGC for MS2, 1 × 10⁵; dynamic exclusion time, 30 s. The ion screening conditions for MS2 fragmentation were: charge 2+ to 6+, and the top 20 parent ions with a peak intensity exceeding 20,000. The ion fragmentation mode was higher-energy collisional dissociation, and the fragment ions were detected in Orbitrap.
Proteomics Data Analysis and Bioinformatics
We converted raw MS data to the MGF format, and identified proteins using the Mascot search engine (version 2.3.02). We quantified the proteins using IQuant software (BGI, Shenzhen, China).28 We set the false discovery rate to ≤ 1% for both protein and peptide identification. We set fold change > 1.5 and p-value < 0.05 as significance thresholds for differentially expressed proteins (DEPs). Finally, we functionally annotated DEPs by KEGG pathway enrichment analysis (http://www.genome.jp/kegg/pathway.html) and considered that p-value < 0.05 indicated significant enrichment.
Statistical Analysis
The CCK-8 assay results are presented as mean ± SEM. We compared the means of multiple groups by one-way analysis of variance (ANOVA) followed by Dunnett’s test using SPSS version 16.0. We compared pairs of groups by using an unpaired t-test. We considered that p < 0.05 indicated statistical significance.
Results and Discussion
As shown in Figure S1A, transmission electron microscopy (JEM2100Plus, JEOL, Japan) revealed that ZnO QDs had an average diameter of 7.98 ± 0.31 nm. They also had strong fluorescence centered at 566 nm and an excitation maximum located at 368 nm (Figure S1B), as recorded on a Fluorolog-3 spectrofluorometer (HORIBA Scientific, USA).
Cytotoxicity of ZnO QDs in Human SMMC-7721 Cells
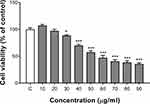
We assessed the viability of human SMMC-7721 cells incubated with ZnO QDs for 24 h using a CCK-8 assay (Figure 1). We observed significant dose-dependent cytotoxicity starting at 30 µg/mL. This result is consistent with our previous experiment, which showed that 25 µg/mL ZnO QDs did not affect the cell viability of Hela and HEK-293T, while 50 µg/mL QDs killed approximately 50% of the cells.16 Roshini et al reported that 10 µg/mL ZnO QDs killed approximately 40% of MCF-7 and MDA-MB-231 breast cancer cells.12 Based on the cytotoxicity of ZnO QDs on SMMC-7721 cells, we selected the 20 (no toxicity dose) and 50 (dose of about 50% inhibition of cell activity) µg/mL concentrations for the following metabolomics and proteomic experiments.
Effects of ZnO QDs Exposure on the Metabolome of Human SMMC-7721 Cells
We analyzed the metabolites of human SMMC-7721 cells incubated with 0, 20, or 50 µg/mL ZnO QDs for 24 h using UPLC-MS/MS. Figure S2 shows representative base peak chromatograms in positive and negative mode for untreated SMMC-7721 cells. The overlay of the base peak of all QC samples (Figure S3) suggested that the stability of the UPLC-MS/MS system was acceptable, while QC samples together in PCA score plots indicated the sufficiently reproducibility of the method (Figure S4). We identified a total of 1258 metabolites in positive model (538 with identification information) and 1080 in negative model (428 with identification information) by automatically matching the mass spectra of purified compounds with the BGI Library, mzCloud and ChemSpider databases. Furthermore, we compared the metabolites of control and ZnO QD-treated cells (20 and 50 µg/mL) using unsupervised PCA and supervised PLS-DA. We observed marked differences in the PCA score plots both in positive and negative modes (Figure 2A and B). Ellipses represents the 95% confidence intervals, and we used all of the samples in the following analysis to obtain maximum information.
 |
Figure 2 Discrimination plots of control and ZnO QDs-treated cells from the PCA of UPLC-MS/MS data: (A) positive mode, (B) negative mode. |
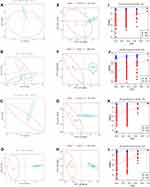
We performed a multivariate analysis comparing the metabolites of control and ZnO QD-treated cells (20 or 50 µg/mL). The PCA score plots of ZnO QD-treated cells (at both concentrations) and those of control cells were notably different in positive and negative mode (Figure 3A-D). PLS-DA, a supervised statistical method, can better reflect the differences between experimental and control samples. Indeed, we observed a better separation in the PLS-DA model, with a seven-fold cross-validation (Figure 3E-H), suggesting a significant metabolic difference between ZnO QD-treated and control cells. Next, we performed response permutation testing 200 times to confirm that the PLS-DA model was not random and overfitting (Figure 3I-L). The criteria for identifying significantly modified metabolites were: fold change ≥ 1.5; VIP values of the first two principal components of the PLS-DA model ≥ 1; and p-value of Student’s t-test < 0.05. Thus, we identified 174 significantly changed metabolites in cells treated with 20 µg/mL ZnO QDs (96 in positive mode and 102 in negative mode), and 219 in cells treated with 50 µg/mL ZnO QDs (98 in positive mode and 159 in negative mode). A total of 95 metabolites were changed in both treated groups (Table 1). According to the CCK8 assay results, 20 µg/mL ZnO QDs did not induce cytotoxicity in SMMC-7721 cells but affected intracellular metabolite levels.
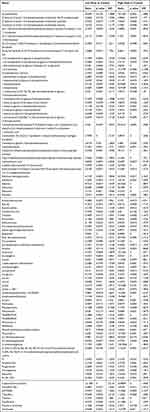 |
Table 1 Overlap of Significantly Changed Metabolites Between Different Dosage of ZnO QDs and Controls |
We analyzed the differential metabolites in positive and negative modes to find ZnO QD-modified metabolic pathways. In positive mode, cells treated with 20 and 50 µg/mL ZnO QDs had almost the same pathways significantly enriched (Figures 4 and S5A), namely purine metabolism, ferroptosis, morphine addiction, alcoholism, cGMP-PKG signaling pathway, and Cushing syndrome. Purines are important components of DNA replication and RNA synthesis, and play a key role in neurotransmission and neuromodulation.29,30 Zinc oxide nanoparticles can reduce the level of purine metabolites in Saccharomyces cerevisiae.31 Ferroptosis is a newly identified programmed cell death driven by iron-dependent lipid peroxidation.32 Zhang et al demonstrated that “iron free” zinc oxide nanoparticles triggered ferroptosis by increasing ROS production and lipid peroxidation in vitro.33 Wu et al also reported that graphene QDs caused ferroptosis via mitochondrial oxidative stress in microglia.34 Adenosine is a major component of adenine nucleotides and ribonucleic acids, as well as a signal molecule mediating signal transduction.35 ZnO QDs disturbed adenosine in many signaling pathways, including morphine addiction, alcoholism, and cGMP-PKG signaling. In negative mode, cells treated with 20 and 50 µg/mL displayed different enriched pathways (Figure S5B and C). The 20 µg/mL ZnO QDs treatment significantly enriched pathways such as biosynthesis of unsaturated fatty acids, linoleic acid metabolism, purine metabolism, fatty acid biosynthesis, regulation of lipolysis in adipocytes, while the 50 µg/mL ZnO QDs treatment affected protein digestion and absorption, biosynthesis and metabolism of amino acids, aminoacyl-tRNA biosynthesis, mineral absorption, purine metabolism, ABC transporters, glyoxylate and dicarboxylate metabolism, and pyrimidine metabolism.
Effects of ZnO QDs Exposure on the Proteome of Human SMMC-7721 Cells
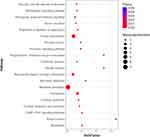
Overall, we identified 6469 proteins under the 1% false discovery rate filter. The DEP selection criteria were: fold change > 1.5 and p-value < 0.05. Compared with the control cells, cells treated with 20 µg/mL ZnO QDs had 105 DEPs, including 64 upregulated and 41 downregulated proteins (Table 2). Next, we carried out a KEGG pathways analysis to determine the function of the DEPs. The significantly enriched pathways included the hippo signaling pathway, signaling pathways regulating pluripotency of stem cells, Toll and Imd signaling pathway, systemic lupus erythematosus, alcoholism, Cushing syndrome, transcriptional misregulation in cancer, and basal cell carcinoma (Figure 5). Interestingly, the metabolomics and proteomics analysis both identified the alcoholism and Cushing syndrome pathways as enriched. Compared with the control cells, cells treated with 50 µg/mL ZnO QDs only five upregulated and three downregulated proteins (Table 2). According to the KEGG pathway analysis, this dose notably affected the interleukin-17 signaling pathway. Interleukin-17, an inflammatory cytokine, is key to the host-protective capacity, while unrestrained interleukin-17 signaling is related to autoimmune disease, immunopathology, and cancer progression.36
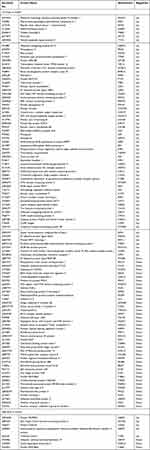 |
Table 2 Significantly Differentially Expressed Proteins Induced by ZnO QDs |
 |
Figure 5 Scatterplot of significantly enriched KEGG pathways based on differential proteins induced by 20 µg/ mL ZnO QDs. The size of the dots represents the numbers of proteins. |
Conclusion
ZnO QDs significantly disturbed the metabolism of human SMMC-7721 cells, and changed the level of 174 and 219 metabolites at 20 and 50 µg/mL, respectively. The proteomics analysis revealed 105 and 8 DEPs. The KEGG analyses of the metabolomics and proteomics data both identified the alcoholism and Cushing syndrome pathways as enriched. ZnO QDs had no effect on the cell viability in the CCK8 assay but affected the intracellular levels of metabolites and proteins at 20 µg/mL. These findings will be helpful for future research on ZnO QDs and their applications.
Funding
This work was supported by research funds from the Key Science and Technology Program of Henan Province (Grant No. 202102310213).
Disclosure
The authors report no conflicts of interest in this work.
References
1. Bellanger X, Billard P, Schneider R., et al. Stability and toxicity of ZnO quantum dots: interplay between nanoparticles and bacteria. J Hazard Mater. 2015;283:110–116. doi:10.1016/j.jhazmat.2014.09.017
2. Martínez-Carmona M, Gunko Y, Vallet-Regí M. ZnO nanostructures for drug delivery and theranostic applications. Nanomaterials. 2018;8(4):458. doi:10.3390/nano8040268
3. Cai X, Luo Y, Zhang W, et al. pH-Sensitive ZnO Quantum Dots-Doxorubicin Nanoparticles for Lung Cancer Targeted Drug Delivery. ACS Appl Mater Interfaces. 2016;8(34):22442–22450. doi:10.1021/acsami.6b04933
4. Hsu S-H, Lin YY, Huang S, et al. Synthesis of water-dispersible zinc oxide quantum dots with antibacterial activity and low cytotoxicity for cell labeling. Nanotechnology. 2013;24(47):475102. doi:10.1088/0957-4484/24/47/475102
5. Yin X, Huang S, Xu S, et al. Preparation of pro-angiogenic, antibacterial and EGCG-modified ZnO quantum dots for treating bacterial infected wound of diabetic rats. Biomater Adv. 2022;133:112638. doi:10.1016/j.msec.2021.112638
6. Flora RMN, Palani S, Kowsalya P, Chamundeeswari M. Sunlight-driven antibacterial activity of a novel zinc oxide quantum dot and its optimization using Box-Behnken design-A medicament for communicable disease protective wearables. Biotechnol Appl Biochem. 2022;1–17. doi:10.1002/bab.2345
7. Sarkar S, Debnath SK, Srivastava R, Kulkarni AR. Continuous flow scale-up of biofunctionalized defective ZnO quantum dots: a safer inorganic ingredient for skin UV protection. Acta Biomater. 2022;147:377–390. doi:10.1016/j.actbio.2022.05.032
8. Park JY, Kwak Y, Lim HR, et al. Tuning the sensing responses towards room-temperature hypersensitive methanol gas sensor using exfoliated graphene-enhanced ZnO quantum dot nanostructures. J Hazard Mater. 2022;438:129412. doi:10.1016/j.jhazmat.2022.129412
9. Lin Q, Zhang F, Zhao N, et al. A Flexible and Wearable Nylon Fiber Sensor Modified by Reduced Graphene Oxide and ZnO Quantum Dots for Wide-Range NO(2) Gas Detection at Room Temperature. Materials. 2022;15(11):3772. doi:10.3390/ma15113772
10. Xu X, Zhao C, Qian K, et al. Physiological responses of pumpkin to zinc oxide quantum dots and nanoparticles. Environ Pollut. 2022;296:118723. doi:10.1016/j.envpol.2021.118723
11. Sun M, Zhao C, Shang H, et al. ZnO quantum dots outperform nanoscale and bulk particles for enhancing tomato (Solanum lycopersicum) growth and nutritional values. Sci Total Environ. 2022;857(Pt 1):159330. doi:10.1016/j.scitotenv.2022.159330
12. Jagadeesan AR, Cho S. Synthesis and evaluation of the cytotoxic and anti-proliferative properties of ZnO quantum dots against MCF-7 and MDA-MB-231 human breast cancer cells. Mater Sci Eng C Mater Biol Appl. 2017;81:551–560. doi:10.1016/j.msec.2017.08.014
13. Bellanger X, Schneider R, Dezanet C, et al. Zn(2+) leakage and photo-induced reactive oxidative species do not explain the full toxicity of ZnO core Quantum Dots. J Hazard Mater. 2020;396:122616. doi:10.1016/j.jhazmat.2020.122616
14. Moussa H, Merlin C, Dezanet C, et al. Trace amounts of Cu²+ ions influence ROS production and cytotoxicity of ZnO quantum dots. J Hazard Mater. 2016;304:532–542. doi:10.1016/j.jhazmat.2015.11.013
15. Zhang Y, Wang H, Jiang H, Wang X. Water induced protonation of amine-terminated micelles for direct syntheses of ZnO quantum dots and their cytotoxicity towards cancer. Nanoscale. 2012;4(11):3530–3535. doi:10.1039/c2nr30127j
16. Yang Y, Song Z, Wu W, et al. ZnO Quantum Dots Induced Oxidative Stress and Apoptosis in HeLa and HEK-293T Cell Lines. Front Pharmacol. 2020;11:131. doi:10.3389/fphar.2020.00131
17. Gioria S, Urbán P, Hajduch M, et al. Proteomics study of silver nanoparticles on Caco-2 cells. Toxicol in Vitro. 2018;50:347–372. doi:10.1016/j.tiv.2018.03.015
18. Carrola J, Pinto RJB, Nasirpour M, et al. NMR Metabolomics Reveals Metabolism-Mediated Protective Effects in Liver (HepG2) Cells Exposed to Subtoxic Levels of Silver Nanoparticles. J Proteome Res. 2018;17(4):1636–1646. doi:10.1021/acs.jproteome.7b00905
19. Gioria S, Lobo Vicente J, Barboro P, et al. A combined proteomics and metabolomics approach to assess the effects of gold nanoparticles in vitro. Nanotoxicology. 2016;10(6):736–748. doi:10.3109/17435390.2015.1121412
20. Planchon M, Léger T, Spalla O, et al. Metabolomic and proteomic investigations of impacts of titanium dioxide nanoparticles on Escherichia coli. PLoS One. 2017;12(6):e0178437. doi:10.1371/journal.pone.0178437
21. Zhang W, Zhao Y, Li F, et al. Zinc Oxide Nanoparticle Caused Plasma Metabolomic Perturbations Correlate with Hepatic Steatosis. Front Pharmacol. 2018;9:57. doi:10.3389/fphar.2018.00057
22. Tian Y, Jiang F, Li Y, et al. Evaluation of the anti-hypertensive effect of Tengfu Jiangya tablet by combination of UPLC-Q-exactive-MS-based metabolomics and iTRAQ-based proteomics technology. Biomed Pharmacother. 2018;100:324–334. doi:10.1016/j.biopha.2018.02.025
23. Xie J, Dong W, Liu R, et al. Research on the hepatotoxicity mechanism of citrate-modified silver nanoparticles based on metabolomics and proteomics. Nanotoxicology. 2018;12(1):18–31. doi:10.1080/17435390.2017.1415389
24. Yu J, Chen J, Zhao H, et al. Integrative proteomics and metabolomics analysis reveals the toxicity of cationic liposomes to human normal hepatocyte cell line L02. Mol Omics. 2018;14(5):362–372. doi:10.1039/c8mo00132d
25. Yang Y, Li P, Lin Y, et al. Gene Expression Profiling of the Liver and Lung in Mice After Exposure to ZnO Quantum Dots. Int J Nanomedicine. 2020;15:2947–2955. doi:10.2147/ijn.s246754
26. Cheng G, Guo W, Han L, et al. Cerium oxide nanoparticles induce cytotoxicity in human hepatoma SMMC-7721 cells via oxidative stress and the activation of MAPK signaling pathways. Toxicol in Vitro. 2013;27(3):1082–1088. doi:10.1016/j.tiv.2013.02.005
27. Chen C, Hu H, Li X, et al. Rapid Detection of Anti-SARS-CoV-2 Antibody Using a Selenium Nanoparticle-Based Lateral Flow Immunoassay. IEEE Trans Nanobioscience. 2022;21(1):37–43. doi:10.1109/tnb.2021.3105662
28. Wen B, Zhou R, Feng Q, et al. IQuant: an automated pipeline for quantitative proteomics based upon isobaric tags. Proteomics. 2014;14(20):2280–2285. doi:10.1002/pmic.201300361
29. Lv S, Zhang X, Feng Y, et al. Gut Microbiota Combined With Metabolomics Reveals the Repeated Dose Oral Toxicity of β-Cyclodextrin in Mice. Front Pharmacol. 2020;11:574607. doi:10.3389/fphar.2020.574607
30. Jiang Q, Zhang W. Gradual effects of gradient concentrations of polystyrene nanoplastics on metabolic processes of the razor clams. Environ Pollut. 2021;287:117631. doi:10.1016/j.envpol.2021.117631
31. Kumar Babele P. Zinc oxide nanoparticles impose metabolic toxicity by de-regulating proteome and metabolome in Saccharomyces cerevisiae. Toxicol Rep. 2019;6:64–73. doi:10.1016/j.toxrep.2018.12.001
32. Zhang Y, Tan H, Daniels JD, et al. Imidazole Ketone Erastin Induces Ferroptosis and Slows Tumor Growth in a Mouse Lymphoma Model. Cell Chem Biol. 2019;26(5):623–633.e629. doi:10.1016/j.chembiol.2019.01.008
33. Zhang C, Liu Z, Zhang Y, et al. ”Iron free” zinc oxide nanoparticles with ion-leaking properties disrupt intracellular ROS and iron homeostasis to induce ferroptosis. Cell Death Dis. 2020;11(3):183. doi:10.1038/s41419-020-2384-5
34. Wu T, Liang X, Liu X, et al. Induction of ferroptosis in response to graphene quantum dots through mitochondrial oxidative stress in microglia. Part Fibre Toxicol. 2020;17(1):30. doi:10.1186/s12989-020-00363-1
35. Novotný J. Adenosin a jeho role ve fyziologii [Adenosine and its role in physiology]. Cesk Fysiol. 2015;64(1):35–44. Slovak
36. Amatya N, Garg AV, Gaffen SL. IL-17 Signaling: the Yin and the Yang. Trends Immunol. 2017;38(5):310–322. doi:10.1016/j.it.2017.01.006
 © 2023 The Author(s). This work is published and licensed by Dove Medical Press Limited. The full terms of this license are available at https://www.dovepress.com/terms.php and incorporate the Creative Commons Attribution - Non Commercial (unported, v3.0) License.
By accessing the work you hereby accept the Terms. Non-commercial uses of the work are permitted without any further permission from Dove Medical Press Limited, provided the work is properly attributed. For permission for commercial use of this work, please see paragraphs 4.2 and 5 of our Terms.

