Back to Journals » Diabetes, Metabolic Syndrome and Obesity » Volume 13
Protein Arginine Methyltransferase 4 Regulates Adipose Tissue Lipolysis in Type 1 Diabetic Mice
Authors Li Y, Peng M, Zeng T ![]() , Zheng J, Liao Y, Zhang H, Yang S
, Zheng J, Liao Y, Zhang H, Yang S ![]() , Chen L
, Chen L
Received 25 October 2019
Accepted for publication 10 February 2020
Published 26 February 2020 Volume 2020:13 Pages 535—544
DOI https://doi.org/10.2147/DMSO.S235869
Checked for plagiarism Yes
Review by Single anonymous peer review
Peer reviewer comments 2
Editor who approved publication: Prof. Dr. Antonio Brunetti
Yuanxiang Li, Miaomiao Peng, Tianshu Zeng, Juan Zheng, Yunfei Liao, Hao Zhang, Songtao Yang, Lulu Chen
Department of Endocrinology, Union Hospital, Tongji Medical College, Huazhong University of Science and Technology, Wuhan, Hubei 430022, People’s Republic of China
Correspondence: Lulu Chen Email [email protected]
Purpose: Hypertriglyceridemia is considered to be driven by increased lipolysis in type 1 diabetes mellitus (T1DM). However, information regarding the transcriptional circuitry that governs lipolysis remains incomplete in T1DM. Protein arginine methyltransferase 4 (PRMT4), a transcriptional coactivation factor, promotes autophagy and may play an important role in lipolysis. We wonder whether activated lipolysis in T1DM is regulated by PRMT4.
Materials and Methods: Recombinant adeno-associated virus was adopted to overexpress PRMT4 in adipose tissue of mice. Streptozotocin (150 mg/kg) was injected intraperitoneally into mice to induce T1DM. Plasma insulin, triglycerides, free fatty acids (FFAs) levels were determined using commercial assay kits. Differentiated adipocytes were applied to verify the regulation of PRMT4 on lipolysis.
Results: Elevated serum triglycerides and FFAs were observed in PRMT4-overexpressed T1DM mice. We also observed that PRMT4 over-expression induced the decrease of fat pads weights and adipocyte sizes. Moreover, expression levels of lipolysis-related molecules, including ATGL, HSL, and MAGL, and HSL phosphorylation levels were increased in PRMT4-overexpressed mice when compared to those of control mice. In vitro, PRMT4 promoted FFAs release and activated HSL phosphorylation, whereas PRMT4 knockdown inhibited these processes.
Conclusion: PRMT4 promotes lipolysis and increases serum triglyceride in T1DM.
Keywords: type 1 diabetic mice, hypertriglyceridemia, protein arginine methyltransferase 4, lipolysis
Introduction
The prevalence of dyslipidemia is much higher in patients with type 1 diabetes mellitus (T1DM), especially in children and youth with the disease.1 Diabetic dyslipidemia is characterized by a decreased concentration of high-density lipoprotein–cholesterol, increased low-density lipoprotein–cholesterol, and elevated concentration of plasma triglycerides.2 In T1DM, the triglyceride levels are increased3 and are associated closely with the risk of cardiovascular diseases.4 It has been suggested that hyperlipidemia is induced by the increase triglyceride secretion attributed to liver lipid synthesis driven by sterol regulatory element-binding protein 2 (SREBP2) in type 2 diabetes mellitus (T2DM).5,6 However, liver lipid synthesis is not increased in T1DM owing to the lack of insulin, which is the activator of SREBP2. Therefore, increased lipid synthesis in the liver is not the cause of hyperlipidemia in T1DM. In fact, it is the insulin deficiency that leads to increased lipolysis and elevated levels of plasma triglycerides in T1DM.7
Lipolysis involves the hydrolysis of triglycerides and the release of free fatty acids (FFAs). Increased flux of FFAs promotes triglyceride production in the liver,8 thus leads to elevated triglyceride secretion and higher triglyceride concentrations.9 Lipolysis consists of the sequential hydrolysis of triglycerides, which was catalyzed by three different enzymes: adipose triglyceride lipase (ATGL), hormone-sensitive lipase (HSL) and monoacylglycerol lipase (MAGL).10 It has been suggested that lipolysis is induced by catecholamines or other agonists, and is suppressed by insulin.11 Mechanistically, insulin inhibits adipocyte lipolysis via mTORC1-Egr1-ATGL-mediated pathway.12 However, the regulation mechanism was not confirmed in diabetic mice. The transcriptional circuitry through which insulin governs lipolysis in T1DM remains unclear. Given the consequences of the lipolysis and dyslipidemia in T1DM, understanding the mechanism underlying the regulation of lipolysis in the adipocytes is of considerable importance.
Protein arginine methyltransferase 4 (PRMT4), also known as coactivator-associated arginine methyltransferase 1 (CARM1), converts the monomethylarginine intermediate to asymmetric dimethylarginine.13 PRMT4 is widely expressed in tissues throughout the body under physiological conditions and has been confirmed to be highly expressed in cancers.14 In patients with T2DM, PRMT4 is overexpressed in the white blood cells.15 A previous study has shown that this enzyme is also overexpressed in retinal pigment epithelial cells of rats with T1DM, where it induces apoptosis in these cells.16,17 PRMT4 regulates various cellular processes, such as DNA repair, transcriptional coactivation, mRNA splicing, and protein translocation.18–22 It has also been suggested that PRMT4 functionally implicated in glycogen metabolism23,24 and adipocyte differentiation.25 PRMT4 also plays a crucial role in autophagy after nutrient starvation.26 Meanwhile, the upregulation of autophagy promotes fat mobilization and lipolysis.27 Based on previous research, we speculated that PRMT4 might be related to lipolysis. Therefore, the purpose of our study was to explore whether PRMT4 be required for activated lipolysis and hypertriglyceridemia in T1DM.
In this study, the expression of PRMT4 will be explored in the white adipose tissue (WAT) of mice with streptozotocin (STZ)-induced diabetic mice. To determine the effect of PRMT4 on adipose function, its role in lipolysis will be investigated using mouse models of T1DM and fasted mice in vivo and mouse primary adipocytes in vitro.
Materials and Methods
Animal Experiments and Recombinant Adeno-Associated Virus Transduction
Wild-type C57BL/6 mice (male, 6-weeks old) were purchased from SPF Biotechnology Ltd (Beijing, China). All the animal experiments were approved by the Ethical Committee of Huazhong University of Science and Technology and performed in accordance with the National Institutes of Health Guide for the Care and Use of Laboratory Animals. The mice were housed in a specific pathogen-free room with a controlled light/dark cycle (lights on 08:00–20:00).
Recombinant adeno-associated virus (AAV) vectors of serotype 9 harboring the murine PRMT4 gene were generated by replacing the mCherry fragment in the AAV cloning vector pAOV-CMV-mCherry with PRMT4-3X Flag.28 The vector pAOV-CMV-mCherry was used to produce empty vectors for transduction into control mice.
T1DM was induced in 6 weeks old male mice by injection of STZ dissolved in 100 mmol/L citrate buffer as described previously29 with some modifications. Briefly, mice were fasted overnight and then injected intraperitoneally with a dose of STZ (150 mg/kg). One week after intraperitoneal injection, mice were monitored for hyperglycemia on days 7, 10, and 14. Only mice in which random blood glucose exceeded 16.7 mM for the following week were assigned to the diabetic group.
White Adipose Tissue Morphology Analysis
The tissues isolated from T1DM mice were dehydrated and embedded, and 4-µm sections were stained with hematoxylin and eosin (H&E). The adipocyte size was determined using ImageJ software (US National Institutes of Health, Bethesda, MD, USA).
Glucose, Insulin, and Lipid Determination
The blood glucose level of each mouse was measured using a glucose meter (OneTouch Ultravue, Johnson & Johnson Medical Devices Companies, New Brunswick, NJ, USA). The serum insulin, triglyceride, and FFA levels were measured using commercial assay kits (Nanjing Jiancheng Bioengineering Institute, China) according to the manufacturers’ instructions.
Stromal Vascular Fraction Isolation
Primary stromal vascular fraction (SVF) was isolated as described previously30 with some modifications. Briefly, wild-type C57BL/6 mice were sacrificed and the adipose tissues were processed to obtain stromal vascular fractions (SVFs). After digestion in Dulbecco’s modified Eagle’s medium (DMEM) containing 1% collagenase type II at 37°C for 1 h, the mixture was filtered and centrifuged to obtain the SVF-containing pellet.
Preadipocyte Differentiation and Adenoviral Transduction
Preadipocytes differentiation and adenovirus infection were carried out as described previously30 with some modifications. Briefly, 2 days after confluence, the SVF cells were treated with insulin (167 nM), 3-isobutyl-1-methylxanthine (500 μM), rosiglitazone (2.5 μM), and dexamethasone (2 μM) for 2 days. Next, the cells were cultured in DMEM containing insulin (167 nM), and rosiglitazone (2.5 μM) for 6 days.
The differentiation adipocytes were infected with the adenovirus vector carrying the coding sequence of PRMT4 (Ad-PRMT4). Meanwhile, an adenovirus vector containing the gene for the green fluorescence protein only was applied as a negative control (Ad-ctrl). To knock down the expression of PRMT4 in adipocytes, adenovirus expressing a short hairpin RNA (shRNA) against PRMT4 (sh-PRMT4) was used. Cells infected with adenovirus expressing the universal control shRNA (sh-NC) were used as control.
Lipolysis Assay in Adipocytes
Differentiated adipocytes were infected for 48 h with Ad-PRMT4 or Ad-sh-PRMT4 and then incubated for 2 h in culture media containing 2% fatty acid-free bovine serum albumin (BSA) in the presence or absence of 1 mM CL316, 243 or 10 nM insulin. Lipolysis was assessed by the release of the FFA content.31
RNA Extraction, Reverse Transcription, and Quantitative Real-Time PCR
Total RNA was isolated and reversed transcribed as described previously32 with some modifications using commercial kits (Takara Biological Incorporated, Shiga, Japan). The mRNA levels were tested by qPCR using the SYBR Green I Master Mix (Takara Biological Incorporated, Shiga, Japan) on a Light Cycler 480 system (Roche, Indianapolis, IN, USA). The primers applied to real-time qPCR were as follows:
18S- Forward: 5ʹ- TTGACGGAAGGGCACCACCAG- 3ʹ, 18S- Reverse: 5ʹ- GCACCACCACCCACGGAATCG- 3ʹ; PRMT4- Forward: 5ʹ- GCTGTGGCTGGAATGCCTAC- 3ʹ, PRMT4- Reverse: 5ʹ- CAATGCCCGTGCTCATTATGG- 3ʹ; ATGL- Forward: 5ʹ- AAGTTGTCTGAAATGCCGCC- 3ʹ, ATGL- Reverse: 5ʹ- AAGTTGTCTGAAATGCCGCC- 3ʹ; MAGL- Forward: 5ʹ- CTTTGAAGGTCCTTGCTGCC- 3ʹ, MAGL-Reverse: 5ʹ- ATTCCATGAGCAGGTAGGCAC- 3ʹ; HSL- Forward: 5ʹ- TATGGCCTCAGCGTTATCTCAC- 3ʹ, HSL-Reverse: 5ʹ- GGCCATATTGTCTTCTGCGAG- 3ʹ.
Western Blot Analysis
Protein extraction and Western blot analysis were performed as described previously33 with some modifications. Adipocytes and adipose tissues were lysed by dissolution in lysis buffer. The proteins obtained were subjected to sodium dodecyl sulfate–polyacrylamides gel electrophoresis, following which the separated protein bands were transferred to a nitrocellulose membrane. The membrane was incubated overnight at 4°C with the following primary antibodies: anti-PRMT4 (1:2000, Cell Signaling Technology, USA), anti-phosphorylated HSL (1:2000, Cell Signaling Technology, USA), anti-HSL (1:1000, Cell Signaling Technology, USA), and anti-beta (β)-tubulin (1:1000, Cell Signaling Technology, USA). Then, the membranes were incubated with the horseradish peroxidase-conjugated secondary antibodies. The specific bands were detected using enhanced chemiluminescence detection reagents with a Bio-Rad (Hercules, CA, USA) imaging system.
Statistical Analyses
All the experiments were repeated at least three times, and the data are presented as the mean ± standard error of the mean. All analyses of the data were performed using SPSS v23 (SPSS Inc., Chicago, IL, USA). Comparisons of two groups were carried out with two-tailed Student’s t-tests, where P < 0.05 was considered statistically significant.
Results
PRMT4 Was Upregulated in White Adipose Tissue and Associated with Increased Serum Triglycerides in Mice with STZ-Induced Diabetes
PRMT4 was reported to be upregulated in retinal pigment epithelial cells from models of STZ-induced diabetes.16 To investigate whether this enzyme is upregulated in adipose tissue, we tested the protein expression of PRMT4 in epididymal white adipose tissue (eWAT) from diabetic mice and found that its expression was more abundant compared with that in non-diabetic mice (Figure 1A and B). To further evaluate the roles of PRMT4 in eWAT, the enzyme was overexpressed in the WAT of diabetic mice via tail vein injection with recombinant AAV carrying the enzyme-coding gene. Consequently, the serum triglycerides were increased by 42% and FFAs were increased by 26% in the diabetic mice infected with the PRMT4-carrying AAV (PRMT4-STZ group) relative to that of mice infected with the AAV control (Ctrl-STZ group), as shown in Figure 1C and D. While, PRMT4 had no effect on the mouse body weight (Figure 1E) and food intake (Figure 1F), and the blood glucose and serum insulin levels were not changed in the PRMT4-overexpressing mice (Figure 1G and H).
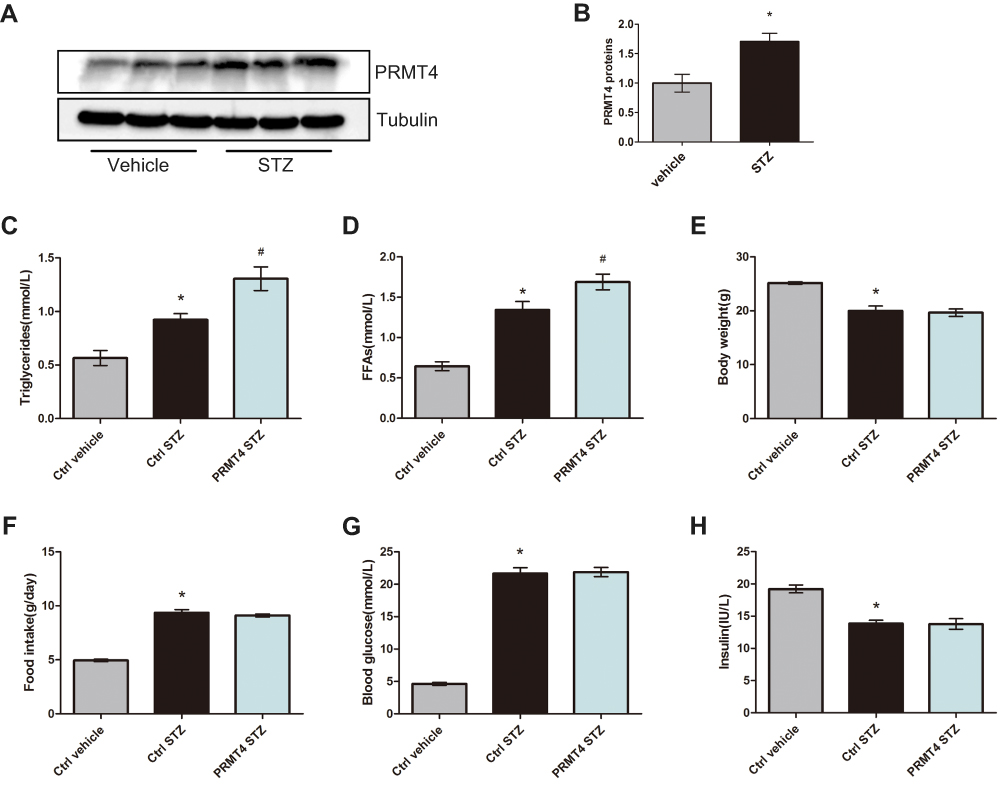 |
Figure 1 PRMT4 is upregulated and results in increased serum triglycerides in mice with streptozotocin-induced diabetes. Notes: (A and B) PRMT4 expression in epididymal white adipose tissue (eWAT) of mice with streptozotocin (STZ)-induced diabetes compared with that of control mice. (C and D) Levels of serum triglycerides and free fatty acids (FFAs) in vehicle-injected adeno-associated virus (AAV)-infected control mice (Ctrl-vehicle), STZ-injected AAV-infected control mice (Ctrl-STZ), and STZ-injected AAV-PRMT4-infected mice (PRMT4-STZ). Additionally, the body weight (E), food intake (F), blood glucose (G), and serum insulin (H) were tested in the three groups of mice (n=6). *P < 0.05 indicates a significant difference between the Ctrl-STZ and Ctrl-vehicle groups. #P < 0.05 indicates a significant difference between the PRMT4-STZ and Ctrl-STZ groups. |
PRMT4 Overexpression Promotes Lipolysis in Type 1 Diabetic Mice and in Fasted Mice
A previous study has shown that lipolysis was the primary modulator of triglyceride levels in mice with STZ-induced diabetes.7 Therefore, we further explored the role of PRMT4 in lipolysis and tested the indicators that reflect fat breakdown. We found that PRMT4 overexpression in diabetic mice resulted in a significant reduction of fat pads weights (Figure 2A and B). Next, we examined the size of the adipocytes in WAT. As shown in Figure 2C and D, the adipocyte size of the PRMT4-STZ group mice was smaller than that in the Ctrl-STZ group.
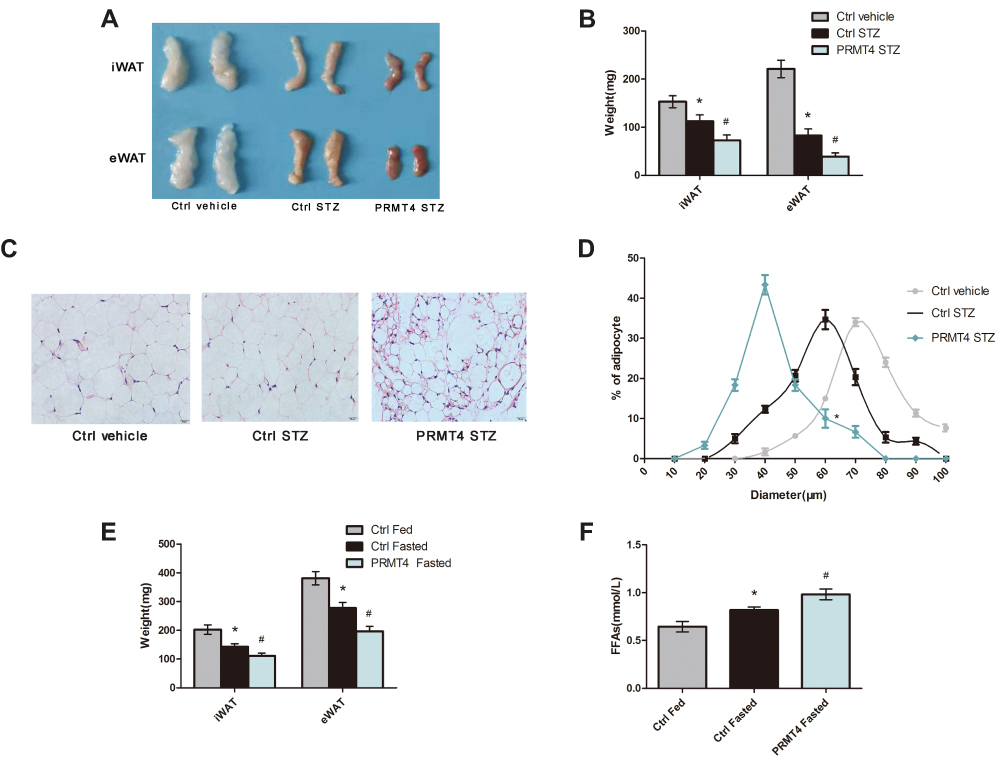 |
Figure 2 PRMT4 overexpression promotes lipolysis in mice. Notes: (A–D) Lipolysis was tested in mice with streptozotocin (STZ)-induced diabetes and in control mice. The gross morphology of the fat pads (A) and the tissue weights (B) of the inguinal white adipose tissue (iWAT) and epididymal white adipose tissue (eWAT) were recorded. Representative images of H&E-stained sections of eWAT (C), and frequency distribution of the adipocyte sizes of eWAT (D). (E and F) Weights of the iWAT and eWAT (E) and levels of serum-free fatty acids (FFAs) (F) determined in adeno-associated virus (AAV) control-infected fed mice (Ctrl-Fed), AAV-control-infected fasted mice (Ctrl-Fasted), and AAV-PRMT4-infected fasted mice (PRMT4-Fasted). *P < 0.05 indicates a significant difference between the Ctrl-STZ and Ctrl-vehicle groups or the Ctrl-Fasted and Ctrl-Fed groups. #P < 0.05 indicates a significant difference between the PRMT4-STZ and Ctrl-STZ groups or the PRMT4-Fasted and Ctrl-Fasted groups. |
Since fasted mice are considered to be classical models for studying insulin deficiency lipolysis, we explored the effect of PRMT4 on lipolysis in these mice. The mice were deprived of food from 8 am to the following 8 am with free access to drinking water. A reduction in fat pads (Figure 2E) and a significant increase in the serum FFAs (Figure 2F) were observed in the mice overexpressing PRMT4 (PRMT4-Fasted) compared with that in the control mice (Ctrl-Fasted). Lipolysis was enhanced by PRMT4 overexpression in fasted mice.
PRMT4 Upregulates the Lipolysis-Related Pathway in Adipose Tissues
To test the hypothesis that PRMT4 affects lipolysis, we investigated the lipolysis pathway, which is regulated by multiple processes and molecules. qPCR analysis revealed that the mRNA levels of ATGL, HSL, and MAGL in adipocytes isolated from WAT of the PRMT4-STZ mice were elevated relative to that of the Ctrl-STZ mice (Figure 3A). Additionally, the HSL activity, which was measured by HSL phosphorylation at Ser660, increased in the PRMT4-overexpressing adipose tissue (Figure 3B and C).
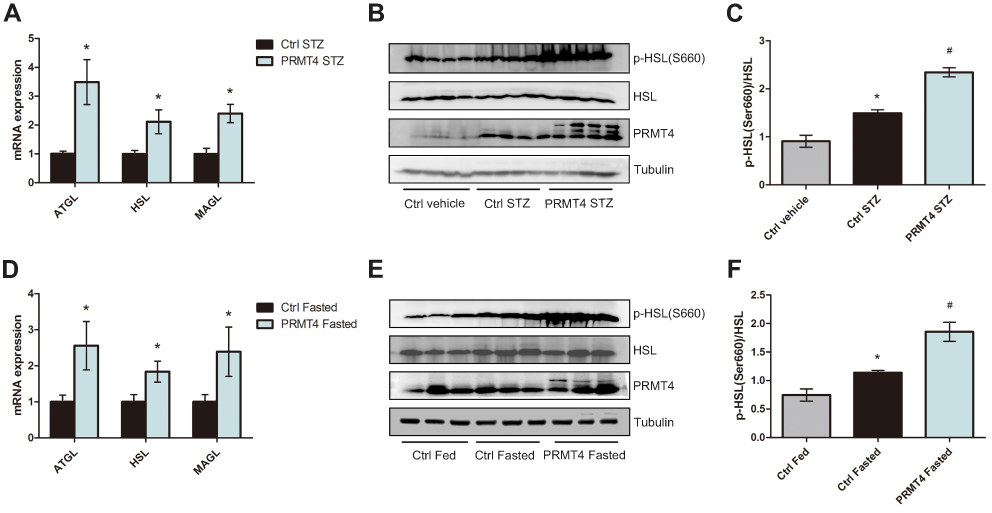 |
Figure 3 PRMT4 overexpression induces the lipolysis pathway in mice. Notes: (A) qPCR analysis of the mRNA levels of ATGL, HSL, and MAGL in epididymal white adipose tissue (eWAT) of mice with streptozotocin (STZ)-induced diabetes (Ctrl-STZ and PRMT4-STZ mice). (B and C) Western blot analysis of HSL phosphorylation at Ser660 in tissues of diabetic mice and vehicle-injected mice (Ctrl-vehicle mice). (D) qPCR analysis of the mRNA levels of ATGL, HSL, and MAGL in adipose tissue of mice after 16 h of fasting (Ctrl-Fasted and PRMT4-Fasted mice). (E and F) Western blot results of HSL phosphorylation at Ser660 in adipose tissue of fasted mice and fed mice (Ctrl-Fed mice). *P < 0.05 indicates a significant difference between the Ctrl-STZ and Ctrl-vehicle groups or the Ctrl-Fasted and Ctrl-Fed groups. #P < 0.05 indicates a significant difference between the PRMT4-STZ and Ctrl-STZ groups or the PRMT4-Fasted group and Ctrl-Fasted groups. |
The lipolysis pathway was also evaluated in fasted mice. Consistent with the results in the diabetic mice, the mRNA levels of ATGL, HSL, and MAGL were much higher in the PRMT4-Fasted mice than that of the Ctrl-Fasted mice (Figure 3D). Additionally, HSL phosphorylation at Ser660 increased in the adipose tissue of PRMT4-overexpressed mice (Figure 3E and F).
PRMT4 Regulates Lipolysis in Mouse Primary Adipocytes
To explore the role of PRMT4 on lipolysis in vitro, we generated PRMT4-overexpressing adipocyte models by infecting adipocytes differentiated from SVFs with the Ad-PRMT4 or Ad-ctrl vectors. After 48 h of infection, the cells were incubated in media with the presence or absence of the β3-adrenergic receptor agonist CL316,243 and/or insulin. As revealed in Figure 4A, CL316, 243 significantly stimulated FFAs release and this effect was inhibited by insulin administration. Compared with that in the control cells, the amount of FFAs released—an indicator of lipolysis and induced by CL316,243—increased in the PRMT4-overexpressing cells. Meanwhile, the inhibitory effect of insulin on CL316, 243-induced lipolysis was still evident (Figure 4A). Next, we tested the effect of PRMT4 knockdown in adipocytes infected with the sh-PRMT4-carrying adenovirus vector. Consequently, the amount of FFAs released was not decreased in these cells after treatment with insulin plus CL316,243 compared with that in cells treated with CL316,243 alone; that is, the inhibitory effect of insulin on CL316,243-induced lipolysis was absent (Figure 4B).
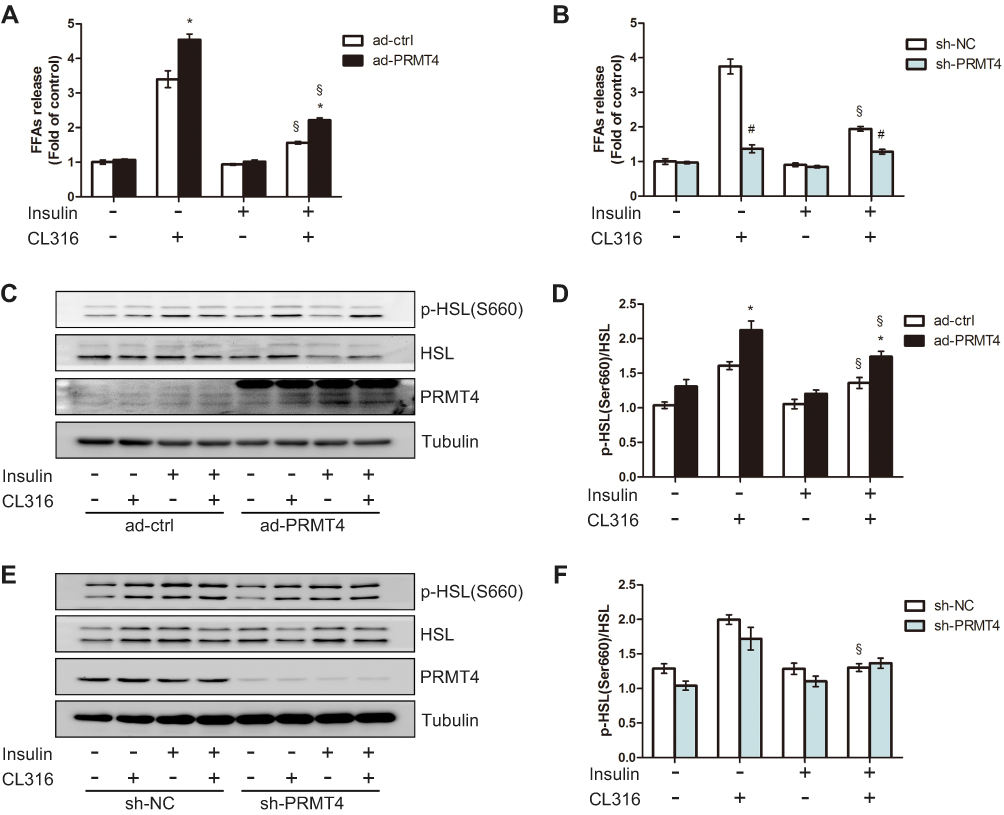 |
Figure 4 PRMT4 regulates lipolysis in mouse primary adipocytes. Notes: (A) Free fatty acids (FFAs) levels in culture media of primary adipocytes infected with adenovirus carrying PRMT4 (Ad-PRMT4) or control adenovirus (Ad-ctrl). (B) FFAs levels in culture media of primary adipocytes infected with adenovirus carrying sh-PRMT4 (sh-PRMT4) or adenovirus carrying the negative control (sh-NC). Cells were treated or not treated with 1 μM CL316,243 and/or 10 nM insulin for 2 h. (C and D) Western blot results of HSL phosphorylation at Ser660 in adipocytes infected with Ad-PRMT4 or Ad-ctrl after treatment as described in part (A). (E and F) Western blot results of HSL phosphorylation at Ser660 in adipocytes infected with adenovirus carrying sh-PRMT4 or sh-NC after treatment as described in part (B). *P < 0.05 indicates a significant difference between the Ad-PRMT4 and Ad-ctrl groups. #P < 0.05 indicates a significant difference between the sh-PRMT4 and sh-NC groups. §P < 0.05 indicates a significant difference between the insulin-treated and insulin+CL316,243-treated groups. |
Additionally, HSL phosphorylation at Ser660 in the adipocytes was examined by Western blot assay. Consistent with the FFA release amount, the HSL phosphorylation level was elevated in the PRMT4-overexpressing adipocytes (Figure 4C and D). Moreover, the inhibitory effect of insulin on the CL316,243-induced activation of HSL phosphorylation was absent (Figure 4E and F).
Discussion
In this study, we showed that PRMT4 induced lipolysis and increased the serum triglycerides in diabetic mice. Two different model systems were applied in our study; namely, T1DM mice, and fasted mice. The data showed that PRMT4 overexpression was accompanied by hyperactive lipolysis in both the diabetic and fasted mice, which was also verified by its promotion of CL316,243-induced lipolysis in mouse primary adipocytes. In summary, the upregulation of PRMT4 in WAT resulted in hyperactive lipolysis and a marked increase in the serum triglyceride levels in T1DM.
PRMT4 is widely expressed in tissues throughout the body and overexpressed in human patients with cancers and T2DM.14,15 In our study, increased PRMT4 expression was observed in the WAT of STZ-induced mice. However, PRMT4 expression varies among different tissues in STZ-induced models of diabetes. For example, its expression increased in the retinal pigment epithelial layer,16,17 whereas it diminished in the glomerular epithelium of rats with STZ-induced diabetes.34 The factors that upregulate the level of PRMT4 in WAT of T1DM mice remain unclear. Previous studies had clarified that PRMT4 expression was upregulated by high glucose levels in retinal pigment epithelial cells,16 and by insulin in hepatocytes.35 On the basis of our present analysis, we infer that the upregulation of PRMT4 in the adipose tissue of diabetic mice may be caused by hyperglycemia rather than insulin, the latter of which is deficient in diabetic mice.
Since PRMT4 has been observed to be upregulated in the WAT of STZ-treated mice, what is the role of this enzyme plays in adipocyte function? PRMT4 promotes adipocytes differentiation and lipid synthesis in vitro by coactivating peroxisome proliferator-activated receptor gamma (PPARγ) and CCAAT-enhancer-binding protein beta (C/EBPβ).25,36,37 However, the effect of PRMT4 on lipid synthesis in adipocytes has not been confirmed in vivo. As suggested in our experiments, PRMT4 overexpression activated lipolysis in STZ-induced diabetic mice and fasted mice and promoted FFAs release in vitro. Lipolysis, a process in which triglycerides stored in adipose tissue are broken down and released into the bloodstream as glycerol and free fatty acids, is characterized by reduced mass of WAT, smaller adipocyte diameter and higher serum FFAs level.38–40 We found that PRMT4 overexpression induced fat pads loss in diabetic mice, which was contradictory to the consequence of its promotion of lipid synthesis. The reason for explaining this phenotype might be that the effect of PRMT4 on activating lipolysis overcomes the effect on promoting lipid synthesis under some conditions, such as type 1 diabetic mellitus and fasting. As the cause of the higher levels of serum triglycerides and FFAs in the diabetic mice, the PRMT4 effect of promoting lipolysis is consistent with its effect of promoting lipid synthesis. To further study the effect of PRMT4 on insulin deficiency-induced lipolysis, we also explored the function of PRMT4 in the fasted mice, in which the activation of lipolysis was caused by insulin deficiency.41 In this model, more fat pats loss and higher serum FFAs levels were also observed in PRMT4-overexpressed mice. We also ascertained that insulin deficiency associated lipolysis might depend on PRMT4 in adipocytes. Based on all these results we inferred that PRMT4 might promote lipolysis induced by insulin deficiency.
Lipolysis depends on the activity of three enzymes: HSL, ATGL, MAGL, each of which possesses a distinct regulatory mechanism.42 In our experiments, we found that PRMT4 upregulated the expression levels of ATGL, MAGL, HSL and activated HSL phosphorylation in T1DM mice and fasted mice. Meanwhile, HSL phosphorylation was activated by PRMT4 in catecholamines stimulated adipocytes. We speculated that PRMT4 promoted lipolysis by up-regulating the expression of these enzymes and activating their activity. But how PRMT4 regulates the transcription of genes related to lipolysis remains unclear. Previous studies had demonstrated that PRMT4 induce autophagy, lysosomes and lipid metabolism in mouse embryonic fibroblasts (MEFs).43 Moreover, overactivation of the autophagic digestion of lipid droplets resulted in increased levels of fatty acids. The previous study had also demonstrated that HSL/ATGL-independent lipolysis relies on the form of autophagy.44 On the bases of these studies, it is suggested that PRMT4 may promote lipid droplet breakdown and the release of FFAs by activating autophagy. However, these possibilities require further research for their confirmation.
Since PRMT4 activates lipolysis in diabetic mice, its inhibitors can be applied to inhibit lipolysis. Selective inhibitors of PRMT4 have been generated and confirmed to have antitumor effects.45,46 The effects of PRMT4 inhibitors on hypertriglyceridemia need further study. We believe that such inhibitors may be a potential therapeutic strategy for clinical dyslipidemia.
This study had the following limitations: (ⅰ) Only the gain-of-function effect was determined, whereas the loss-of-function effect on the metabolic phenotype was not evaluated. In our future study, adipocyte-specific PRMT4-knockout mice and PRMT4 inhibitors will be applied to explore the role of PRMT4 in mice with T1DM. (ⅱ) Whether the specific mechanism of how PRMT4 affects lipolysis be related to autophagy has not been confirmed by experiments. Subsequent studies will systematically explore the specific molecular mechanisms underlying the effect of PRMT4 on lipolysis.
In conclusion, our results suggested that PRMT4 promotes lipolysis, increases the serum FFA content, results in hypertriglyceridemia regulated by lipolysis-related gene expression in T1DM mice. PRMT4 may be a new therapeutic target for ameliorating dyslipidemia of T1DM patients.
Acknowledgments
This work was supported by the Ministry of Science and Technology under Grants (NO: 2016YFC0901203) and the National Natural Science Foundation of China Grants (NO: 81770843). Dr Yuanxiang Li and Dr Miaomiao Peng contributed equally as co-first authors.
Disclosure
The authors report no conflicts of interest in this work.
References
1. Maahs DM, Dabelea D, D’Agostino RB
2. Mooradian AD. Dyslipidemia in type 2 diabetes mellitus. Nat Clin Pract Endocrinol Metab. 2009;5:150–159. doi:10.1038/ncpendmet1066
3. Miller M, Stone NJ, Ballantyne C, et al. Triglycerides and cardiovascular disease: a scientific statement from the American Heart Association. Circulation. 2011;123:2292–2333. doi:10.1161/CIR.0b013e3182160726
4. Goldberg IJ, Eckel RH, McPherson R. Triglycerides and heart disease: still a hypothesis? Arterioscler Thromb Vasc Biol. 2011;31:1716–1725. doi:10.1161/ATVBAHA.111.226100
5. Caballero F, Fernandez A, De Lacy AM, et al. Enhanced free cholesterol, SREBP-2 and StAR expression in human NASH. J Hepatol. 2009;50:789–796. doi:10.1016/j.jhep.2008.12.016
6. Brown MS, Goldstein JL. Selective versus total insulin resistance: a pathogenic paradox. Cell Metab. 2008;7:95–96. doi:10.1016/j.cmet.2007.12.009
7. Willecke F, Scerbo D, Nagareddy P, et al. Lipolysis, and not hepatic lipogenesis, is the primary modulator of triglyceride levels in streptozotocin-induced diabetic mice. Arterioscler Thromb Vasc Biol. 2015;35:102–110.
8. Taskinen MR. Diabetic dyslipidaemia: from basic research to clinical practice. Diabetologia. 2003;46:733–749. doi:10.1007/s00125-003-1111-y
9. Johansen RF, Sondergaard E, Linnebjerg H, et al. Attenuated suppression of lipolysis explains the increases in triglyceride secretion and concentration associated with basal insulin peglispro relative to insulin glargine treatment in patients with type 1 diabetes. Diabetes Obes Metab. 2018;20:419–426. doi:10.1111/dom.2018.20.issue-2
10. Bolsoni-Lopes A, Alonso-Vale MI. Lipolysis and lipases in white adipose tissue - an update. Arch Endocrinol Metab. 2015;59:335–342. doi:10.1590/2359-3997000000067
11. Stockli J, Zadoorian A, Cooke KC, et al. ABHD15 regulates adipose tissue lipolysis and hepatic lipid accumulation. Mol Metab. 2019;25:83–94. doi:10.1016/j.molmet.2019.05.002
12. Chakrabarti P, Kim JY, Singh M, et al. Insulin inhibits lipolysis in adipocytes via the evolutionarily conserved mTORC1-Egr1-ATGL-mediated pathway. Mol Cell Biol. 2013;33:3659–3666. doi:10.1128/MCB.01584-12
13. Bedford MT. Arginine methylation at a glance. J Cell Sci. 2007;120:4243–4246. doi:10.1242/jcs.019885
14. Yang Y, Bedford MT. Protein arginine methyltransferases and cancer. Nat Rev Cancer. 2013;13:37–50. doi:10.1038/nrc3409
15. Porta M, Amione C, Barutta F, et al. The co-activator-associated arginine methyltransferase 1 (CARM1) gene is overexpressed in type 2 diabetes. Endocrine. 2019;63:284–292. doi:10.1007/s12020-018-1740-z
16. Kim DI, Park MJ, Lim SK, et al. High-glucose-induced CARM1 expression regulates apoptosis of human retinal pigment epithelial cells via histone 3 arginine 17 dimethylation: role in diabetic retinopathy. Arch Biochem Biophys. 2014;560:36–43. doi:10.1016/j.abb.2014.07.021
17. Kim DI, Park MJ, Choi JH, et al. PRMT1 and PRMT4 regulate oxidative stress-induced retinal pigment epithelial cell damage in SIRT1-dependent and SIRT1-independent manners. Oxid Med Cell Longev. 2015;617919:2015.
18. Bedford MT, Clarke SG. Protein arginine methylation in mammals: who, what, and why. Mol Cell. 2009;33:1–13. doi:10.1016/j.molcel.2008.12.013
19. Cheng D, Cote J, Shaaban S, et al. The arginine methyltransferase CARM1 regulates the coupling of transcription and mRNA processing. Mol Cell. 2007;25:71–83. doi:10.1016/j.molcel.2006.11.019
20. An W, Kim J, Roeder RG. Ordered cooperative functions of PRMT1, p300, and CARM1 in transcriptional activation by p53. Cell. 2004;117:735–748. doi:10.1016/j.cell.2004.05.009
21. Quintero CM, Laursen KB, Mongan NP, et al. CARM1 (PRMT4) acts as a transcriptional coactivator during retinoic acid-induced embryonic stem cell differentiation. J Mol Biol. 2018;430:4168–4182. doi:10.1016/j.jmb.2018.08.014
22. Wu Q, Bruce AW, Jedrusik A, et al. CARM1 is required in embryonic stem cells to maintain pluripotency and resist differentiation. Stem Cells. 2009;27:2637–2645. doi:10.1002/stem.v27:11
23. Wang SC, Dowhan DH, Eriksson NA, et al. CARM1/PRMT4 is necessary for the glycogen gene expression programme in skeletal muscle cells. Biochem J. 2012;444:323–331. doi:10.1042/BJ20112033
24. Krones-Herzig A, Mesaros A, Metzger D, et al. Signal-dependent control of gluconeogenic key enzyme genes through coactivator-associated arginine methyltransferase 1. J Biol Chem. 2006;281:3025–3029. doi:10.1074/jbc.M509770200
25. Yadav N, Cheng D, Richard S, et al. CARM1 promotes adipocyte differentiation by coactivating PPARgamma. EMBO Rep. 2008;9:193–198. doi:10.1038/sj.embor.7401151
26. Shin HJ, Kim H, Oh S, et al. AMPK-SKP2-CARM1 signalling cascade in transcriptional regulation of autophagy. Nature. 2016;534:553–557. doi:10.1038/nature18014
27. Morel E, Codogno P. A novel regulator of autophagosome biogenesis and lipid droplet dynamics. EMBO Rep. 2018;19. doi:10.15252/embr.201846858
28. Hoffmann JM, Grunberg JR, Church C, et al. BMP4 gene therapy in mature mice reduces BAT activation but protects from obesity by browning subcutaneous adipose tissue. Cell Rep. 2017;20:1038–1049. doi:10.1016/j.celrep.2017.07.020
29. O’Neill BT, Bhardwaj G, Penniman CM, et al. FoxO transcription factors are critical regulators of diabetes-related muscle atrophy. Diabetes. 2019;68:556–570. doi:10.2337/db18-0416
30. Shu L, Hoo RL, Wu X, et al. A-FABP mediates adaptive thermogenesis by promoting intracellular activation of thyroid hormones in brown adipocytes. Nat Commun. 2017;8:14147.
31. Liu KL, Kuo WC, Lin CY, et al. Prevention of 4-hydroxynonenal-induced lipolytic activation by carnosic acid is related to the induction of glutathione S-transferase in 3T3-L1 adipocytes. Free Radic Biol Med. 2018;121:1–8. doi:10.1016/j.freeradbiomed.2018.04.567
32. Jia P, Wu N, Jia D, et al. Downregulation of MALAT1 alleviates saturated fatty acid-induced myocardial inflammatory injury via the miR-26a/HMGB1/TLR4/NF-kappaB axis. Diabetes Metab Syndr Obes. 2019;12:655–665. doi:10.2147/DMSO.S203151
33. Qi G, Zhou Y, Zhang X, et al. Cordycepin promotes browning of white adipose tissue through an AMP-activated protein kinase (AMPK)-dependent pathway. Acta Pharm Sin B. 2019;9:135–143. doi:10.1016/j.apsb.2018.10.004
34. Kim D, Lim S, Park M, et al. Ubiquitination-dependent CARM1 degradation facilitates Notch1-mediated podocyte apoptosis in diabetic nephropathy. Cell Signal. 2014;26:1774–1782. doi:10.1016/j.cellsig.2014.04.008
35. Yeom CG, Kim DI, Park MJ, et al. Insulin-induced CARM1 upregulation facilitates hepatocyte proliferation. Biochem Biophys Res Commun. 2015;461:568–574. doi:10.1016/j.bbrc.2015.04.099
36. Behera AK, Bhattacharya A, Vasudevan M, et al. p53 mediated regulation of coactivator associated arginine methyltransferase 1 (CARM1) expression is critical for suppression of adipogenesis. FEBS J. 2018;285:1730–1744. doi:10.1111/febs.14440
37. Kowenz-Leutz E, Pless O, Dittmar G, et al. Crosstalk between C/EBPbeta phosphorylation, arginine methylation, and SWI/SNF/Mediator implies an indexing transcription factor code. EMBO J. 2010;29:1105–1115. doi:10.1038/emboj.2010.3
38. Americo ALV, Muller CR, Vecchiatto B, et al. Aerobic exercise training prevents obesity and insulin resistance independent of the renin angiotensin system modulation in the subcutaneous white adipose tissue. PLoS One. 2019;14:e0215896. doi:10.1371/journal.pone.0215896
39. Vroegrijk IO, van Klinken JB, van Diepen JA, et al. CD36 is important for adipocyte recruitment and affects lipolysis. Obesity (Silver Spring). 2013;21:2037–2045. doi:10.1002/oby.20354
40. Zhai W, Xu C, Ling Y, et al. Increased lipolysis in adipose tissues is associated with elevation of systemic free fatty acids and insulin resistance in perilipin null mice. Horm Metab Res. 2010;42:247–253. doi:10.1055/s-0029-1243599
41. Matoba K, Lu Y, Zhang R, et al. Adipose KLF15 controls lipid handling to adapt to nutrient availability. Cell Rep. 2017;21:3129–3140. doi:10.1016/j.celrep.2017.11.032
42. Chaves VE, Frasson D, Kawashita NH. Several agents and pathways regulate lipolysis in adipocytes. Biochimie. 2011;93:1631–1640. doi:10.1016/j.biochi.2011.05.018
43. Liu Y, Wang T, Ji YJ, et al. A C9orf72-CARM1 axis regulates lipid metabolism under glucose starvation-induced nutrient stress. Genes Dev. 2018;32:1380–1397. doi:10.1101/gad.315564.118
44. Demine S, Tejerina S, Bihin B, et al. Mild mitochondrial uncoupling induces HSL/ATGL-independent lipolysis relying on a form of autophagy in 3T3-L1 adipocytes. J Cell Physiol. 2018;233:1247–1265. doi:10.1002/jcp.25994
45. Guo Z, Zhang Z, Yang H, et al. Design and synthesis of potent, selective inhibitors of protein arginine methyltransferase 4 against acute myeloid leukemia. J Med Chem. 2019;62:5414–5433. doi:10.1021/acs.jmedchem.9b00297
46. Nakayama K, Szewczyk MM, Dela Sena C, et al. TP-064, a potent and selective small molecule inhibitor of PRMT4 for multiple myeloma. Oncotarget. 2018;9:18480–18493. doi:10.18632/oncotarget.v9i26
 © 2020 The Author(s). This work is published and licensed by Dove Medical Press Limited. The
full terms of this license are available at https://www.dovepress.com/terms
and incorporate the Creative Commons Attribution
- Non Commercial (unported, 3.0) License.
By accessing the work you hereby accept the Terms. Non-commercial uses of the work are permitted
without any further permission from Dove Medical Press Limited, provided the work is properly
attributed. For permission for commercial use of this work, please see paragraphs 4.2 and 5 of our Terms.
© 2020 The Author(s). This work is published and licensed by Dove Medical Press Limited. The
full terms of this license are available at https://www.dovepress.com/terms
and incorporate the Creative Commons Attribution
- Non Commercial (unported, 3.0) License.
By accessing the work you hereby accept the Terms. Non-commercial uses of the work are permitted
without any further permission from Dove Medical Press Limited, provided the work is properly
attributed. For permission for commercial use of this work, please see paragraphs 4.2 and 5 of our Terms.