
Back to Journals » Infection and Drug Resistance » Volume 19
Protective Gene Signatures in the Transition from SIRS to Sepsis: Insights from Integrative Transcriptomics and Validation Across Clinical Cohorts
Authors Gu Q, Li X  , Yang F, Yang F
Received 4 January 2026
Accepted for publication 24 March 2026
Published 31 March 2026 Volume 2026:19 593590
DOI https://doi.org/10.2147/IDR.S593590
Checked for plagiarism Yes
Review by Single anonymous peer review
Peer reviewer comments 3
Editor who approved publication: Dr Hazrat Bilal
Qingmin Gu,* Xiang Li,* Fan Yang, Feng Yang
Department of Emergency Medicine, The Affiliated Hospital, Southwest Medical University, Luzhou, 646000, People’s Republic of China
*These authors contributed equally to this work
Correspondence: Fan Yang, Email [email protected] Feng Yang, Email [email protected]
Background: The molecular mechanisms underlying the transition from systemic inflammatory response syndrome (SIRS) to sepsis remain unclear. Identifying protective genes and their regulatory pathways may improve understanding of sepsis progression and reveal potential therapeutic targets.
Methods: Peripheral blood RNA-sequencing data from 29 patients with sepsis and 11 with SIRS were analyzed. Differentially expressed genes (DEGs) and weighted gene co-expression network analysis (WGCNA) were used to identify candidate genes associated with disease progression. Functional enrichment analyses were then performed. Core genes were selected using LASSO and support vector machine recursive feature elimination (SVM-RFE), and further validated by survival and meta-analyses across GEO cohorts. Single-cell RNA sequencing, combined with SCENIC analysis, was used to characterize cell-specific expression patterns and regulatory networks. An LPS-induced RAW264.7 macrophage model was used for in vitro validation. Traditional Chinese medicine (TCM) monomers were also screened for compounds potentially upregulating core genes.
Results: CTSS and NRG1 were identified as candidate protective genes in the transition from SIRS to sepsis. Both were significantly downregulated in sepsis and consistently validated across GEO datasets. SCENIC analysis suggested that these genes were associated with immune-related transcriptional regulatory networks. Single-cell analysis indicated predominant localization of CTSS in monocytes, while NRG1 showed relative enrichment within this cell population. In vitro, both genes were downregulated in LPS-stimulated macrophages. Several TCM monomers were predicted to upregulate their expression.
Conclusion: Integrated transcriptomic, single-cell, and machine learning analyses identified CTSS and NRG1 as potential protective biomarkers in the progression from SIRS to sepsis. Their immune-cell expression patterns, regulatory associations, and possible pharmacologic modulators provide new clues for understanding sepsis pathogenesis and developing therapeutic strategies.
Keywords: systemic inflammatory response syndrome, SIRS, sepsis, CTSS, NRG1, SCENIC
Introduction
Infection-related systemic inflammatory responses represent one of the most challenging clinical issues in critical care medicine. As infections persist and immune responses become imbalanced, the body may experience systemic inflammatory amplification, inadequate tissue perfusion, and multiple organ dysfunction—collectively forming the state of sepsis. Its mortality rate remains alarmingly high worldwide.1 Clinically, sepsis often evolves from systemic inflammatory response syndrome (SIRS). Despite recent advances in understanding the immunological mechanisms and biomarkers of sepsis, the molecular mechanisms underlying its precursor phase—the transition from SIRS to sepsis—remain poorly defined.2
Currently, commonly used biomarkers such as C-reactive protein (CRP), procalcitonin (PCT), and blood lactate exhibit diagnostic reference value in distinguishing between healthy individuals and sepsis patients. However, their ability to differentiate between SIRS and sepsis is limited, as both conditions involve high levels of inflammatory stress, leading to overlapping changes in these markers.3–5 Therefore, identifying molecules that reflect the host’s protective immune response and play a key regulatory role in the progression from SIRS to sepsis is crucial for achieving early recognition and precise intervention.
In recent years, the advancement of multi-omics technologies has provided new opportunities for revealing the molecular landscape of immune dysregulation in sepsis. Weighted gene co-expression network analysis (WGCNA) can identify modules of genes significantly correlated with phenotypes in high-dimensional transcriptomic data.6 Combined with machine learning algorithms such as LASSO and SVM-RFE, it can further screen for feature genes with high predictive value, demonstrating potential in sepsis subtype identification and prognosis assessment.7–9 Concurrently, single-cell RNA sequencing (scRNA-seq) reveals changes in immune cell composition and molecular heterogeneity at the cellular resolution, enabling the tracing of key genes’ cellular origins and immune functions.10 Building on this, SCENIC (Single-Cell Regulatory Network Inference and Clustering) further reconstructs transcription factor–target gene regulatory networks from single-cell expression matrices and evaluates the activity of distinct regulons, thereby revealing dynamic changes in immune regulatory programs during disease progression.11
Beyond molecular screening, research on natural products and TCM monomers in inflammation regulation has gained increasing attention. Multiple experimental and clinical studies indicate that TCM monomers exert immune homeostasis regulation and tissue protection by inhibiting NF-κB, NLRP3 inflammasome activation, and modulating macrophage polarization.12,13 With the advancement of TCM omics and bioinformatics platforms, evidence for TCM/natural product-based interventions in sepsis is accumulating.14 Concurrently, the ITCM (Integrative Traditional Chinese Medicine) database integrates unified high-throughput transcriptomic data from 496 active TCM monomers across multiple cellular models, providing a reproducible data foundation for systematic screening of “drug-gene expression” associations.15 The establishment of this database enables researchers to screen potential targets for individual Chinese herbal compounds at the whole-genome level and predict their action pathways, providing a vital resource for modernizing the study of traditional medicine mechanisms. However, research frameworks integrating protective gene identification, immune cell localization, and Chinese herbal compound-gene expression regulation systems remain limited, lacking systematic evidence based on real clinical samples.
Based on this, this study systematically identified and validated the protective core genes CTSS and NRG1 in the progression from SIRS to sepsis. This was achieved by integrating clinical peripheral blood transcriptomics with differential expression analysis, WGCNA, machine learning screening, GEO multi-cohort meta-validation, single-cell RNA sequencing combined with SCENIC regulatory network inference, and high-throughput regulatory analysis of traditional Chinese medicine monomers. This study aims to reveal the immune functions of key genes through a multidimensional evidence chain and identify potential drug targets, thereby providing novel molecular evidence and therapeutic directions for the early diagnosis and personalized intervention of sepsis.
Materials and Methods
Study Population and Sample Collection
This study included 29 patients with sepsis and 11 patients with systemic inflammatory response syndrome (SIRS), all admitted to the Emergency Intensive Care Unit (EICU) of the Affiliated Hospital of Southwest Medical University between January 2019 and December 2020. Sepsis diagnosis followed the 2016 Sepsis 3.0 criteria jointly published by the American College of Critical Care Medicine (ACCP) and the Society of Critical Care Medicine (SCCM),16 defined as confirmed or suspected infection accompanied by an increase in the SOFA score of ≥2 points. SIRS diagnosis followed the 1992 ACCP/SCCM criteria: presence of any two or more of the following: temperature >38°C or <36°C, heart rate >90 beats/min, respiratory rate >20 breaths/min or PaCO2 <32 mmHg, white blood cell count >12×109/L or <4×10⁹/L, or immature neutrophil percentage >10%.
Patients aged 18–70 years were enrolled, with informed consent obtained from the participants themselves or their legal guardians. Individuals with a history of chronic organ failure, autoimmune or hematologic disorders, malignancies, or recent immunosuppressive or glucocorticoid therapy were excluded. All subjects had 5 mL of peripheral venous blood collected within 24 hours of admission to the EICU for RNA extraction and transcriptomic sequencing.
RNA Sequencing and Differential Gene Analysis
Total RNA was isolated from each sample with TRIzol (Invitrogen, Carlsbad, CA, USA) following standard operating procedures. The quantity and integrity of the extracted RNA were then assessed on an Agilent 2100 system (Thermo Fisher Scientific, MA, USA). Qualified samples underwent rRNA removal and poly-A+ mRNA purification, followed by fragmentation, end repair, A-tailing, adapter ligation, reverse transcription, and PCR amplification to generate single-stranded circular DNA libraries. Sequencing libraries were processed using the BGISEQ-500/MGISEQ-2000 platform (BGI-Shenzhen, China) for paired-end sequencing. Raw data underwent quality filtering using SOAPnuke (v2.3) to remove adapter sequences and low-quality reads, yielding Clean Reads saved in FASTQ format. Subsequently, HISAT2 software aligned Clean Reads to the reference genome to obtain transcript alignment results.
Following sequencing quality control and alignment, differential gene screening was performed using the DESeq2 package in R software. First, normalization was conducted via the estimateSizeFactors function, followed by calculation of expression differences for each gene using the nbinomTest function. P values were adjusted for multiple testing using the Benjamini–Hochberg method. Differential expression status was assigned to genes with a false discovery rate (FDR) < 0.05 and an absolute log2 fold-change greater than 1.17 Additionally, principal component analysis (PCA) was employed to assess inter-group differences and intra-group data stability.
Weighted Gene Co-Expression Network Analysis
The WGCNA workflow in R was applied to the transcriptomic dataset to dissect coordinated expression patterns linked to clinical status. To enhance network stability, only genes showing the highest quartile of expression variability were retained for further modeling. The parameter β, which governs the transformation of correlation strength into network connectivity, was chosen at a value that allowed the resulting graph to approximate a scale-free structure, ensuring a biologically realistic co-expression topology. Subsequently, the adjacency matrix was computed and transformed into a topological overlap matrix (TOM). Hierarchical clustering and dynamic pruning algorithms were employed to partition genes into distinct modules, each identified by a unique color. Finally, we calculated the correlations between the module-specific genes (module-specific vectors, MSVs) and the clinical phenotypes (SIRS and sepsis) to identify key modules and potential core genes closely associated with disease progression.
GSEA Enrichment Analysis of DEGs
Gene Set Enrichment Analysis (GSEA) was applied to the DEG set in R to examine their potential pathway-level biological implications. The enrichment workflow was implemented through the “clusterProfiler” package (version 4.8.1).18 The reference gene set “c2.cp.kegg.v7.5.1.symbols.gmt”, downloaded from the MSigDB database, was used for KEGG-MEDICUS pathway analysis, as this pathway framework provides a structured reference for interpreting coordinated transcriptomic changes in immune, inflammatory, infection-related, and metabolic processes. The GSEA algorithm calculated enrichment scores (ES), and significant pathways were identified via a 1000-replacement-based significance test. Pathways were considered significantly enriched when the FDR-adjusted probability value met the threshold of <0.05 and the absolute NES exceeded 1. Results were visualized using the R packages “enrichplot” and “ggplot2” to display significant enrichment in Kyoto Encyclopedia of Genes and Genomes (KEGG) pathways.
Analysis of the Intersection Between DEGs and WGCNA Module Genes
To identify candidate key genes closely associated with the SIRS phenotype, a Venn diagram was generated using R to calculate the intersection between differentially expressed genes (DEGs) and WGCNA module genes. The analysis employed the “VennDiagram” package (version 1.7.3). Two gene lists were imported into the R environment, and the intersection region was visualized.
GO and KEGG Functional Enrichment Analysis
The intersecting genes identified through screening underwent Gene Ontology (GO) and Kyoto Encyclopedia of Genes and Genomes (KEGG) functional enrichment analysis to elucidate their biological functions and signaling pathway characteristics. Analysis was performed using the R package “clusterProfiler”, combined with the annotation package “org.Hs.egdb” (version 3.16.0) for gene annotation. GO analysis included three categories: biological process (BP), cellular component (CC), and molecular function (MF). KEGG analysis was based on the human pathway database (KEGG v2023.1).19,20 Significance thresholds were set at adjusted P < 0.05. Results were visualized using the “enrichplot”, “ggplot2”, and “GOplot” packages.
Machine Learning-Based Key Gene Screening
To further identify the most representative potential key genes from 30 candidate genes, two machine learning algorithms were employed: the Least Absolute Shrinkage and Selection Operator (LASSO) and Support Vector Machine–Recursive Feature Elimination (SVM-RFE). LASSO analysis was performed using the R package “glmnet” (version 4.1.7).21 The optimal penalty parameter λ was determined via 10-fold cross-validation, and feature genes were selected under the minimum lambda criterion. The SVM-RFE procedure was carried out using functions provided in the e1071 package (version 1.7–14), which enabled iterative feature removal based on model performance,22 recursively eliminating redundant features based on the criterion of maximizing classification accuracy. The final set of genes representing the intersection of both algorithms was identified as potential core genes for subsequent validation and biological functional analysis.
Survival Analysis
To evaluate the prognostic significance of core genes in sepsis patients, this study performed survival curve analysis using clinical outcome and peripheral blood transcriptome data from the GEO public database dataset GSE65682.23 Patients were stratified into high-expression and low-expression groups based on target gene expression levels. Kaplan–Meier survival curves were generated using GraphPad Prism 7.0, and log-rank (Mantel–Cox) tests were applied to compare intergroup differences. Significance was determined using a two-sided p cutoff of 0.05. GSE65682 is a classic cohort of large-scale peripheral blood transcriptomic and outcome data for sepsis, widely utilized in multiple studies for survival or prognosis-related analyses. It demonstrates excellent reproducibility and representativeness.
Meta-Analysis of External Validation Sets
To validate the consistency of target gene expression across different populations, this study obtained several peripheral blood transcriptome datasets (GSE134347, GSE69063, GSE236713, GSE154918, GSE123729) covering sepsis, SIRS, and healthy control samples. After log2 transformation and normalization, each dataset was divided into Sepsis and SIRS groups. Subsequently, meta-analysis was performed using R software. The “metafor” and “meta” packages were employed to calculate Standardized Mean Differences (SMD), and effect sizes were pooled using a random-effects model (REML). Heterogeneity was quantified by the I2 index, and differences were regarded as significant when the associated p-value fell below 0.05. Finally, forest plots were generated to visualize expression trends and robustness of target genes across multiple cohorts.
scRNA-Seq Analysis
To investigate the expression distribution of key genes in peripheral blood immune cells and the differences in cellular composition across various disease states, single-cell transcriptome sequencing data from five previously collected peripheral blood samples (two normal controls, one SIRS case, and two sepsis patients) were analyzed.24 Sequencing libraries were constructed using the 10× Genomics Chromium platform. Raw data were output in FASTQ format and processed for alignment and counting using CellRanger (v6.1.2).25 Its integrated STAR alignment algorithm performed read mapping and gene quantification, yielding quality control metrics including high-quality cell counts, gene counts, and alignment rates.26
After importing data into R, secondary quality control was performed using Seurat v4.3.0. Cells meeting the following criteria were filtered out: <200 genes, <1000 UMIs, log10GenesPerUMI < 0.7, mitochondrial UMI proportion > 10%, and hemoglobin gene proportion > 5%. Subsequently, DoubletFinder v2.0.3 was employed to remove doublets. The high-quality matrix underwent normalization (NormalizeData) and variable feature identification (FindVariableFeatures), followed by principal component analysis (PCA) for dimensionality reduction.
To eliminate batch effects between samples, the MNN (Mutual Nearest Neighbors) algorithm was employed for integration. A low-dimensional representation of the integrated dataset was obtained through UMAP, allowing visualization of the cellular landscape. SNN (Shared Nearest Neighbor) clustering was then applied (FindClusters) with a resolution parameter of resolution=0.4. Cell identities were assigned with the SingleR framework by matching each cell’s expression profile to reference signatures from the Human Primary Cell Atlas. Subsequently, differences in the number and proportion of major immune cell subpopulations (monocytes, T cells, B cells, neutrophils, etc.) were quantified between the SIRS and Sepsis groups to assess cellular composition shifts under disease conditions. Finally, a sepsis-associated single-cell transcriptomic atlas was constructed, mapping the expression localization of core genes CTSS and NRG1.
SCENIC Transcriptional Regulation Analysis
Multicellular organisms comprise diverse cell types with distinct morphologies and functions. The formation and maintenance of these cell types rely on the coordinated regulation between transcription factors (TFs) and their target genes. Leveraging single-cell transcriptomics, systematic gene regulatory networks (GRNs) can be constructed based on single-cell gene expression profiles, thereby mapping the transcriptional regulatory characteristics of different cell types.
Transcriptional regulatory architecture in the SIRS and sepsis single-cell datasets was decoded using SCENIC, a tool that integrates co-expression analysis with motif enrichment to identify regulons. First, the GRNBoost2 algorithm was used to identify co-expression modules (regulons) between transcription factors and their potential target genes. Subsequently, motif enrichment analysis was performed on each regulon using the RcisTarget database to select high-confidence regulon sets with conserved binding sites. The AUCell algorithm was then applied to calculate the Regulon Activity Score (RAS) for each cell, reflecting the activation level of regulatory modules at the single-cell level. Furthermore, regulon specificity scores (RSS) were calculated to determine regulon associations with specific cell types. Connection specificity indices (CSI) were employed to assess inter-regulon connectivity, identifying potentially co-regulated transcriptional modules. All analyses were performed according to the official SCENIC workflow (https://scenic.aertslab.org), supplemented by R language for result visualization and statistical processing.
Measurement of Target Gene Transcription by qPCR
To detect the expression levels of target genes CTSS and NRG1 under different inflammatory conditions, mouse-derived RAW264.7 macrophage cells were used for in vitro experiments. Cells were cultured in complete medium supplemented with 10% fetal bovine serum (FBS) and incubated at 37°C in a 5% CO2 incubator. When cell confluence reached 70%–80%, the medium was replaced with antibiotic-free medium for 24 h pre-culture prior to modeling.
Cells were divided into SIRS and SEPSIS groups based on stimulation intensity. The SIRS group was stimulated with 50 ng/mL lipopolysaccharide (LPS) for 4 h to induce a mild inflammatory response; while the SEPSIS group was stimulated with 100 ng/mL LPS for 6 h to establish a sepsis model. After the stimulation period, the culture supernatant was removed, and the cells were rinsed three times with PBS to eliminate residual LPS before being harvested for follow-up assays.
Total RNA was isolated using the Cell/Tissue Total RNA Isolation Kit V2 (Vazyme, RC112), and its concentration and purity were quantified with a Nano 600 Nucleic Acid and Protein Analyzer. Reverse transcription was carried out with the HiScript III kit (Vazyme, R312) to generate cDNA, which was amplified quantitatively using the Taq Pro Universal SYBR Mix (Vazyme, Q712) on a Bio-Rad CFX96 Touch thermocycler.
Primer sequences are as follows: CTSS: Forward 5′-GGAGTGAGCACCACACTTCA-3′; Reverse 5′-TCCCAATGGTAGTCCAGGGT-3′; NRG1: Forward 5′-AAACTTGTGGGAACTCCGGG-3′; Reverse 5′-CTCGGGGCTACTCTTGTGTC-3′. Each assay was performed in triplicate, and GAPDH was used as a reference gene. Relative transcript abundance was quantified through the 2−ΔΔCt approach, and expression differences between the SIRS group and the SEPSIS group were compared.
Monomer Analysis Based on ITCM
To identify potential monomers from traditional Chinese medicine capable of regulating the expression of target genes CTSS and NRG1, a systematic screening analysis was conducted using the Intelligent Traditional Chinese Medicine Database (ITCM) platform. This database integrates sequencing data from approximately 500 active components of traditional Chinese medicines across unified high-throughput transcriptomic experiments, providing a systematic reference for the transcriptional regulatory effects of different compounds. During the analysis, transcriptomic data for each traditional Chinese medicine monomer were extracted at the “monomer” level from the database. Gene expression differences between the treatment group and the paired control group were compared, and the log2Fold Change (log2FC) and p-value for each target gene were calculated. Monomers meeting the screening criteria (|log2FC| ≥ 1 and p < 0.05) were considered candidate compounds with significant upregulatory or downregulatory effects on the target genes.Finally, the top 15 monomers ranked by |log2FC| values were visualized using a lollipop chart. The horizontal axis represented log2FC values, while the vertical axis listed the names of the herbal compounds. Threshold lines distinguished up- and down-regulation trends, intuitively demonstrating the direction and magnitude of each compound’s regulation on CTSS and NRG1 expression.
Statistical Analysis
All statistical analyses were performed using R software (version 4.3.2) and GraphPad Prism 7.0. For continuous variables, data distribution was first assessed, and results were presented as mean ± standard deviation (SD) or median with interquartile range (IQR), as appropriate. Between-group comparisons for continuous variables were conducted using the Student’s t-test or Mann–Whitney U-test, depending on data distribution. Categorical variables were expressed as counts or proportions and compared using the χ2-test or Fisher’s exact test, as appropriate.
Unless otherwise specified in the corresponding method subsections, all statistical tests were two-sided, and p < 0.05 was considered statistically significant. For analyses involving multiple testing, statistical significance was determined using a false discovery rate (FDR) < 0.05 after correction, as described in the relevant sections above.
Results
Quality Control and Differential Gene Analysis
To compare the overall differences in peripheral blood transcriptomes between SIRS and sepsis patients, sequencing data underwent standardization and quality control. Violin plots revealed uniform expression distribution across samples, indicating good data quality and no significant systematic bias (Figure 1A). Principal Component Analysis (PCA) results revealed distinct separation of the two groups along PC1 and PC2 dimensions, suggesting significant differences in overall transcriptional patterns between sepsis and SIRS (Figure 1B). Application of DESeq2 yielded 210 genes exhibiting meaningful transcriptional shifts, meeting the dual thresholds of FDR < 0.05 and an absolute log2 fold-change greater than 1. In total, 146 genes were elevated in expression, whereas 64 were reduced (Figure 1C and D). The identification of these differentially expressed genes provides a data foundation for subsequent functional enrichment analysis and key gene screening.
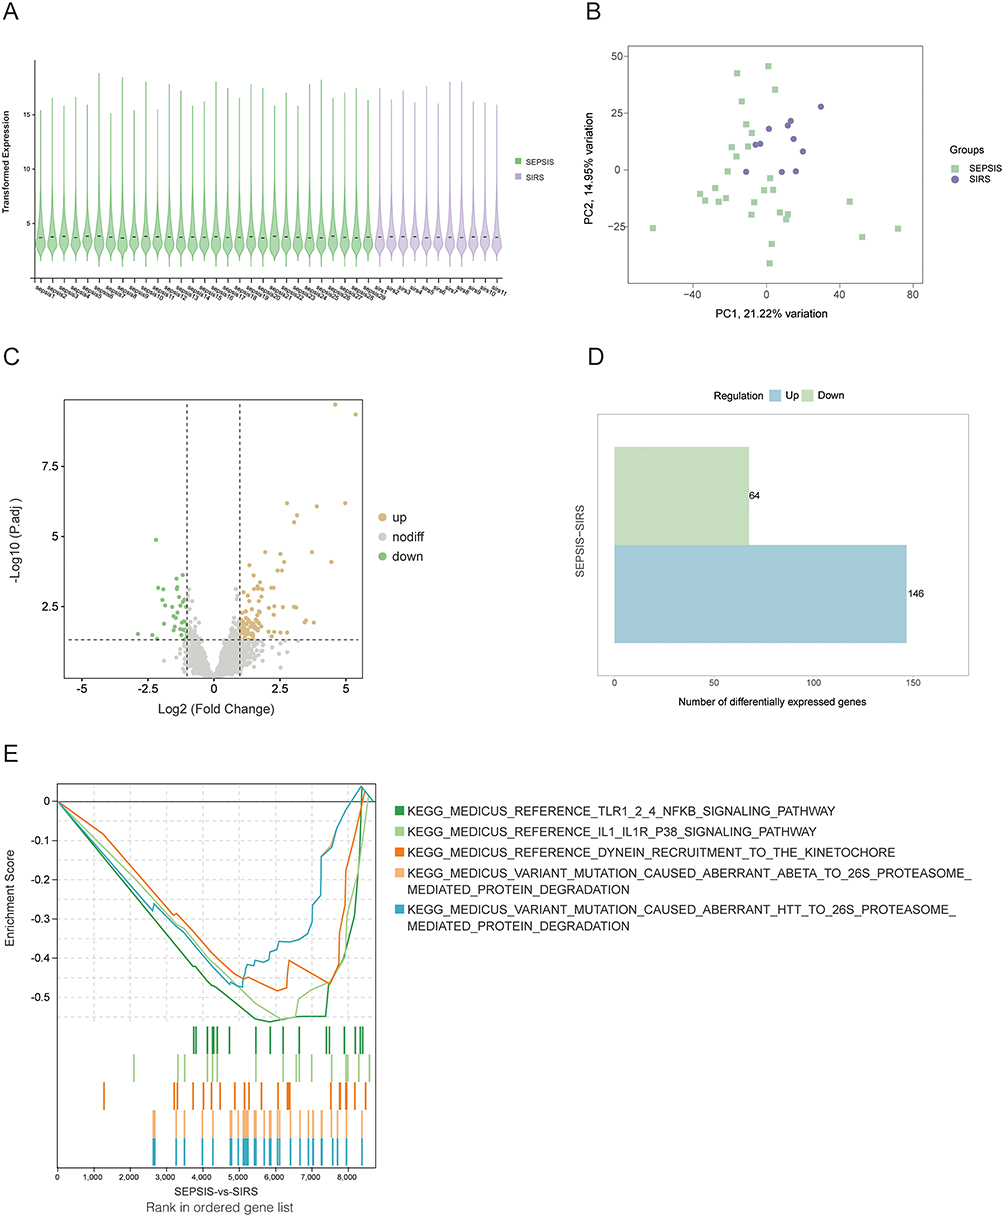 |
Figure 1 Differential transcriptomic analysis and GSEA enrichment between SIRS and sepsis peripheral blood samples. (A) Violin plots show a uniform distribution of gene expression levels across samples, indicating high sequencing quality. (B) Principal component analysis (PCA) demonstrates clear clustering and separation between SIRS and sepsis groups. (C) The volcano plot displays the identified differentially expressed genes (DEGs) (|log2FC| > 1, FDR < 0.05); Yellow-labeled features reflect gene upregulation, while green-labeled features reflect downregulation. (D) The bar chart provides a quantitative summary of the numbers of upregulated and downregulated DEGs. (E) Gene Set Enrichment Analysis (GSEA) based on the KEGG-MEDICUS database reveals that DEGs are mainly enriched in inflammatory signaling pathways (eg, NF-κB and p38 MAPK) and protein homeostasis–related pathways (eg, proteasome-mediated degradation and kinetochore-associated protein transport), suggesting that the transition from SIRS to sepsis may involve the remodeling of inflammation–stress responses and lysosomal–proteolytic degradation networks. |
GSEA Enrichment Analysis of Differentially Expressed Genes
To further elucidate the biological significance of differentially expressed genes between SIRS and sepsis, gene set enrichment analysis (GSEA) was performed on the identified differentially expressed gene sets using the KEGG-MEDICUS database (Figure 1E). Results revealed significant enrichment of these genes across multiple pathways. The top five pathways ranked by Normalized Enrichment Score (NES) were NF-κB signaling pathway, p38 MAPK signaling pathway, proteasome-mediated protein degradation, motor protein transport, and cellular stress response.These pathways collectively involve core processes such as inflammatory signal transduction, immune response amplification, and protein homeostasis regulation. Characteristically activated NF-κB and p38 MAPK signaling indicate persistent proinflammatory responses in the sepsis group, while enrichment of ubiquitin-proteasome system and cellular stress regulation mechanisms (eg, proteasome-mediated degradation, vesicle complex-dependent protein transport) suggests adaptive protein homeostasis remodeling under inflammatory conditions.
Notably, these pathways functionally intersect with lysosomal metabolism and antigen processing, suggesting altered lysosomal homeostasis may mediate the transition from SIRS to sepsis. These findings provide biological rationale for subsequent mechanistic studies targeting key genes.
Construction of Weighted Gene Co-Expression Networks and Key Module Selection
To explore potential co-expression pattern characteristics between SIRS and sepsis, weighted gene co-expression network analysis (WGCNA) was employed for systematic analysis of transcriptomic data (Figure 2). After excluding low-variability genes, a total of 8515 genes were incorporated into network construction. First, hierarchical clustering was performed to detect outliers and ensure data quality (Figure 2A). Subsequently, based on assessments of scale-free properties and average connectivity, the optimal soft threshold was determined as β = 13, at which point the network best exhibited scale-free characteristics (R2 > 0.85) (Figure 2B).
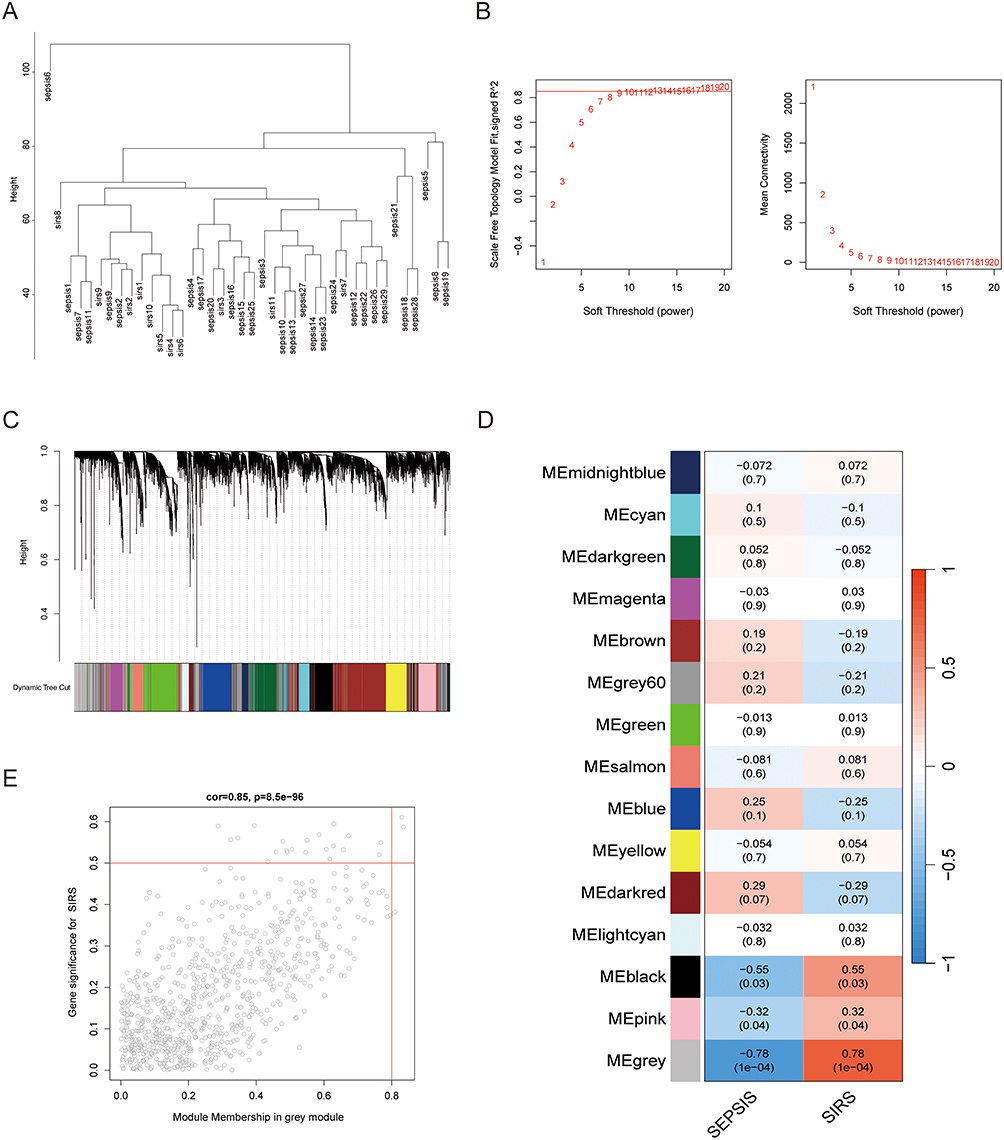 |
Figure 2 Construction of a weighted gene co-expression network and identification of key SIRS-associated modules. (A) Sample hierarchical clustering dendrogram used to detect outlier samples. The results indicate good clustering between the SIRS and sepsis groups, confirming stable sample quality. (B) Network topology analysis. The left panel shows the scale-free topology fit index (R2) under different soft-thresholding powers, and the right panel shows the mean connectivity distribution. A soft-threshold value of β = 13 was ultimately determined, as this setting yielded network characteristics that closely approximated a scale-free topology. (C) The hierarchical clustering tree constructed from the topological overlap matrix (TOM), together with the dynamic tree-cutting procedure, partitioned the genes into color-coded co-expression clusters. (D) The heatmap illustrates how the module eigengenes (MEs) relate to the clinical categories (SIRS vs. sepsis). In total, 15 distinct co-expression groups emerged from the analysis. Among them, the grey module exhibited the highest degree of association with the SIRS state (correlation coefficient = 0.78, p = 1 × 10⁻⁴), suggesting a close association with systemic inflammatory response. (E) Scatter plot showing the correlation between gene significance (GS) and module membership (MM) within the grey module (cor = 0.85, p = 5.8×10−96), indicating that highly connected genes within this module are more strongly associated with the SIRS phenotype. |
Using the selected soft-thresholding power, we constructed the adjacency relationships among genes and subsequently transformed them into a topological overlap matrix (TOM). Gene clusters exhibiting coordinated expression patterns were then delineated by applying the dynamic tree-cutting procedure, resulting in 15 distinct co-expression modules (Figure 2C). Pearson correlation analysis was further conducted between the module eigene (ME) of each module and the clinical phenotypes (SIRS and Sepsis) (Figure 2D). Among all modules, MEgrey exhibited the strongest linkage to the SIRS condition, as reflected by its correlation value of 0.78 and a highly significant p-value of 1e−04. This module contained 788 genes and was thus identified as the key module most closely associated with systemic inflammatory response.
Within the grey module, module membership (MM) and gene significance (GS) showed a significant positive correlation (r = 0.85, p = 5.8×10−96) (Figure 2E), indicating that core genes within the module possess stronger representativeness and biological significance in the SIRS phenotype. This result lays the foundation for subsequent screening of candidate key genes and exploration of their potential roles in the progression from SIRS to sepsis.
Intersection Genes
To further narrow the candidate gene pool and identify key genes significantly associated with disease phenotypes, we intersected the 210 differentially expressed genes (DEGs, |log2FC| > 1, FDR < 0.05) with genes from the gray module (n = 788) most strongly correlated with the SIRS phenotype in WGCNA. The analysis yielded 30 overlapping genes (Figure 3A). These genes exhibited both significant expression differences and co-expression network characteristics, representing a candidate core gene set potentially involved in regulating the progression from SIRS to sepsis.
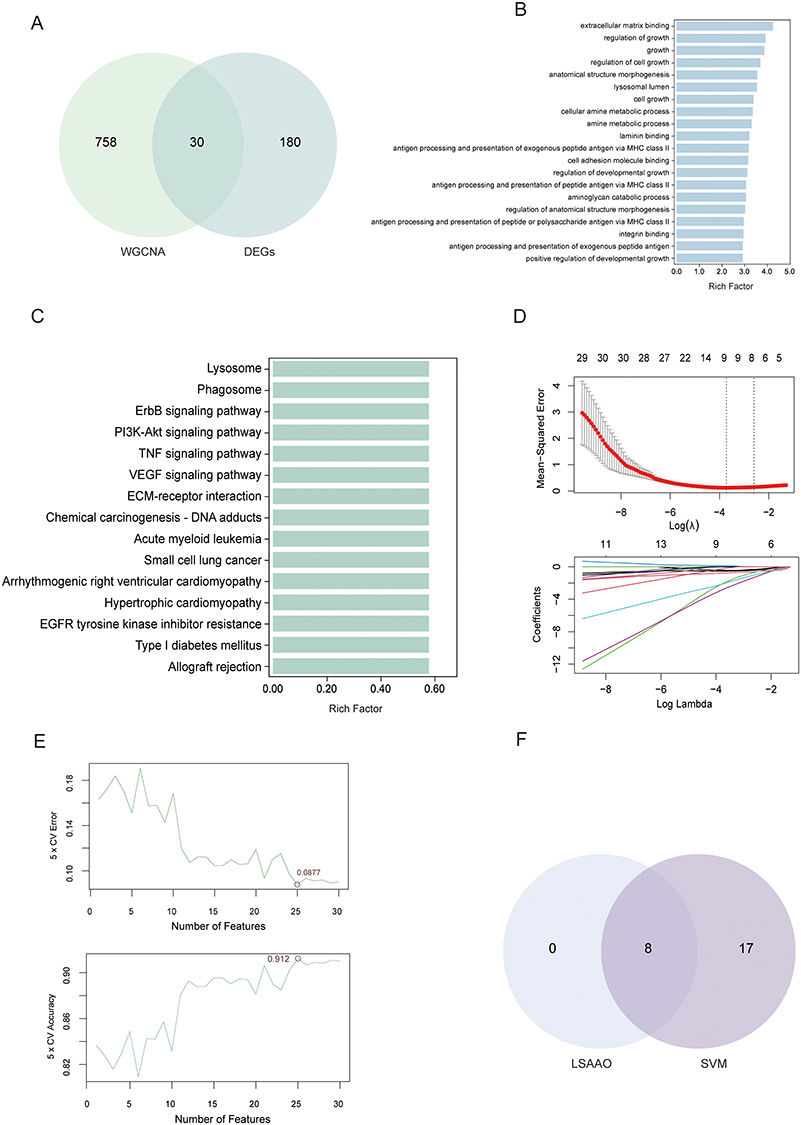 |
Figure 3 Integrated identification of SIRS-associated key genes using multiple algorithms. (A) A Venn plot was generated to visualize the intersection between genes derived from the WGCNA-identified modules and those detected as DEGs, resulting in a refined set of 30 shared candidate genes. (B) Functional enrichment based on GO analysis revealed that this gene set is predominantly associated with processes such as extracellular matrix regulation, developmental modulation, lysosomal components, and pathways related to antigen handling and presentation. (C) KEGG pathway enrichment analysis reveals significant enrichment in lysosome, phagosome, ErbB, PI3K-Akt, TNF, and VEGF signaling pathways, as well as pathways related to cardiomyopathy, allograft rejection, and type I diabetes mellitus. (D) To pinpoint gene signatures associated with the SIRS phenotype, we applied the LASSO approach. The top plot illustrates how the mean-squared error (MSE) changes across a spectrum of λ values, while the bottom plot depicts the shrinkage trajectories of individual gene coefficients. The λ value selected through ten-fold cross-validation—approximately log λ ≈ –3—yielded a final set of eight genes that retained non-zero coefficients. (E) An SVM-driven recursive feature filtering workflow was then applied, in which model performance was recalculated while progressively removing variables. Monitoring the changes in 5-fold cross-validation metrics (CV error = 0.0877; accuracy = 0.912) across different feature counts allowed us to pinpoint the number of predictors that yielded the best classification outcome. (F) The overlap between the gene sets obtained from the LASSO and SVM-based analyses is displayed using a proportional overlap plot, revealing eight robust hub genes—CTSS, NRG1, HLA-DMA, OGFRL1, NAPSB, CPNE5, KIF27, and SHTN1—which were selected as key candidate molecules for subsequent validation and mechanistic studies. |
Functional Enrichment Analysis of Intersecting Genes
To explore the potential biological functions of the 30 intersecting genes, we performed GO and KEGG enrichment analyses (Figure 3B and C).
GO results revealed that these genes primarily participate in biological processes such as extracellular matrix binding, cell growth regulation, morphogenesis, lysosomal compartment, and antigen processing and presentation. This suggests they may play roles in cellular structure maintenance, tissue remodeling, and immune recognition (Figure 3B).
KEGG pathway exploration demonstrated that the overlapping genes were predominantly mapped to a series of metabolism- and immunity-associated routes. These involved lysosomal and phagosomal processes, PI3K–Akt and TNF-driven inflammatory cascades, ErbB- and VEGF-related signaling axes, as well as extracellular matrix–receptor interactions (Figure 3C).
The combined characteristics of these pathways indicate that candidate genes are not only closely associated with antigen processing and degradation mediated by lysosomes and phagosomes, but also involved in inflammatory signaling and cellular survival regulatory networks. Among them, the PI3K-Akt and TNF pathways reflect cellular survival and stress regulation under inflammatory stimulation, while pathways related to lysosomes and extracellular matrix suggest potential metabolic and structural adaptations during immune activation. Collectively, these findings reveal that the intersecting genes predominantly occupy key nodes in inflammatory signal amplification and cellular metabolic remodeling, providing crucial contextual insights for subsequent functional inference of core genes.
Machine Learning-Based Key Gene Screening
To identify more discriminative core features from 30 candidate genes, both LASSO regression and SVM-RFE were applied for screening (Figure 3D–F). In LASSO, the optimal penalty parameter selected by 10-fold cross-validation was log λ ≈ −3 (Figure 3D, dashed line), corresponding to 8 genes with non-zero coefficients: HLA-DMA, OGFRL1, CTSS, NAPSB, NRG1, CPNE5, KIF27, and SHTN1. SVM-RFE evaluated the relationship between feature count and model performance using 5-fold cross-validation. The model selected 25 features when classification error was minimal (CV error = 0.0877) and accuracy was maximal (CV accuracy = 0.912) (Figure 3E). The intersection of the two algorithms yielded 8 common candidate genes (Figure 3F), corresponding to the 8 genes output by LASSO, which were prioritized for subsequent external validation and mechanism analysis.
Identification of Core Genes
Through intersection screening based on LASSO and SVM-RFE, eight potential core genes were identified. To further validate their clinical significance, survival analysis was conducted using the GSE65682 sepsis cohort. Kaplan–Meier curve results (Figure 4A and B) showed that high expression of both CTSS and NRG1 correlated with higher survival rates, suggesting a potential protective role in sepsis. Specifically, CTSS showed a clear separation in survival outcomes between the higher- and lower-expression cohorts (p = 0.0042), while NRG1 showed marginal significance (p = 0.05). This indicates that downregulation of both genes may be closely associated with disease progression and poor prognosis.
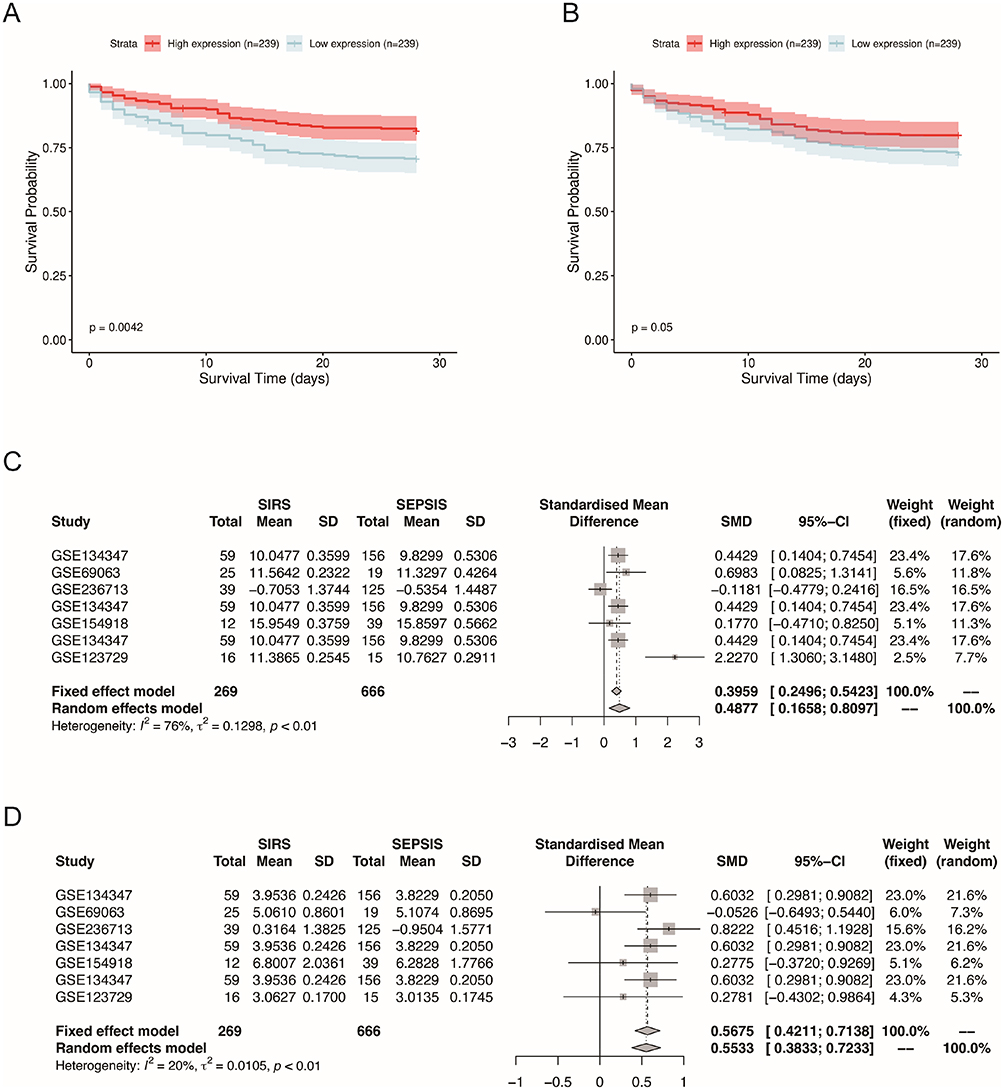 |
Figure 4 Survival analysis and cross-platform validation of the core genes CTSS and NRG1. (A and B) Kaplan–Meier survival curves of the core genes CTSS (A) and NRG1 (B) in the GSE65682 dataset. Patients were divided into high-expression (n = 239) and low-expression (n = 239) groups based on gene expression levels. The results showed that the high-CTSS expression group had significantly higher survival rates than the low-expression group (p = 0.0042), and NRG1 exhibited a similar protective trend (p = 0.05), suggesting potential protective roles of both genes in sepsis. (C and D) Meta-analysis results based on the GEO datasets further validated the cross-platform consistency of the two genes. Under a random-effects model, CTSS (C) showed significantly higher expression in the SIRS group than in the sepsis group (SMD = 0.4877 [0.1658, 0.8097], I2 = 76%, p < 0.01), and NRG1 (D) also showed higher expression in the SIRS group (SMD = 0.5533 [0.3833, 0.7233], I2 = 20%, p < 0.01). Bold font denotes the pooled meta-analysis results, including the overall effect sizes and their 95% confidence intervals under the fixed- and random-effects models, while regular font denotes the estimates from each individual dataset. |
Cross-Platform Verification of Key Gene Signatures
To assess whether CTSS and NRG1 exhibit reproducible expression patterns across diverse patient cohorts and sequencing platforms, this study integrated the GEO peripheral blood transcriptome datasets for meta-analysis (Figure 4C and D). Results showed that CTSS (SMD = 0.4877 [0.1658, 0.8097], p < 0.01, I2 = 76%) and NRG1 (SMD = 0.5533 [0.3833, 0.7233], p < 0.01, I2 = 20%) both showed relatively elevated expression levels in the SIRS cohort compared with the sepsis cohort under the random-effects model, indicating that the trend was directionally consistent across datasets.
This finding aligns with the survival analysis trend, indicating that CTSS and NRG1 are stably downregulated during the transition from SIRS to sepsis. This observation demonstrates robustness across cohorts and platforms, positioning these molecules as potential protective targets for subsequent experimental and drug discovery studies.
Dissecting Immune Cell–Specific Expression Patterns of Core Genes via Single-Cell Analysis
To further elucidate the expression distribution of core genes in peripheral immune cells, this study performed single-cell transcriptome sequencing on five peripheral blood samples (two normal controls, one SIRS patient, and two sepsis patients). Following quality control and clustering analysis, 12 cell clusters were identified (Figure 5A). Based on signature genes and reference database annotations, these clusters were categorized into four major immune cell populations: T cells (clusters 1, 3, 4, 8, 10), monocytes (clusters 2, 5, 6, 11), B cells (clusters 7, 12), and NK cells (cluster 9) (Figure 5B).
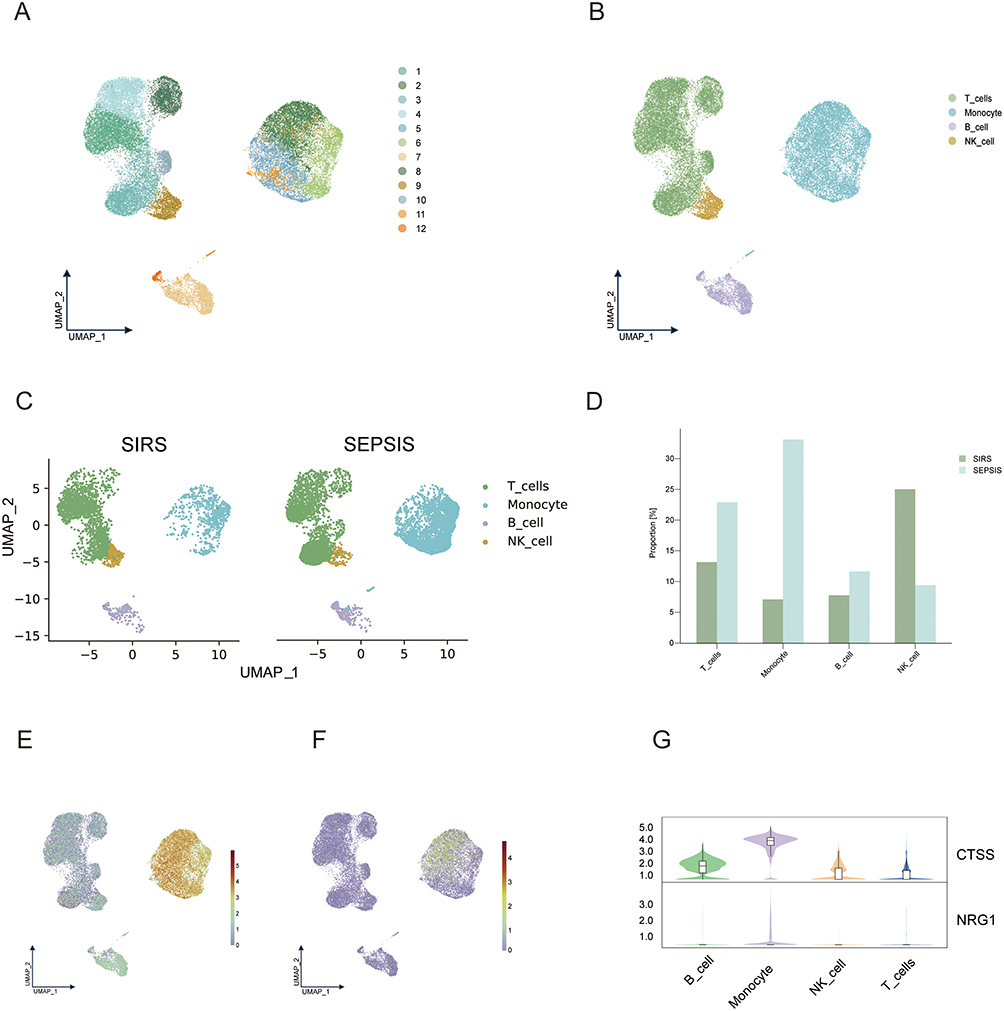 |
Figure 5 Cellular-resolution transcriptomic profiling delineates the immune cell distribution of the core genes. (A and B) Cell clustering and annotation: UMAP clustering identified 12 distinct cell clusters (A). Based on canonical marker genes and reference databases, cells were categorized into four major immune populations: T cells, monocytes, B cells, and NK cells (B). (C) Comparison of SIRS and sepsis cell distribution: UMAP visualization demonstrates distinct immune cell composition between SIRS and sepsis samples. Monocyte clusters were markedly expanded in sepsis, while NK cell clusters were reduced, indicating a profound remodeling of inflammatory and immune responses. (D) Quantitative analysis of cell proportions: The bar chart shows that in sepsis patients, the proportion of monocytes increased from 7.1% to 33.1%, whereas NK cells decreased from 25.0% to 9.4%. Mild increases were observed in B cells (7.8%→11.6%) and T cells (13.2%→22.9%). These findings suggest that monocyte expansion may represent a hallmark of inflammatory amplification and immune–metabolic reprogramming during sepsis progression. (E and F) Single-cell expression mapping of core genes: UMAP plots show that CTSS is predominantly expressed in monocytes and significantly upregulated in sepsis samples (E), while NRG1 exhibits generally low expression but relatively enhanced signals in monocytes (F). (G) Cell-type-specific expression patterns of core genes: Violin plots demonstrate that CTSS expression is highest in monocytes, whereas NRG1, though expressed at lower levels, still shows relative enrichment in the same cell type. This reinforces their monocyte-specific expression patterns and supports their potential as inflammation-regulating and protective biomarkers in sepsis. |
Further comparison of cellular composition between the SIRS and sepsis groups (Figure 5C and D) revealed a significant increase in peripheral blood monocyte proportion in sepsis patients (from 7.1% to 33.1%), accompanied by a marked decrease in natural killer (NK) cell proportion (from 25.0% to 9.4%). B cells and T cells also showed a mild upward trend (B cells: 7.8% → 11.6%; T cells: 13.2% → 22.9%), suggesting that the expansion of the monocyte population during sepsis progression may reflect its key role in inflammatory amplification and immune metabolic remodeling.
Single-cell localization of core genes (Figure 5E–G) revealed that CTSS was predominantly enriched in monocytes, supporting its cell-type-specific association with immune functions related to lysosomal degradation and antigen processing. Although NRG1 exhibited overall low expression levels, it still showed relatively enhanced expression signals in monocytes, indicating a potential auxiliary role in immune regulation or intercellular signaling.
Validation of Core Gene Expression
Based on single-cell lineage distribution and to facilitate subsequent in vitro detection and comparison, we selected RAW264.7 macrophages as the model in our validation experiments. These cells were used for qPCR assessment of CTSS and NRG1 expression changes under different inflammatory stimulation conditions (Figure 6A and B).
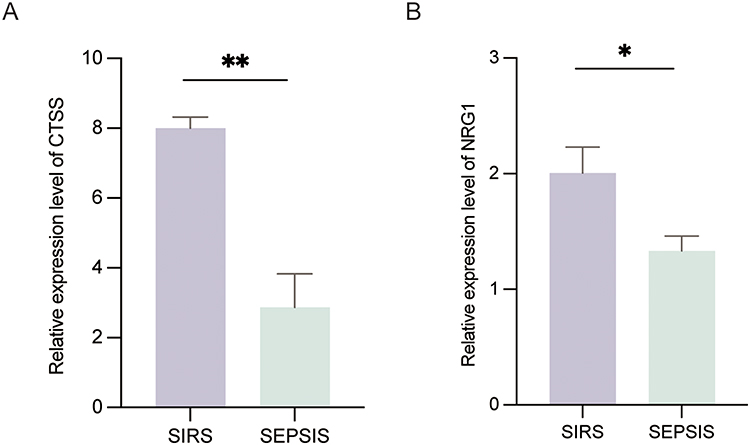 |
Figure 6 qPCR validation of core gene expression differences between SIRS and sepsis models. (A and B) Relative mRNA expression levels of CTSS (A) and NRG1 (B) in RAW264.7 macrophages under different inflammatory states. The SIRS group was stimulated with 50 ng/mL LPS for 4 h, while the Sepsis group was stimulated with 100 ng/mL LPS for 6 h. Expression of both genes increased in the SIRS model, whereas the sepsis model displayed a pronounced reduction (P < 0.05, P < 0.01). Data are presented as mean ± SEM from three independent experiments. Note: * indicates P < 0.05; ** indicates P < 0.01. |
Independent samples t-test results showed that CTSS was significantly higher in the SIRS group than in the Sepsis group (8.00 ± 0.58 vs 2.87 ± 0.58, P < 0.01), while NRG1 expression was also elevated in the SIRS group (2.01 ± 0.15 vs 1.33 ± 0.15, P < 0.05). Overall, both genes exhibited higher expression levels in the mild inflammatory state (SIRS) and decreased expression in the severe inflammatory state (Sepsis), consistent with the trends observed in the prior transcriptomic analysis.
Single-Cell Transcriptional Regulation Network Analysis Reveals Distinct Upstream Regulation of CTSS and NRG1
To further elucidate the upstream transcriptional regulation mechanisms of CTSS and NRG1, this study performed SCENIC transcriptional regulation network analysis based on single-cell transcriptomic data from SIRS and sepsis. Results showed that in the regulon activity heatmap (Figure 7A), sepsis samples were predominantly regulated by SPI1 and ETS2 networks, whereas SIRS samples exhibited relatively higher activity of ETS1, JUND, ZEB1, and EZH2 regulons, indicating distinct transcriptional regulatory patterns in immune cells across the two inflammatory states. The regulon specificity score (RSS) ranking plot (Figure 7B) showed that SPI1 and STAT1 ranked highest in the Sepsis group, while ETS1 and AHR exhibited higher specificity scores in the SIRS group.
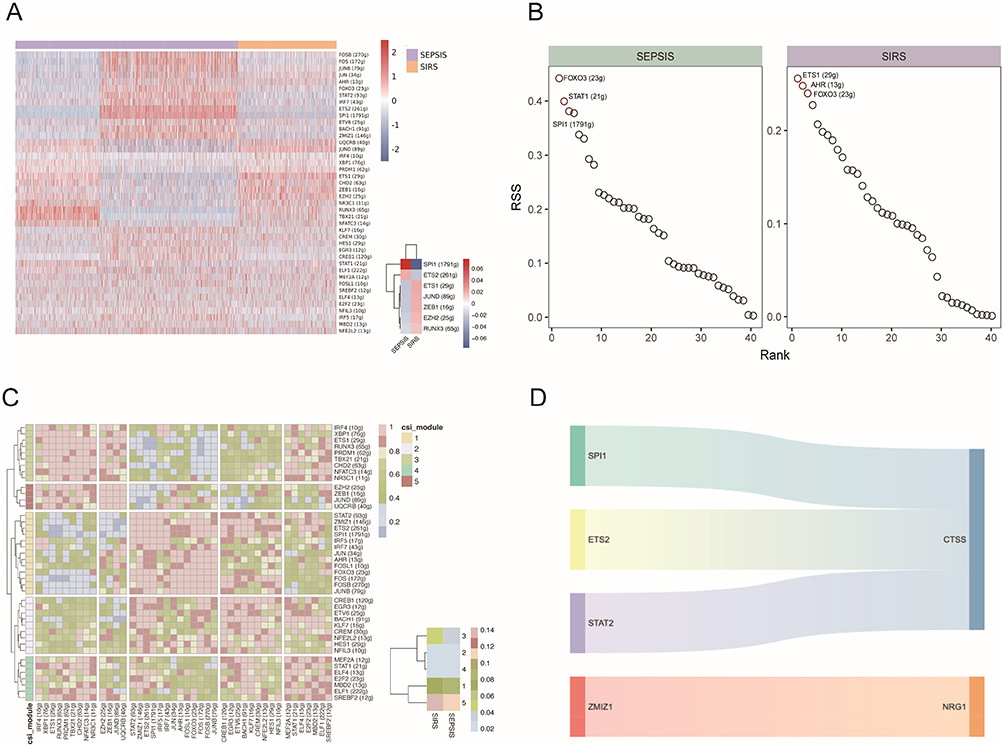 |
Figure 7 Results of single-cell SCENIC transcriptional regulatory network analysis. (A) Regulon activity heatmap (grouped by SIRS and Sepsis: purple represents the sepsis group; Orange represents the SIRS group). Rows denote different regulons; columns denote cells from different cell populations. Colors transition from blue to red, indicating increasing RAS activity scores from low to high. Higher RAS scores reflect stronger regulon activity within that population. The simplified heatmap in the lower right corner visually highlights the high activity of SPI1 and ETS2 in sepsis, while ETS1, JUND, ZEB1, and EZH2 show elevated activity in the SIRS group. (B) Regulon-specificity score (RSS) ranking plot. The horizontal axis shows the ranking order, while the vertical axis indicates the corresponding RSS values. Regulons with higher RSS scores may be more specific to that cell population. The plot specifically highlights the RSS values of the top 3 TFs in both groups. (C) CSI module correlation heatmap between regulons. Both rows and columns represent regulons, with different colors indicating varying degrees of CSI correlation values. The simplified heatmap in the lower right corner visually indicates that both SIRS and Sepsis are concentrated in Module 5. (D) Core gene regulatory network spider diagram. CTSS is a downstream target gene of ETS2, SPI1, and STAT2, while NRG1 is a downstream target gene of ZMIZ1. |
In the regulatory module correlation analysis (CSI) heatmap (Figure 7C), regulons with high CSI values may share similar cellular functions and jointly regulate downstream genes. Both SIRS and sepsis sample module networks converge on Module 5, where the co-regulatory core formed by EZH2–ZEB1–JUND–UQCRB exhibits higher connectivity in the SIRS group, suggesting this module may regulate early inflammatory responses.
Finally, the upstream transcription factor-target correspondence mulberry diagram visualized the positioning relationships of core genes within the transcriptional network: CTSS serves as a downstream target of the ETS2, SPI1, and STAT2 regulatory networks, while NRG1 belongs to the ZMIZ1 regulatory ensemble (Figure 7D). This finding provides clues for subsequent functional experiments to validate their upstream regulatory mechanisms.
Screening of Natural Compounds Affecting CTSS and NRG1 Expression
To explore the regulatory effects of potential natural compounds on the core genes CTSS and NRG1, this study analyzed the impact of 496 bioactive Chinese herbal monoconjugates on their expression profiles using the ITCM database (Figure 8).
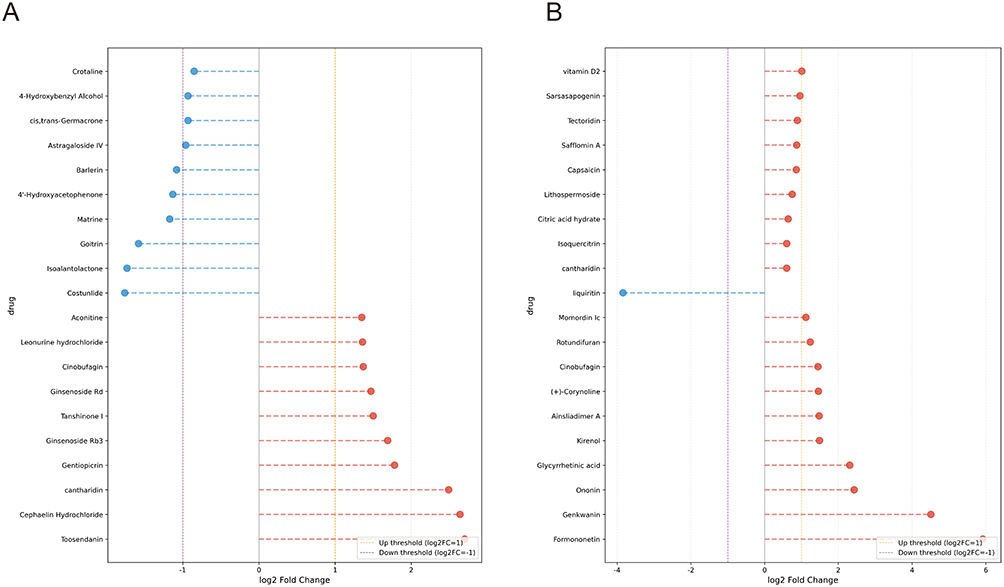 |
Figure 8 Predicted regulatory compounds of CTSS and NRG1 identified from the ITCM database. (A) Lollipop plot of compounds predicted to regulate CTSS expression. Red dots indicate compounds that upregulate expression, while blue dots indicate those that downregulate expression. (B) Lollipop plot of compounds predicted to regulate NRG1 expression. The corresponding log2FC values of each compound reflect their upregulating or downregulating effects on gene expression. |
For CTSS (Figure 8A), multiple compounds significantly altered its expression levels. As shown, Cantharidin, Cephaelin Hydrochloride, and Toosendanin significantly upregulated CTSS expression (log2FC > 2), while Isoalantolactone, Costunlide, and Goitrin downregulated it. For NRG1 (Figure 8B), directional regulatory effects were also observed for multiple compounds. Multiple drug monomers, such as Genkwanin, Ononin, and Glycyrrhetinic acid, significantly upregulate this gene expression, with Formononetin exhibiting the most pronounced effect (log2FC > 4). Conversely, Liquiritin significantly downregulates NRG1 expression (log2FC < -3), showing a strong inhibitory trend.
These findings indicate that different types of Chinese herbal monomers can modulate the transcriptional levels of CTSS and NRG1 through multiple pathways, providing a reference basis for subsequent screening of candidate compounds with anti-inflammatory or immunomodulatory potential.
Discussion
This study aimed to systematically elucidate the key molecular events and potential regulatory mechanisms underlying the progression from systemic inflammatory response syndrome (SIRS) to sepsis. By integrating multi-omics data with experimental validation, we delineated the transcriptional landscape underlying the disease transition and further refined key molecular features using a workflow incorporating co-expression network modeling, differential transcriptomic profiling, and data-driven feature-selection algorithms, identified a set of candidate genes closely related to disease staging. Subsequent survival analysis and multi-platform validation pinpointed CTSS and NRG1 as core genes significantly associated with the progression from SIRS to sepsis.
Further single-cell transcriptomic analysis revealed distinct expression patterns of these two genes among peripheral immune cell populations. CTSS was highly enriched in monocytes/macrophages, whereas NRG1 exhibited lower overall expression but a relatively elevated trend within monocytes. SCENIC-based regulatory network analysis indicated that CTSS is co-regulated by inflammation-associated transcription factors such as SPI1, ETS2, and STAT2, while NRG1 is primarily regulated by ZMIZ1, suggesting their involvement in distinct signaling pathways related to inflammatory amplification and tissue repair. Moreover, analysis of the ITCM compound database identified multiple bioactive herbal monomers capable of bidirectionally modulating the expression of these two genes, providing potential leads for subsequent pharmacological intervention and mechanistic exploration.
In summary, this study established a comprehensive molecular landscape of SIRS-to-sepsis evolution through a multi-level integration of bioinformatics and experimental approaches. From the global transcriptomic level to single-cell regulatory networks, we delineated the pivotal roles of CTSS and NRG1 in the inflammatory transition process and proposed potential upstream regulatory axes and natural compound–based therapeutic clues for future investigation.
CTSS: From Lysosomal Protease to a Protective Marker in the SIRS–Sepsis Transition
Cathepsin S (CTSS) is a lysosome-associated cysteine protease that is highly expressed in immune cells such as monocytes/macrophages, dendritic cells, and B cells. It is regarded as a pivotal “hub molecule” linking lysosomal protein homeostasis to immune responses. Recent reviews have highlighted that CTSS, on one hand, maintains intralysosomal protein degradation and antigen processing, thereby regulating MHC-II molecule cleavage and presentation; on the other hand, once secreted extracellularly, it contributes to extracellular matrix (ECM) remodeling and activates protease-activated receptors (PARs), amplifying inflammatory cascades.27 Multiple basic and clinical studies have further demonstrated that CTSS is persistently overexpressed in various inflammation-related diseases—including autoimmune disorders, atherosclerosis, and chronic pulmonary diseases—making it a potential therapeutic target.28
In inflammatory and infectious diseases, CTSS not only participates in antigen presentation but also plays an integral role in several classical inflammatory signaling pathways. For instance, in hepatic macrophages and RAW264.7 cells, blocking CTSS markedly reduces the NF-κB signaling response triggered by LPS as well as the production of inflammation-related cytokines, suggesting that CTSB/CTSS cooperatively mediate NF-κB–dependent inflammatory amplification. In parallel, studies on tumor cells have shown that CTSS interference affects the EGFR–ERK and PI3K–Akt/mTOR signaling axes, thereby regulating autophagy and cell death—indicating that CTSS can also influence cell fate through membrane receptor and downstream kinase pathways.29
These findings are highly consistent with our KEGG enrichment results: the intersection genes between DEGs and WGCNA modules were significantly enriched in the Lysosome, Phagosome, PI3K–Akt signaling, TNF signaling, and ECM–receptor interaction pathways. Collectively, these pathways outline an integrated “lysosome–phagosome–inflammatory signaling–extracellular matrix” network, within which CTSS serves as a key enzymatic node. This pathway-level evidence provides strong mechanistic support for identifying CTSS as a core candidate gene in the SIRS–sepsis transition.30
Notably, previous studies investigating CTSS in sepsis have mostly regarded it as a deleterious pro-inflammatory factor. A recent multi-omics analysis reported that CTSS is highly expressed in monocytes of sepsis patients and serves as a risk marker for poor prognosis; moreover, administration of CTSS agonists in murine models aggravated tissue inflammation and macrophage infiltration.31 At the same time, direct sepsis-specific evidence for CTSS remains relatively limited, and currently available support is still emerging from integrative transcriptomic, single-cell, and experimental studies rather than from extensive clinical validation. In contrast, our findings offer a complementary perspective:
- In Within the cohort (29 sepsis, 11 SIRS), CTSS exhibited a higher transcriptional abundance in SIRS samples relative to those from sepsis patients—a trend consistently reproduced across theindependent GEO datasets in meta-analysis and correlated with better short-term survival outcomes;
- In the in vitro qPCR model, CTSS expression in RAW264.7 macrophages was markedly higher under mild LPS stimulation (SIRS condition) than under severe stimulation (sepsis condition);
- Single-cell sequencing further revealed CTSS enrichment specifically in monocyte/macrophage populations, consistent with the altered monocyte proportions observed in clinical samples.
Together, these findings suggest that during the dynamic transition from SIRS to sepsis, CTSS may not simply act as a “the-higher-the-worse” molecule. Rather, in the early or moderate inflammatory stages, elevated CTSS levels might help sustain lysosomal function, antigen clearance, and immune homeostasis, whereas in prolonged or excessive inflammation, its downregulation could reflect immune dysfunction and correlate with worse prognosis. This dose- and stage-dependent pattern aligns with emerging evidence that cysteine proteases exert “double-edged sword” roles in immune regulation.32,33
At the transcriptional regulatory level, our SCENIC analysis provided further insights into the upstream network of CTSS. Earlier research has demonstrated that PU.1 (SPI1), a key transcriptional driver in the myeloid lineage, can directly interact with the CTSS promoter and enhance its transcriptional activity in antigen-presenting immune cells; loss of PU.1 markedly reduces CTSS expression and impairs MHC-II–related antigen processing.34 This positive regulatory relationship between PU.1 and CTSS has been repeatedly validated in both fish and mammalian models.35 In our SCENIC analysis, CTSS was identified as a convergent target of the SPI1, ETS2, and STAT2 regulons. Interestingly, although SPI1/ETS2 regulon activity was elevated in the sepsis group, overall CTSS expression was lower, suggesting that transcription factor activity alone may not fully account for CTSS expression changes in sepsis. This apparent discordance indicates that the regulation of CTSS during sepsis may be more complex than expected and warrants further investigation in future mechanistic studies.
In summary, our study extends the current understanding of CTSS through three major contributions:
- Disease-stage perspective: Unlike prior studies that merely compared “sepsis vs. healthy”, we focused on the transitional stage from SIRS to sepsis and found that CTSS increases during mild inflammation but decreases upon disease progression—suggesting it may serve as an early instability warning signal rather than a purely detrimental factor.
- Multilevel integrative evidence: By combining bulk RNA-seq, WGCNA, machine learning, survival and meta-analyses, single-cell transcriptomics, and SCENIC regulatory network analysis, we demonstrated that CTSS exhibits phenotype association (SIRS vs. sepsis), prognostic relevance (survival), cell lineage specificity (monocytes), and a putative upstream transcriptional regulatory context suggested by SCENIC (including SPI1/ETS2/STAT2-associated regulons).
- Pharmacological modifiability: Using the ITCM database, we identified several bioactive herbal compounds capable of significantly upregulating or downregulating CTSS expression, offering actionable candidates for therapeutic modulation of the SIRS–sepsis transition through the regulation of lysosomal and antigen-processing pathways.
Future research can be further expanded in three directions: first, Prospective cohort evidence is still needed to substantiate the early-stage predictive capacity of CTSS and to evaluate its diagnostic performance relative to PCT and CRP; second, small-molecule modulation should systematically evaluate the effects of CTSS upregulation or downregulation on immune phenotypes and prognosis in monocyte/macrophage systems and sepsis animal models; and third, integrative studies combining epigenomic and proteomic approaches are warranted to elucidate the specific mechanisms by which CTSS expression is reprogrammed under SPI1 and ETS2 regulation across different inflammatory stages, thereby determining whether CTSS is more appropriately positioned as a “biomarker” or a “therapeutic target”, which will directly inform future intervention strategies.
NRG1: A Potential Protective Factor in Systemic Inflammation and Its Significance in This Study
Neuregulin-1 (NRG1) is a broadly expressed member of the growth factor family that interacts with ErbB receptors and participates in the development and repair of multiple tissues, including the cardiovascular system, central nervous system, and epithelial barriers. It is widely recognized as a prototypical protective signaling molecule. Numerous reviews and experimental studies have shown that the NRG1/ErbB axis mitigates oxidative stress and inflammatory responses by modulating the ERK/MAPK, PI3K-Akt, and NOX4–NLRP3/caspase-1 pathways, thereby alleviating tissue injury in ischemia–reperfusion and heart failure models.36–39 In the vascular system, endothelial cells secrete NRG1 under inflammatory, hypoxic, or oxidative stress conditions, which in turn suppresses vascular remodeling and endothelial senescence, suggesting that NRG1 also functions as a stress-induced self-protective factor.40
In the context of inflammation and immune regulation, NRG1 is considered to play an immune-balancing role. In models of spinal cord injury and autoimmune disease, exogenous NRG1 reshapes the cytokine profiles of monocyte–macrophage and T/B lymphocyte populations, promoting a more regulatory immune response that attenuates neuroinflammation and facilitates functional recovery.41 Recent transcriptomic studies have identified NRG1-VII, a myeloid-specific splicing isoform, suggesting that monocytes and macrophages themselves may represent an important source of NRG1.42 Clinical studies of acute lung injury and ARDS have reported an enrichment of NRG1 in bronchoalveolar lavage samples as well as in circulating plasma, with these elevations tracking closely with inflammatory burden and highlighting NRG1 as a candidate marker of epithelial injury and ventilation-related stress.43
Consistent with these organ-specific findings, several sepsis-related studies suggest that NRG1 may exert a protective role in systemic inflammation. In a rat model of sepsis, administration of recombinant human NRG1 (rhNRG1) improved cardiac function, mitigated endothelial barrier disruption, and suppressed the expression of inflammation- and apoptosis-related molecules, thereby enhancing survival.35 Another study found that the α7-nicotinic acetylcholine receptor agonist GTS-21 alleviated sepsis-induced atrial electrical remodeling and arrhythmia susceptibility by modulating macrophage polarization and NRG1 secretion.44 Collectively, these findings support the concept that under systemic inflammatory conditions, NRG1 contributes to both tissue protection and the regulation of myeloid immune cell states. Taken together, these findings provide experimental support for a protective role of NRG1 in sepsis-related organ injury and immune dysregulation, although direct clinical evidence in human sepsis remains comparatively limited.
Building upon these prior insights, the present study provides new evidence and interpretation of the relationship between NRG1 and sepsis from the perspective of peripheral blood transcriptomics and multi-cohort human data. In transcriptome data from 29 sepsis and 11 SIRS patients, a noticeable elevation of NRG1 was observed in SIRS, whereas its expression declined in the sepsis group. This trend was further supported by survival analysis in the large independent cohort GSE65682, where patients with high NRG1 expression exhibited better short-term survival, suggesting that NRG1 may function as a protective biomarker during sepsis progression. Furthermore, a meta-analysis across the GEO datasets demonstrated that NRG1 expression was consistently higher in SIRS or control groups than in sepsis groups, with a stable combined effect size, thereby strengthening the robustness of this association.
Single-cell sequencing results complemented these findings from a cellular lineage perspective: NRG1 exhibited lower expression levels across immune cells overall, but showed slightly elevated expression in monocyte populations relative to other cell types. This aligns with its previously identified “myeloid-derived subtype” designation.40 SCENIC analysis further suggests that NRG1 primarily resides downstream of the ZMIZ1 regulon. Previous studies indicate that IL-1 signaling from myeloid cells can suppress NRG1 expression, thereby influencing intestinal epithelial repair processes.45 In the context of our findings, the downregulation of NRG1 together with the significantly increased proportion of monocytes in the sepsis group may suggest a potential association between inflammatory stress and reduced NRG1 expression. However, this possibility was not directly examined in the present study and should therefore be interpreted with caution. Further mechanistic studies will be needed to clarify the regulatory basis of NRG1 dysregulation in sepsis.
Compared with previous studies, this work provides three major extensions and new insights into the field of NRG1 research:
- Emphasizing “systemic inflammatory staging” rather than simple disease comparison: Whereas most previous studies focused on organ-specific contexts such as sepsis-associated myocardial injury, acute lung injury, or spinal cord injury, our analysis traced the continuum from SIRS to sepsis and found that NRG1 expression was relatively elevated during the “early inflammatory/compensatory stage” but downregulated during “progressive sepsis”, showing a positive correlation with short-term survival. This pattern aligns more closely with a dynamic model of protective factor depletion during disease progression.
- Establishing a multi-level evidence chain linking “peripheral blood–single-cell–regulatory network”: By combining evidence derived from bulk transcriptomic profiling, survival and meta-analytic validation, single-cell RNA sequencing, and SCENIC-based regulatory network modeling, we demonstrated that NRG1 is not only associated with phenotype and prognosis but also exhibits low yet relatively concentrated expression in monocytes, together with a SCENIC-inferred association with the ZMIZ1 regulon. This provides a new framework for understanding systemic inflammation from the perspective of myeloid-associated NRG1 expression and its predicted regulatory context.
- Proposing pharmacological modulability: Using the ITCM high-throughput transcriptomic database, we identified several natural compounds capable of significantly upregulating NRG1 expression (including vitamin D2, sarsasapogenin, tectoridin, glycyrrhetinic acid, and formononetin), as well as liquiritin, which markedly downregulates NRG1. These findings offer a preliminary pool of candidate molecules for future pharmacological studies aimed at enhancing NRG1 protective signaling or fine-tuning its expression levels.
Finally, the available baseline clinical and laboratory characteristics of the study cohort were also summarized in Supplementary Table 1 to provide additional clinical context for the molecular findings. In addition to the 28-day outcome distribution, these variables included inflammatory and hematologic indices (WBC, neutrophils, monocytes, lymphocytes, and PCT), as well as markers related to organ injury or dysfunction, such as ALT, total bilirubin, creatinine, and troponin. Although the relatively small cohort size limited statistical power for detecting significant between-group differences across all variables, the sepsis group showed a generally higher burden of inflammatory activation and organ injury than the SIRS group, consistent with the biological and clinical progression expected in systemic inflammatory deterioration. Similarly, clinical studies in critically ill ICU populations have shown that systemic inflammation, organ dysfunction, and greater severity burden are closely associated with mortality, underscoring the importance of interpreting transcriptomic findings within an integrated clinical context.46 In this regard, the stage-associated and prognostic expression patterns of CTSS and NRG1 observed in our study may have potential relevance not only at the molecular level but also in relation to broader clinical trajectories of inflammatory progression and outcome.
Limitations and Future Research
It should be emphasized that this study remains correlational in nature and cannot yet establish a direct causal relationship between CTSS or NRG1 and sepsis outcomes. Several limitations should therefore be acknowledged. First, the discovery RNA-sequencing cohort was relatively small (29 sepsis and 11 SIRS cases), which may have limited statistical power for transcriptomic discovery and increased the risk that some observed signals were influenced by sample-specific variation. Although we attempted to improve robustness through qPCR validation, survival analysis, and multi-cohort external validation, these complementary analyses cannot fully replace validation in larger prospective cohorts. Second, both SIRS and sepsis are clinically heterogeneous conditions, and the patients included in the discovery cohort may differ in infection source, inflammatory burden, organ dysfunction severity, treatment exposure, and underlying comorbidities. Such heterogeneity may have introduced biological and clinical variability that could not be fully resolved in the current analysis. Third, because the study was based on a limited number of samples and available public datasets, the possibility of sampling bias cannot be excluded. Importantly, direct in vivo manipulation of these genes has not yet been performed in the present study, and their causal influence on sepsis outcomes therefore remains to be established. Therefore, the present findings should be interpreted as a biomarker discovery-and-validation framework rather than definitive evidence of protective function.
Future research should proceed in several directions. First, the biomarker significance of peripheral blood CTSS and NRG1 in SIRS–sepsis risk stratification and outcome prediction should be further assessed in larger, well-phenotyped prospective cohorts, ideally together with established clinical indicators such as PCT, CRP, lactate, and severity scores. Second, because the present study did not include direct in vivo perturbation of CTSS or NRG1, further functional studies using monocyte/macrophage systems and sepsis animal models—through overexpression or knockdown of these genes—will be necessary to determine whether they causally influence immune cell polarization, endothelial barrier integrity, organ injury, and ultimately sepsis outcomes. Third, based on the potential herbal compounds identified in this study, systematic evaluation of the bidirectional effects of enhancing or inhibiting CTSS/NRG1 signaling on sepsis outcomes will be important for determining whether these genes are better understood as therapeutic targets or as readouts of protective immune responses.
Conclusion
Using multi-omics datasets derived from individuals diagnosed with SIRS or sepsis, we integrated differential expression profiling, WGCNA, machine-learning–based screening, survival and meta-analytic validation, single-cell transcriptomics, and SCENIC regulatory network inference to identify CTSS and NRG1 as candidate protective genes potentially associated with inflammatory stage transition and prognosis. The results showed that both genes were highly expressed during the SIRS stage but significantly downregulated in the sepsis stage, with predominant expression signals observed in monocyte/macrophage populations, and with SCENIC analysis suggesting associations with the SPI1–ETS2–STAT2 and ZMIZ1 regulatory contexts, respectively. Combined with ITCM database analysis, we further identified multiple herbal monomers potentially capable of modulating the expression of these two genes, suggesting possible drug-targeting relevance. By characterizing key molecular changes during the SIRS–sepsis transition, this work provides a basis for further investigation into potential therapeutic targets and protective regulatory mechanisms.
Data Sharing Statement
The original data have been deposited in the China National GeneBank Database (CNGBdb) under accession number CNP0002611 and are publicly available through the CNGBdb portal. Raw supporting data related to this study are available from the last corresponding author, Feng Yang, upon reasonable request.
Ethics Approval and Informed Consent
This clinical trial was registered on April 2, 2019, at the Chinese Clinical Trial Registry (Registration No. ChiCTR1900021261). Prior to the commencement of the study, informed consent was obtained from all participants, and written consent forms were signed.
The study protocol was approved by the Ethics Committee of the Affiliated Hospital of Southwest Medical University (Ethics Approval No. ky2018029) and was conducted in accordance with the principles of the Declaration of Helsinki.
Funding
This work was supported by the Key Research and Development Project of the Sichuan Provincial Department of Science and Technology (Grant No. 22ZDYF2048), and the Doctoral Research Initiation Fund of the Affiliated Hospital of Southwest Medical University (Grant No. 23173).
Disclosure
The authors report no conflicts of interest in this work.
References
1. Rudd KE, Johnson SC, Agesa KM, et al. Global, regional, and national sepsis incidence and mortality, 1990–2017: analysis for the Global Burden of Disease Study. Lancet. 2020;395(10219):200–23. doi:10.1016/S0140-6736(19)32989-7
2. Aagaard K, Hohmann E. Regulating microbiome manipulation. Nat Med. 2019;25(6):874–876. doi:10.1038/s41591-019-0451-1
3. Michard F, Richards G, Biais M, Lopes M, Auler JO. Using pulse pressure variation or stroke volume variation to diagnose right ventricular failure? Crit Care. 2010;14(6):451. doi:10.1186/cc9303
4. Anesi GL, Andrews A, Bai HJ, et al; Severe Acute Respiratory Infection-Preparedness (SARI-PREP) Study Group. Perceived hospital stress, severe acute respiratory syndrome coronavirus 2 activity, and care process temporal variance during the COVID-19 pandemic. Crit Care Med. 2023;51(4):445–459. doi:10.1097/CCM.0000000000005802.
5. Póvoa P, Coelho L, Dal-Pizzol F, et al. How to use biomarkers of infection or sepsis at the bedside: guide to clinicians. Intensive Care Med. 2023;49(2):142–153. doi:10.1007/s00134-022-06956-y
6. Langfelder P, Horvath S. WGCNA: an R package for weighted correlation network analysis. BMC Bioinf. 2008;9:559. doi:10.1186/1471-2105-9-559
7. Tada T, Zhou H, Dcosta BM, et al. Increased resistance of SARS-CoV-2 Omicron variant to neutralization by vaccine-elicited and therapeutic antibodies. EBioMedicine. 2022;78:103944. doi:10.1016/j.ebiom.2022.103944
8. Wang Q, Wang C, Zhang W, et al. Identification of biomarkers related to sepsis diagnosis based on bioinformatics and machine learning and experimental verification. Front Immunol. 2023;14:1087691. doi:10.3389/fimmu.2023.1087691
9. Cutrin JC, Alves-Filho JC, Ryffel B. Editorial: sepsis: studying the immune system to highlight biomarkers for diagnosis, prognosis and personalized treatments. Front Immunol. 2023;14:1325020. doi:10.3389/fimmu.2023.1325020
10. Reyes M, Filbin MR, Bhattacharyya RP, et al. An immune-cell signature of bacterial sepsis. Nat Med. 2020;26(3):333–340. doi:10.1038/s41591-020-0752-4
11. Aibar S, González-Blas CB, Moerman T, et al. SCENIC: single-cell regulatory network inference and clustering. Nat Methods. 2017;14(11):1083–1086. doi:10.1038/nmeth.4463
12. Chen Y, Wu YY, Si HB, Lu YR, Shen B. Mechanistic insights into AMPK-SIRT3 positive feedback loop-mediated chondrocyte mitochondrial quality control in osteoarthritis pathogenesis. Pharmacol Res. 2021;166:105497. doi:10.1016/j.phrs.2021.105497
13. Ding N, Wei B, Fu X, Wang C, Wu Y. Natural products that target the NLRP3 inflammasome to treat fibrosis. Front Pharmacol. 2020;11:591393. doi:10.3389/fphar.2020.591393
14. Fu CF, Li JL, Chen JW, et al. Mechanism and therapeutic potential of traditional Chinese medicine extracts in sepsis. Front Pharmacol. 2024;15:1365639. doi:10.3389/fphar.2024.1365639
15. Tian S, Zhang J, Yuan S, et al. Exploring pharmacological active ingredients of traditional Chinese medicine by pharmacotranscriptomic map in ITCM. Brief Bioinform. 2023;24(2):bbad027. doi:10.1093/bib/bbad027
16. Singer M, Deutschman CS, Seymour CW, et al. The Third International Consensus Definitions for Sepsis and Septic Shock (Sepsis-3). JAMA. 2016;315(8):801–810. doi:10.1001/jama.2016.0287
17. Yin D, Guo Q, Jiang H, et al. Single-cell sequencing-based study of ferroptosis mechanisms in heat stroke: identification of key biomarkers and dynamic analysis of the immune microenvironment. BMC Med Genomics. 2025;18(1):124. doi:10.1186/s12920-025-02188-3
18. Yu G, Wang LG, Han Y, He QY. clusterProfiler: an R package for comparing biological themes among gene clusters. OMICS. 2012;16(5):284–287. doi:10.1089/omi.2011.0118
19. Kanehisa M, Sato Y, Kawashima M, Furumichi M, Tanabe M. KEGG as a reference resource for gene and protein annotation. Nucleic Acids Res. 2016;44(D1):D457–D462. doi:10.1093/nar/gkv1070
20. Kanehisa M, Goto S. KEGG: kyoto encyclopedia of genes and genomes. Nucleic Acids Res. 2000;28(1):27–30. doi:10.1093/nar/28.1.27
21. Friedman J, Hastie T, Tibshirani R. Regularization paths for generalized linear models via coordinate descent. J Stat Softw. 2010;33(1):1–22.
22. Xia D, Wang J, Yang S, Jiang C, Yao J. Identification of key genes and their correlation with immune infiltration in osteoarthritis using integrative bioinformatics approaches and machine-learning strategies. Medicine. 2023;102(46):e35355. doi:10.1097/MD.0000000000035355
23. Li X, Chen Z, Yao Y, Chen M, Hu Y. Single-cell multi-omics deciphers core gene networks and immune interaction collapse in sepsis-associated T cell dysfunction. Infect Drug Resist. 2025;18:4863–4885. doi:10.2147/IDR.S538883
24. Shen Y, Leng L, Hu Y. Exploring core genes associated with sepsis and systemic inflammatory response syndrome using single-cell sequencing technology. J Inflamm Res. 2025;18:1815–1838. doi:10.2147/JIR.S448900
25. 10x Genomics. What is Cell Ranger? Available from: https://www.10xgenomics.com/single-cell-gene-expression/software/pipelines/latest/what-is-cellranger.
26. Dobin A, Davis CA, Schlesinger F, et al. STAR: ultrafast universal RNA-seq aligner. Bioinformatics. 2013;29(1):15–21. doi:10.1093/bioinformatics/bts635
27. Deng G, Wang P, Su R, et al. SPI1+CD68+ macrophages as a biomarker for gastric cancer metastasis: a rationale for combined antiangiogenic and immunotherapy strategies. J Immunother Cancer. 2024;12(10):e009983. doi:10.1136/jitc-2024-009983
28. Gao H, Zhang Z, Deng J, Song Y. Cathepsin S: molecular mechanisms in inflammatory and immunological processes. Front Immunol. 2025;16:1600206. doi:10.3389/fimmu.2025.1600206
29. Smyth P, Sasiwachirangkul J, Williams R, Scott CJ. Cathepsin S (CTSS) activity in health and disease—a treasure trove of untapped clinical potential. Mol Aspects Med. 2022;88:101106. doi:10.1016/j.mam.2022.101106
30. de Mingo Á, de Gregorio E, Moles A, et al. Cysteine cathepsins control hepatic NF-κB-dependent inflammation via sirtuin-1 regulation. Cell Death Dis. 2016;7(11):e2464. doi:10.1038/cddis.2016.368
31. Huang CC, Lee CC, Lin HH, Chang JY. Cathepsin S attenuates endosomal EGFR signalling: a mechanical rationale for the combination of cathepsin S and EGFR tyrosine kinase inhibitors. Sci Rep. 2016;6:29256. doi:10.1038/srep29256
32. Luo XT, Hu HR, Sun ZD, Zhang LH, Li Y. Multi-omics analysis reveals that low cathepsin S expression aggravates sepsis progression and worse prognosis via inducing monocyte polarization. Front Cell Infect Microbiol. 2025;15:1531125. doi:10.3389/fcimb.2025.1531125
33. Zhao K, Sun Y, Zhong S, Luo JL. The multifaceted roles of cathepsins in immune and inflammatory responses: implications for cancer therapy, autoimmune diseases, and infectious diseases. Biomark Res. 2024;12(1):165. doi:10.1186/s40364-024-00711-9
34. Wang Y, Baron RM, Zhu G, et al. PU.1 regulates cathepsin S expression in professional APCs. J Immunol. 2006;176(1):275–283. doi:10.4049/jimmunol.176.1.275
35. Zhang XY, Zhuo X, Cheng J, Wang X, Liang K, Chen X. PU.1 regulates cathepsin S expression in large yellow croaker (Larimichthys crocea) macrophages. Front Immunol. 2022;12:819029. doi:10.3389/fimmu.2021.819029
36. Kang W, Cheng Y, Wang X, et al. Neuregulin-1: an underlying protective force of cardiac dysfunction in sepsis (review). Mol Med Rep. 2020;21(6):2311–2320. doi:10.3892/mmr.2020.11034
37. Wang F, Wang H, Liu X, et al. Neuregulin-1 alleviate oxidative stress and mitigate inflammation by suppressing NOX4 and NLRP3/caspase-1 in myocardial ischaemia-reperfusion injury. J Cell Mol Med. 2021;25(3):1783–1795. doi:10.1111/jcmm.16287
38. Galindo CL, Ryzhov S, Sawyer DB. Neuregulin as a heart failure therapy and mediator of reverse remodeling. Curr Heart Fail Rep. 2014;11(1):40–49. doi:10.1007/s11897-013-0176-2
39. Liu J, Liu H, Geng H, Fan Y, Liu M. Reduced plasma levels of neuregulin-1 are associated with adverse outcomes in patients with atherosclerotic cardiovascular disease. Front Cardiovasc Med. 2025;12:1600480. doi:10.3389/fcvm.2025.1600480
40. De Keulenaer GW, Feyen E, Dugaucquier L, et al. Mechanisms of the multitasking endothelial protein NRG-1 as a compensatory factor during chronic heart failure. Circ Heart Fail. 2019;12(10):e006288. doi:10.1161/CIRCHEARTFAILURE.119.006288
41. Alizadeh A, Santhosh KT, Kataria H, Gounni AS, Karimi-Abdolrezaee S. Neuregulin-1 elicits a regulatory immune response following traumatic spinal cord injury. J Neuroinflamm. 2018;15(1):53. doi:10.1186/s12974-018-1093-9
42. Berrocal-Rubio MA, Pawer YDJ, Dinevska M, et al. Discovery of NRG1-VII: the myeloid-derived class of NRG1. BMC Genomics. 2024;25(1):814. doi:10.1186/s12864-024-10723-2
43. Finigan JH, Mishra R, Vasu VT, et al. Bronchoalveolar lavage neuregulin-1 is elevated in acute lung injury and correlates with inflammation. Eur Respir J. 2013;41(2):396–401. doi:10.1183/09031936.00004912
44. Zhou J, Wu K, Ma Y, et al. GTS-21 alleviates sepsis-induced atrial fibrillation susceptibility by modulating macrophage polarization and neuregulin-1 secretion. Int Immunopharmacol. 2025;154:114561. doi:10.1016/j.intimp.2025.114561
45. Qiu D, Xu S, Ji K, Tang C. Myeloid cell-derived IL-1 signaling damps neuregulin-1 from fibroblasts to suppress colitis-induced early repair of the intestinal epithelium. Int J Mol Sci. 2024;25(8):4469. doi:10.3390/ijms25084469
46. Baykara N. PREGCOVID-ICU study group. Clinical characteristics, outcomes, and risk factors for mortality in pregnant/puerperal women with COVID-19 admitted to ICU in Turkey: a multicenter, retrospective study from a middle-income country. J Intensive Care Med. 2024;39(6):577–594. doi:10.1177/08850666231222838
 © 2026 The Author(s). This work is published and licensed by Dove Medical Press Limited. The
full terms of this license are available at https://www.dovepress.com/terms
and incorporate the Creative Commons Attribution
- Non Commercial (unported, 4.0) License.
By accessing the work you hereby accept the Terms. Non-commercial uses of the work are permitted
without any further permission from Dove Medical Press Limited, provided the work is properly
attributed. For permission for commercial use of this work, please see paragraphs 4.2 and 5 of our Terms.
© 2026 The Author(s). This work is published and licensed by Dove Medical Press Limited. The
full terms of this license are available at https://www.dovepress.com/terms
and incorporate the Creative Commons Attribution
- Non Commercial (unported, 4.0) License.
By accessing the work you hereby accept the Terms. Non-commercial uses of the work are permitted
without any further permission from Dove Medical Press Limited, provided the work is properly
attributed. For permission for commercial use of this work, please see paragraphs 4.2 and 5 of our Terms.