")
Back to Journals » International Journal of Nanomedicine » Volume 15
Prospects for the Use of Upconverting Nanoparticles as a Contrast Agent for Enumeration of Circulating Cells in vivo
Authors Bartosik PB, Fitzgerald JE, El Khatib M , Yaseen MA, Vinogradov SA , Niedre M
Received 20 December 2019
Accepted for publication 20 February 2020
Published 11 March 2020 Volume 2020:15 Pages 1709—1719
DOI https://doi.org/10.2147/IJN.S243157
Checked for plagiarism Yes
Review by Single anonymous peer review
Peer reviewer comments 4
Editor who approved publication: Dr Thomas Webster
Peter B Bartosik,1 Jessica E Fitzgerald,1 Mirna El Khatib,2 Mohammad A Yaseen,3 Sergei A Vinogradov,2 Mark Niedre1
1Department of Bioengineering, Northeastern University, Boston, MA, USA; 2Department of Biochemistry and Biophysics, Perelman School of Medicine and Department of Chemistry, School of Arts and Sciences, University of Pennsylvania, Philadelphia, PA, USA; 3Athinoula A. Martinos Center for Biomedical Imaging, Department of Radiology, Massachusetts General Hospital, Charlestown, MA, USA
Correspondence: Mark Niedre Email [email protected]
Purpose: We recently developed a new fluorescence-based technique called “diffuse in vivo flow cytometry” (DiFC) for enumerating rare circulating tumor cells (CTCs) directly in the bloodstream. Non-specific tissue autofluorescence is a persistent problem, as it creates a background which may obscure signals from weakly-labeled CTCs. Here we investigated the use of upconverting nanoparticles (UCNPs) as a contrast agent for DiFC, which in principle could significantly reduce the autofluorescence background and allow more sensitive detection of rare CTCs.
Methods: We built a new UCNP-compatible DiFC instrument (U-DiFC), which uses a 980 nm laser and detects upconverted luminescence in the 520, 545 and 660 nm emission bands. We used NaYF4:Yb,Er UCNPs and several covalent and non-covalent surface modification strategies to improve their biocompatibility and cell uptake. We tested U-DiFC with multiple myeloma (MM) and Lewis lung carcinoma (LLC) cells in tissue-mimicking optical flow phantoms and in nude mice.
Results: U-DiFC significantly reduced the background autofluorescence signals and motion artifacts from breathing in mice. Upconverted luminescence from NaYF4:Yb,Er microparticles (UμNP) and cells co-incubated with UCNPs were readily detectable with U-DiFC in phantoms, and from UCNPs in circulation in mice. However, we were unable to achieve reliable labeling of CTCs with UCNPs. Our data suggest that most (or all) of the measured U-DIFC signal in vitro and in vivo likely arose from unbound UCNPs or due to the uptake by non-CTC blood cells.
Conclusion: UCNPs have a number of properties that make them attractive contrast agents for high-sensitivity detection of CTCs in the bloodstream with U-DiFC and other intravital imaging methods. More work is needed to achieve reliable and specific labeling of CTCs with UCNPs and verify long-term retention and viability of cells.
Keywords: in vivo flow cytometry, upconverting nanoparticles, phosphorescence
Introduction
Hematogenous metastasis is a multi-step process, wherein circulating tumor cells (CTCs) invade from the primary tumor into the bloodstream, travel to distant organs or tissues and form secondary metastases1 (Figure 1A). It is these secondary tumors that are extremely difficult to control and are often the ultimate cause of death in patients.2 CTCs are, therefore, of great interest in cancer research, both clinically and in pre-clinical animal models.3–5 CTCs are normally studied using “liquid biopsy” assays, wherein blood is drawn from the patient (or animal as in the case of pre-clinical research), and CTCs are subsequently isolated and characterized.6,7
More recently, a number of investigators have developed optical “in vivo flow cytometry” (IVFC) methods to study circulating cells in mice without drawing blood samples, allowing continuous non-invasive measurement of CTC numbers.8,9 Although several IVFC approaches use intrinsic cell contrast (including photoacoustic10,11 and reflectance-scatter12,13 contrast), most use exogenous fluorophores or fluorescent proteins to label and detect cell populations of interest.14–18
Our group has worked extensively on a technique called “diffuse in vivo flow cytometry” (DiFC),19–23 which uses diffuse light to sample large circulating blood volumes in major deep-seated blood vessels. The main advantage of DiFC is that it samples hundreds of μL of peripheral blood per minute, permitting detection of very rare cell types such as CTCs, where numbers are as low as 1 CTC per mL of blood.20
Because DiFC relies on induction of fluorescence from moving cells in bulk tissue with diffuse light, a persistent challenge is the presence of relatively large, non-specific autofluorescence background. This background can obscure the signal from weakly labeled cells. In addition, motion artifacts may appear even in anesthetized animals, which can yield false positive signals. To overcome these difficulties, we have previously developed specialized signal processing,20 multi-spectral24 and imaging22,25 approaches for DiFC.
In this work, we investigated the use of lanthanide-based upconverting nanoparticles (UCNPs) as contrast agents for circulating cells for IVFC. UCNPs have a number of attractive characteristics for DiFC in principle. First, unlike organic fluorophores or fluorescent proteins,26 the luminescence of UCNPs is induced upon multiphoton excitation by continuous wave (CW) near infrared (NIR) light,27 thus eliminating any autofluorescence and motion artifact interference. Second, use of NIR (eg 980 nm) excitation should enable deeper light penetration into the tissue.28 In recent years, UCNPs have been proposed for a wide array of in vitro and in vivo biological research applications29–33 and purported to exhibit little or no toxicity,34,35 although toxicity has been observed in some cases.36,37 Several authors have reported functionalization, specific cellular targeting and retention of UCNPs.38–44 In the context of DiFC, this suggests that UCNPs could be a useful contrast agent for circulating cells. For example, by conjugation with cancer-specific cell surface receptors,45 UCNPs could be directed against CTCs in vivo in pre-clinical mouse models or (if safe and efficacious) potentially even in humans. More broadly, other types of cells, sensors or cell-based therapeutics could be pre-labeled with UCNPs prior to introduction (injection) into the bloodstream.
In the present study we first designed and built a new DiFC instrument to detect up-converted emission from CTCs. We refer to this instrument as U-DiFC. We tested U-DIFC with upconverting microparticles (UCμPs), then with CTCs co-incubated with UCNPs in a tissue-mimicking flow phantom and lastly in mice in vivo. As we show, upconverted luminescence was readily detectable with U-DiFC in these systems with average detection signal-to-noise ratios (SNRs) of approximately 30 dB and often exceeding 50 dB. However, despite attempting multiple cell labeling approaches, we were unable to achieve specific internalization of UCNPs by CTCs in our hands. Rather, our data suggest that most (or all) of the measured U-DiFC signal in vitro and in vivo likely arose from unbound or self-aggregated UCNPs in circulation or due to the scavenging of UCNPs by non-CTCs blood cells. More work is needed to achieve reliable labeling of CTCs with UCNPs in combination with long-term retention and viability of cells.
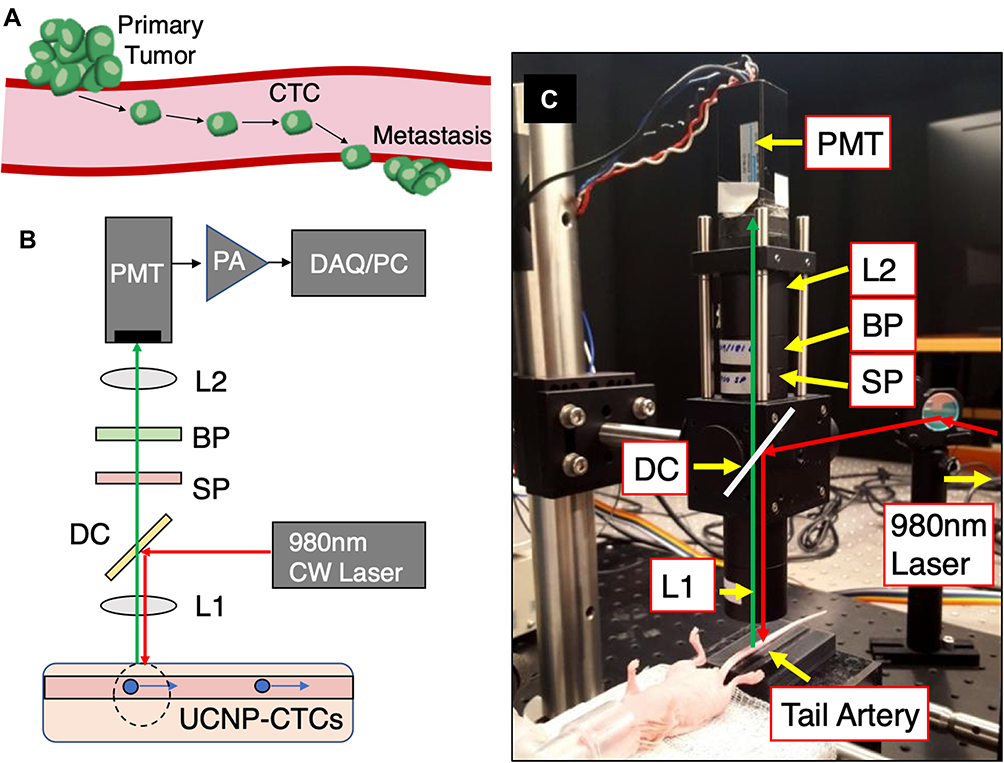 |
Figure 1 (A) CTCs in the peripheral blood are crucial in hematogenous metastasis. We developed U-DiFC to detect UCNP-labeled tumor cells in circulation. The U-DiFC instrument (B) schematic, and (C) photograph are shown. |
Materials and Methods
U-DiFC Instrument
A schematic and photograph of the U-DiFC instrument are shown in Figure 1B and C. The optical design is based on a standard epi–illumination and fluorescence detection geometry (Figure 1B). We used a 980 nm laser (DL980-200, CrystaLaser LLC, Reno, NV) to illuminate a spot on the sample (2 mm in diameter) using a lens (L1; 25 mm focal length; Edmund Optics, Barrington, NJ). The upconverted luminescence (see below) was collected via the same lens, passed through a dichroic (DC; ZT775, Chroma Technology Corporation, Bellows Falls, VT), then through a 900 nm short-pass filter (SP, XIS0900, Asahi Spectra Co. Ltd., Torrence, CA), and a bandpass filter (519–800 nm; FF01-609/181, Semrock LLC, Rochester, NY). The second lens (L2, 50 mm focal length) focused the light onto a photomultiplier (PMT; H6780-20, Hamamatsu Photonics, Bridgewater, NJ), whose output was amplified using a pre-amplifier (SR570. Stanford Research Systems, Sunnyvale, CA) and digitized with a multi-function data acquisition board (DAQ; USB-6212, National Instruments, Austin, TX), configured to collect data at 1000 samples per second. During operation, the sample, either a tissue-mimicking flow phantom or the ventral caudal artery in the tail of a mouse (Figure 1C), was placed on an adjustable translation stage 15 mm beneath the first lens (L1), given a working collection numerical aperture of 0.26. The power at the sample was 50 mW.
U-DiFC data were processed using a code that was custom written in Matlab (The Mathworks, Natick, MA). The analysis was similar to our previously reported workflow for single-channel DiFC.46 First, simple background subtraction was performed using a 2.5 s median filter, and then a 5-point (5 ms) smoothing sliding window was applied to the data. This operation removes any residual background light as well as any luminescence signal from free (unbound but un-aggregated) UNCPs in solution or in circulation. A 60 Hz notch filter was also applied to remove residual AC noise due to the laser power supply. Second, a peak detection routine (“findpeaks”) was used to identify peaks which exceeded a sliding threshold, which was set to 6 times the standard deviation of the background electronic noise (σN). This allowed us to determine the amplitude and signal-to-noise ratio (SNR) of detected peaks from UCNPs, which was defined as SNR = 20 log10 (Ipeak/σN). As discussed below. the “peak detection” approach identifies the luminescence signals from spatially localized aggregates (groupings) of UCNPs, but cannot distinguish between labeled cells and extracellular UCNP aggregates.
Cell Lines
We used MM.1S, LLC and HeLa cultured cells. MM.1S are multiple myeloma (MM) cells purchased from ATCC (CRL-2974, Manassas, VA). MM.1S cells were previously genetically modified to carry the green fluorescent protein GFP (MM. 1S.GFP.Luc cells).21 MM cells were cultured in RPMI-1640 media. Second, we used Lewis lung carcinoma (LLC; LL/2.GFP.Luc) cells that also expressed GFP. These cells were purchased from Imanis Life Sciences (Rochester, MN). HeLa cells were originally purchased from ATCC (CRL-2). LLC cells and HeLa cells were cultured in Dulbecco’s modified Eagle’s media (DMEM) for 48 h at 37°C.
Upconverting Microparticles, Nanoparticles and Cell Labeling
All upconverting micro- and nano-particles used in this study were NaYF4-based nanocrystals, doped with Yb3+ and Er3+. We performed preliminary testing and validation of U-DiFC with relatively large, approximately cell-sized (10–50 μm diameter) NaYF4:Yb,Er upconverting microparticles (Sunstone Inc., Princeton, NJ). UCμPs were dispersed in phosphate buffered saline to form a suspension containing approximately 103 particles per mL. The suspension was tested in a tissue-mimicking flow phantom as discussed in Section 2.5 below.
Labeling of cells in culture with UCNPs has been reported by a number of groups previously.41–43 In this work, we tried several protocols involving covalent and non-covalent surface modification of UCNPs as described in detail below.
Cell Labeling with Covalently Modified UCNPs
We tested commercially sourced UCNPs coated with a SiO2 layer and having covalently attached amino groups (NH2) (UCNP-SiO2-NH2; 30–35 nm diameter, ACS Material LLC, Pasedena, CA) as shown in Figure 2A. Use of silica (SiO2) coating makes the UCNP hydrophilic and therefore less likely to aggregate in solution or in blood. Functionalization with -NH2 groups is intended to give the nanoparticles a slight positive surface charge, thereby facilitating their interactions with cellular membranes and increasing the probability of their internalization (note that surface coating and functionalization were performed by the manufacturer). We imaged SiO2-NH2-modified UCNPs using a JEM 1010 transmission electron microscope (TEM; JEOL Ltd., Tokyo, JP), operated at 80 kV. An example TEM image is shown in Figure 2B. As shown in Figure 2C, we also used a CCD-based spectrometer (CCS200, Thorlabs Inc., Newton, NJ) to verify that the SiO2-NH2-modified UCNPs emitted light in three spectral ranges centered at 520 nm, 545 nm and 660 nm when excited at 980 nm.
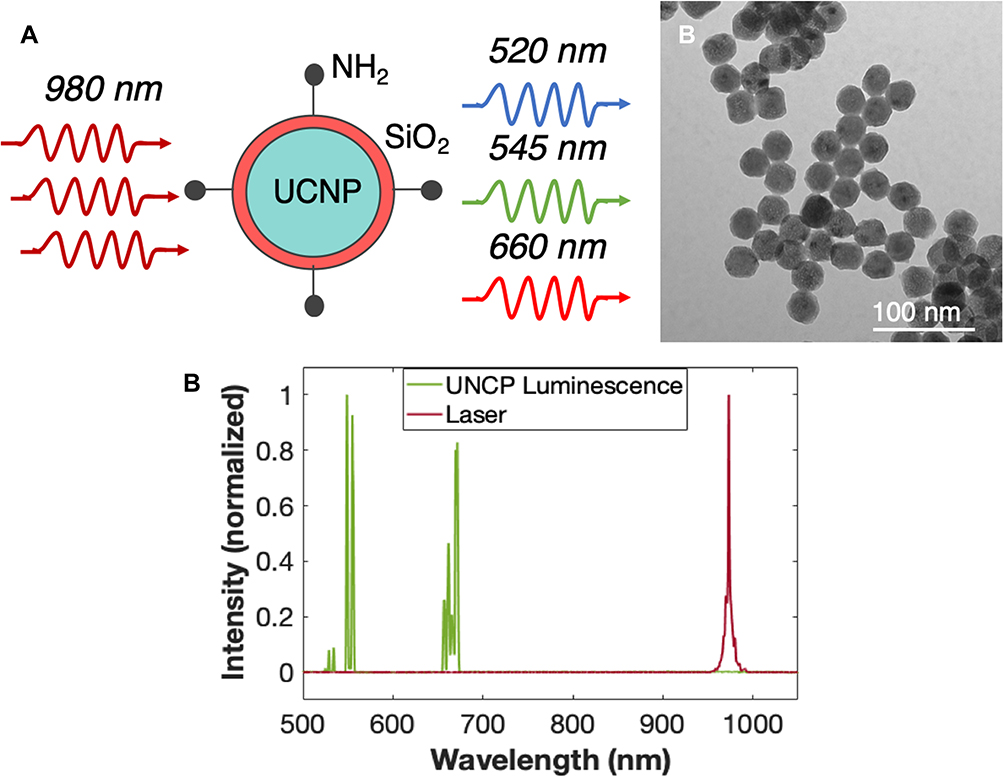 |
Figure 2 (A) SiO2-NH2-modified UCNPs (30 nm in diameter) used for the in vitro and in vivo U-DiFC studies in this paper. UCNPs emit visible (green and red) light when illuminated at 980 nm. (B) TEM image of UCNPs verifying their size. (C) Emission (green) spectra of the UCNPs and the spectrum of the laser (red) used in this study. |
As discussed in more detail below, we attempted several previously reported protocols for labeling cells with UCNP-SiO2-NH2.38–40 The most promising was a simple co-incubation method (subsequently referred to as “method 1”).40 5x10⁵ pelleted cells (LLC or MM) were co-incubated with 50, 100 or 500 μg/mL UCNP-SiO2-NH2 for 1 hr in a 1.5 mL microcentrifuge tube. The cells were washed three times with PBS (without serum) in an attempt to remove excess UCNPs. Prior to experiments, cells were re-pelleted by centrifugation and then suspended in PBS (without serum) at their desired concentration as below. This method was used for the U-DiFC in vitro and in vivo experiments presented in this paper.
Cell Labeling with Non-Covalently Modified UCNPs
We also tested several previously reported protocols for UCNPs (25–30 nm in diameter; Sunstone Inc, Princeton, NJ) modified by NOBF4 and made hydrophilic by non-covalent surface modification with polymers. We used a well-established ligand exchange reaction47 and several organic polymers, including commercially available polyamidoamine (PAMAM) dendrimers (Gen 5, ethylenediamine core)48 and polyethyleneamine (PEI),49 following the respective published protocols. Aqueous solutions of the polymer-coated UCNPs initially appeared aggregate-free and exhibited minimal scattering, indicating satisfactory colloidal stability in distilled water (dH2O) and in HEPES buffer (10 mM).
PAMAM- or PEI- coated nanocrystals in HEPES (50, 100 or 500 μg/mL, 100 μL) were added to HeLa cells in a cell-growth medium (DMEM, supplemented with Leibovitz’s (1X) L-15 medium [+] L-Glutamine (Gibco), 10% fetal bovine serum (FBS) and 1% penicillin−streptomycin at 37 °C and 5% CO2) in small Petri dishes. The cells were incubated at 37°C for 1h or 24h (subsequently referred to as “method 2”). Cells were imaged using a standard inverted fluorescent microscope (Leica DMI6000B), equipped with a CW laser diode (980 nm) for excitation and an appropriate dichroic cube for imaging up-converted emission.
Microscopy
To investigate cellular uptake of the covalently modified UCNPs (UCNP-SiO2-NH2), MM.1S and LLC cells were incubated using ‘method 1ʹ described above and imaged using a custom-designed multimodal microscope.50 UCNPs exhibit luminescence that persists for several microseconds after excitation. The long emission decay times of UCNPs require special image processing protocols in order to enable high-resolution microscopy using UCNPs on non-de-scanned imaging systems.33,51 To overcome this limitation, we used a custom-designed canning protocol configured for two-photon phosphorescence lifetime imaging,52 in which the excitation light can be temporally gated at each pixel, and images are constructed from counting emitted photons both during and after laser excitation at every pixel. Each sample was imaged for both GFP fluorescence and UCNP luminescence. Since both cell lines expressed GFP, this allowed assessment of co-localization of the signals. A tunable Titanium:Sapphire laser (Insight DeepSea, Spectra Physics, Santa Clara, CA) was used to excite the UCNPs at 980 nm and GFP at 880 nm, with a delay of ~30–60 seconds between each scan for wavelength adjustment. Emission was collected using a 20X objective (Olympus XLumPlan Fluor, 20×, 1.00 NA, 2 mm working distance) and directed by a dichroic mirror into a custom detector array. GFP fluorescence was detected using a multi-alkali PMT (R3986, Hamamatsu) with a λ = 525 ± 25 nm emission filter (Chroma). UCNP luminescence was detected using a GaASP PMT (H10770PB-40, Hamamatsu) using a 675 ± 25 nm emission filter (Semrock). The PMT was connected to a discriminator circuit to detect individual photons.
Optical Flow Phantom Experiments in vitro
As an initial test of the U-DiFC system we used an optical flow phantom model similar to our previous work.20 The phantom (Figure 3) material had optical properties that mimic the optical scattering and absorption of biological tissue. Specifically, the phantom was a block of optically diffuse high-density polyethylene. A strand of Tygon tubing (250 μm ID, TGY-010-C, Small Parts, Inc., Seattle, Washington) was embedded at a depth of 0.5 mm and connected to a syringe pump (70–2209, Harvard Apparatus, Holliston, Massachusetts). UCμPs or cells co-incubated with UCNPs were pumped through the tubing at a linear flow speed of 10 mm/s.
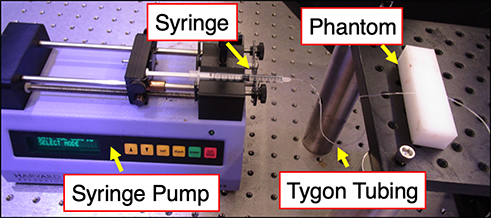 |
Figure 3 Optical flow phantom model used for testing and validation of the U-DiFC system. |
U-DiFC Experiments in Mice in vivo
All mice were handled in accordance with Northeastern University’s Institutional Animal Care and Use Committee (IACUC) policies on animal care under protocol #15-0728R. Experiments were performed with approval from and in accordance with relevant guidelines and regulations of Northeastern University IACUC. We used 8-week old athymic nude (nu/nu) female mice. Suspensions of 2.5 × 10⁵ MM.1S cells co-incubated with UCNPs (using ‘method 1ʹ described above) and suspended in 200 μL PBS were injected i.v. via the tail vein. Mice tails were positioned under the U-DiFC collection lens, so that the focal point of the system was approximately over the caudal artery on the ventral side of the mouse tail. Mice were held under inhaled isofluorane during U-DiFC scanning to prevent movement and were kept warm using two heating pads placed under the body and over the exposed area of the tail. U-DiFC was performed for 30 mins, beginning 10 mins after injection of the cells.
Results
U-DiFC Measurements in Optical Flow Phantoms in vitro
We first tested basic operation and proof-of-concept of U-DiFC using the optical flow phantom model as summarized in Figure 4. We performed U-DiFC on control (un-labeled) MM cells suspended in PBS, which were run through the flow phantom. A representative 60 s interval of processed data collected with U-DiFC is shown in Figure 4A. As shown, the background signal was extremely stable, with measurement (electronic) noise of σN= 112 nA, over the course of 4, 10 min U-DiFC scans.
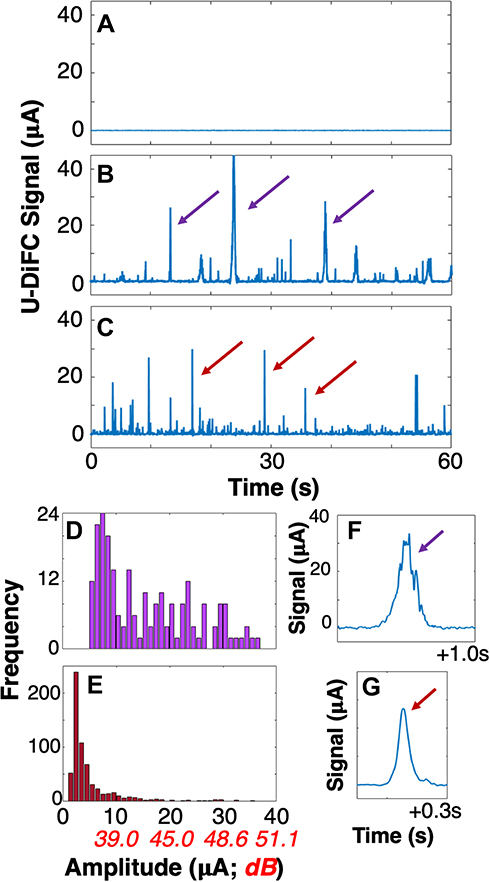 |
Figure 4 Verifying operation of the U-DiFC system. (A) Representative U-DiFC data measured from suspensions of un-labeled (control) MM cells, illustrating the negligible background signal. U-DiFC data measured from suspensions of (B) UCμPs, (C) and LLC cells co-incubated with UCNPs (UCNP-LLCs). Arrows in each panel indicate example detected peaks by U-DiFC. (D, E) Peak amplitude histograms for UCμPs and UCNP-LLCs, showing that they were readily detectable with U-DiFC. (F, G) Example temporal profiles of peaks measured with U-DiFC for UCμPs and UCNP-LLCs. Note that the temporal profile for UCμPs frequently had a jagged appearance, whereas they were smooth for UCNP-LLCs (arrows in (F, G)). |
We next ran UCμP’s suspended in PBS (without any cells), as described above, through the phantom at a linear flow speed of 10 mm/s. A representative 60 s U-DiFC trace is shown in Figure 4B. Here each transient “peak” (purple arrows) corresponds to laser-induced luminescence generated and detected as individual UCμPs passed through the U-DiFC field-of-view. Likewise, Figure 4C shows U-DiFC data acquired from suspensions of LLC cells co-incubated with covalently modified UCNPs (UCNP-SiO2-NH2) using ‘method 1ʹ described above. These U-DiFC data are generally consistent with fluorescence-based CTC data that we have previously measured and reported with DiFC.46 Here, peaks (red arrows) indicate U-DiFC detection of UCNP ‘groupings’ (aggregates). However, as discussed in more detail below, it was likely that the UCNPs were weakly adherent to the cell surfaces or were extra-cellular aggregates.
There were several noteworthy features of the data measured in our flow phantom model. First, upconverted luminescence was readily detectable from both UCμPs and suspensions of cells co-incubated with UCNPs, with measured amplitudes of several μA. Histograms of peak amplitudes taken with U-DiFC for UCμPs and UCNP-LLC cell suspensions are shown in Figure 4D and E, respectively. Generally UCμPs were brighter (as would be expected from their larger size), with a median amplitude of 15.9 μA, corresponding to a signal-to-noise ratio (SNR) of 43 dB. UCNP-LLC cells suspensions generally had a lower measured brightness, with mean amplitude of 3.15 μA (29 dB), although as with the UCμPs, individual detections exceeded 50 dB.
Second for UCμPs, the detected transient luminescent peaks were generally temporally broader (on average 53 ms full-width at half maximum; FWHM) and had a jagged appearance. In contrast, for UCNP-LLCs, peaks were on average approximately half as narrow (on average 25 ms FWHM). The temporal characteristics of these peaks were generally consistent with flowing fluorescently-labeled cells measured with DiFC previously.46 Based on our previous work, this data implies the that UCμPs were traveling more slowly possibly due to surface interactions of UCμPs with the tubing walls.21 In summary, the optical flow phantom data supports the hypothesis that UCNPs can in principle be used for sensitive detection of CTCs.
Assessment of CTC Labeling by Microscopy
We next performed fluorescence microscopy of cells co-incubated with UCNPs using method 1 above, as shown in Figure 5. An example GFP fluorescence image of LLC cells is shown in Figure 5A, along with the corresponding image of UCNP luminescence (Figure 5B). As shown in Figure 5C, although there may have been a small amount of UCNP adherence to cell surfaces in some cases, in general there was very little spatial overlap between the two images. Analogous images for GFP-expressing MM cells are shown in Figure 5D–F. Again, little spatial overlap was observed. These data indicate that overall there was negligible (or no) internalization or retention of UCNPs by the cells. Despite repeated attempts to modify or optimize our labeling and washing protocols with MM and LLC cells we were unable to remedy this.
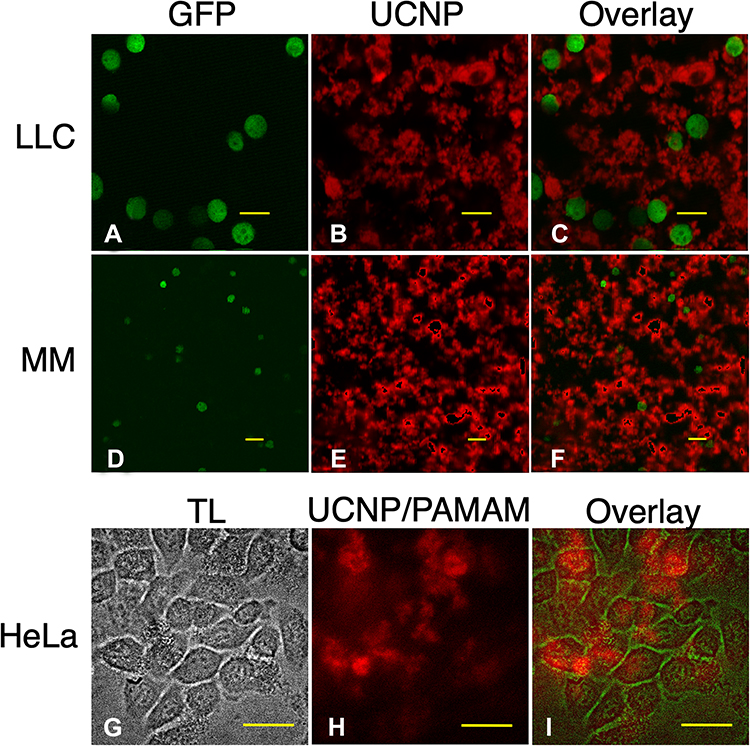 |
Figure 5 Microscopy images of (A) GFP fluorescence, (B) UCNP luminescence from suspensions of LLCs co-incubated with UCNPs using ‘method 1ʹ as described in the text, and (C) the overlay of the two signals is shown. (D) GFP fluorescence, (E) UCNP luminescence (method 1), and (F) overlay images for MM.1S cells. Scalebars are 20 μm. (G–I) UCNP co-incubation with HeLa cells with UCNP/PAMAM and ‘method 2ʹ as described in the text. Scalebars 10 μm. Overall, we observed poor co-localization of cells and UCNP signals, implying minimal or no uptake and retention. Abbreviation: TL, transmission light microscopy. |
Likewise, for attempted HeLa labeling with PAMAM- and PEI-modified UCNPs using ‘method 2ʹ described above, essentially no co-localization was observed between the images of the cells taken in transmitted light and up-converted luminescence (Figure 5G–I and Figure 5J–L, respectively). For these methods, luminescence originated from cloud-like regions in the images, not associated with cells. Further examination revealed that the non-covalently modified UCNPs rapidly aggregated upon addition to the medium, forming precipitate, which was not internalizable by the cells. Presumably, the precipitation occurred due to the detachment of the surface ligands, which were displaced by phosphate anions present in the medium. This result is consistent with our recent observations regarding these and other non-covalently-modified UCNPs.33 The implications of these results are discussed in more detail below.
U-DiFC Measurements in Mice in vivo
Despite the poor co-localization of UCNPs and cells that was observed in our microscopy data, we attempted a proof-of-concept test of U-DiFC in mice on the notion that some cells may have retained some UCNPs. When control (un-injected mice) were scanned with U-DiFC, the autofluorescence signal in the detection band of the instrument was very low, with only electronic noise (σN = 104 nA measured from 60 mins of scanning in control mice) appearing in the signal after background subtraction.
The measurement noise in mice in vivo was equal to that in flow phantoms, implying that there was no additional physiological noise. For example, the U-DiFC measurement in a mouse leg (Figure 6A) was free of problematic motion artifacts that are sometimes observed with our fluorescence DiFC system. As an example of this, Figure 6B shows mouse breathing artifacts measured from the leg of a mouse using our previously reported GFP-compatible DiFC system.21
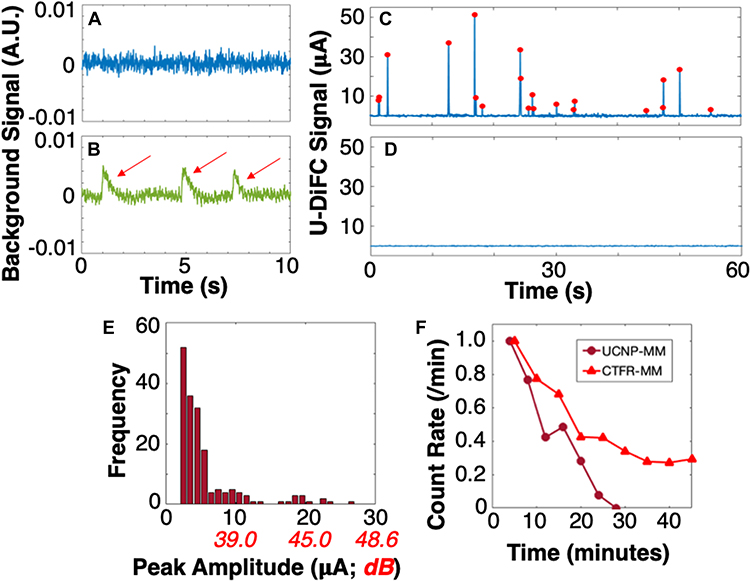 |
Figure 6 (A) U-DiFC background signal acquired from the leg of a control (un-injected mouse) showing that the signal was free of problematic (B) motion artifacts (red arrows) that are sometimes observed in our fluorescence-DiFC systems.21 Example 60 s U-DiFC trace taken from a (C) UCNP-MM injected mouse and (D) control mice. Signals from UCNPs were clearly detectable. (E) The distribution of peak amplitudes is shown. (F) UCNP-MM cells were shown to clear from circulation significantly more rapidly than previously measured. |
We also injected MM cells co-incubated with UCNPs (using ‘method 1ʹ described above) i.v. via the tail vein. An example 60 s data trace from an UCNP-MM injected mouse is shown in Figure 6C. As shown, transient peaks corresponding to detected upconverted luminescence were clearly detected, similar to the in vitro flow phantom data. These were never observed in un-injected control mice (Figure 6D), which (again) showed negligible signal after background subtraction. The histogram of detected peak amplitudes taken in mice is shown in Figure 6E. The mean peak amplitude was 4.46 μA (corresponding to SNR = 32.7 dB), but individual peaks with SNRs exceeding 50 dB were routinely detected. By comparison, in our previous DiFC work with MM cells labeled with red organic fluorophores (Cell Trace Far Red; CTFR-MM), the mean measured SNRs were on the order of only 22 dB.20 Again, the main reason for this is the very-low (negligible) autofluorescence background inherent to the UCNP measurement.
Upconverted luminescence signals from mice injected with MM-UCNPs were observed to clear from circulation completely in about 30 mins (40 mins after injection) as shown in Figure 6F. In contrast, in our previous work studying CTFR-MM cell clearance with DiFC,20,46 about 30% of MM cells stayed in circulation for up to two hours after injection. An example clearance curve measured from a previous CTFR-MM injected mouse20 is shown for comparison. Consistent with our microscopy data (Figure 5), this rapid clearance suggests that most of the detected U-DiFC signal measured in vivo originated from non-CTC internalized UCNPs. Despite repeated cycles of washing following co-incubation of UCNPs with the MM cells, it is likely that some unbound or weakly-bound UCNPs remained in the cell pellet and were introduced into circulation on injection. The implications of these data are discussed in more detail below.
Discussion and Conclusions
We recently developed a new technique, called DiFC, for non-invasively enumerating rare CTCs.20,21 Because DiFC uses laser-induced fluorescence and diffuse light, non-specific background autofluorescence is a persistent challenge. The unique properties of UCNPs – namely that their luminescence occurs at lower wavelengths than the excitation - suggests a promising cell labeling strategy for IVFC and DiFC. In combination with receptor-targeted labeling strategies,53 using UCNPs as contrast agents could, in principle, improve CTC detection sensitivity for DiFC by reducing interfering autofluorescence and motion artifacts. More broadly, UCNP-based DiFC could be used for other applications where circulation kinetics of cells, cell-based sensors, and cell based therapeutics are of interest. To our knowledge, this is the first proof-of-concept study exploring this approach.
Overall, our data show that upconverted luminescence was indeed readily detectable from UCμPs and suspensions of cells co-incubated with UCNPs. Measurements using U-DiFC exhibited extremely low background fluorescence and, as expected were free of motion artifacts in mice in vivo (from breathing or the blood pressure wave), which are sometimes observed in conventional (downconversion) DiFC and must be removed through re-positioning or a posteriori data processing.
On the other hand, despite repeated attempts we were unable to achieve labeling of CTCs with UCNPs using the methods reported previously. Overall, our microscopy data (Figure 5) strongly suggested that UCNPs were poorly co-localized with CTCs. Increasing the concentration of UCNPs resulted in higher levels of background (unbound UCNPs) and no apparent increase in cellular uptake. In addition to the specific results presented here, we also attempted a number of other previously reported labeling protocols. For example, we co-incubated glass coverslip-plated LLC cells with 50 μg/mL UCNP-SiO2-NH2 modified UCNPs for 1 hr, followed by repeated washing with PBS as reported previously.39 We also tried liposomal encapsulation of UNCPs to aid uptake and labeling of cells.54,55 However, these methods also did not result in satisfactory internalization in our hands.
Although it is possible that a small fraction of the upconverted luminescence signal measured in mice in vivo may have originated from UCNP-labeled MM cells, in combination our data strongly suggest that most of the luminescence originated from non-internalized UCNPs. As we have noted, cell suspensions probably retained some unbound or weakly-adherent UCNPs that were introduced into circulation on injection. As such, much of the measured U-DiFC signals likely arose from circulating aggregates or non-specific uptake by other blood cells.
In summary, use of UCNPs as an exogenous contrast agent for CTCs is a potentially promising strategy, with a number of clear advantages for DiFC and other intravital IVFC methods. However, further work is needed to achieve reliable and specific labeling of CTCs with UCNPs, and verify long-term retention and viability of cells.
Acknowledgments
This work was funded by the National Institutes of Health (R01HL124315; NHLBI and EB018464, NIBIB). The authors thank Mr. William (Bill) Fowler of Northeastern University for his assistance in generating the TEM images. The authors also thank Dr. Paige Baldwin for her assistance in liposomal encapsulation of UCNPs.
Disclosure
The authors report no conflicts of interest in this work.
References
1. Gupta GP, Massague J. Cancer metastasis: building a framework. Cell. 2006;127(4):679–695. doi:10.1016/j.cell.2006.11.001
2. Steeg PS, Theodorescu D. Metastasis: a therapeutic target for cancer. Nat Clin Pract Oncol. 2008;5(4):206–219. doi:10.1038/ncponc1066
3. Alix-panabieres C, Pantel K. Circulating tumor cells: liquid biopsy of cancer. Clin Chem. 2013;59(1):110–118. doi:10.1373/clinchem.2012.194258
4. Cristofanilli M, Budd GT, Ellis MJ, et al. Circulating tumor cells, disease progression, and survival in metastatic breast cancer. N Engl J Med. 2004;351(8):781–791. doi:10.1056/NEJMoa040766
5. Joosse SA, Gorges TM, Pantel K. Biology, detection, and clinical implications of circulating tumor cells. EMBO Mol Med. 2015;7(1):1–11. doi:10.15252/emmm.201303698
6. Mader S, Pantel K. Liquid biopsy: current status and future perspectives. Oncol Res Treat. 2017;40(7–8):404–408. doi:10.1159/000478018
7. Toss A, Mu Z, Fernandez S, Cristofanilli M. CTC enumeration and characterization: moving toward personalized medicine. Ann Transl Med. 2014;2(11):108.
8. Hartmann C, Patil R, Lin CP, Niedre M. Fluorescence detection, enumeration and characterization of single circulating cells in vivo: technology, applications and future prospects. Phys Med Biol. 2017;63(1):01TR01. doi:10.1088/1361-6560/aa98f9
9. Tuchin VV, Tarnok A, Zharov VP. In vivo flow cytometry: a horizon of opportunities. Cytometry A. 2011;79(10):737–745. doi:10.1002/cyto.a.21143
10. Galanzha EI, Menyaev YA, Yadem AC, et al. In vivo liquid biopsy using cytophone platform for photoacoustic detection of circulating tumor cells in patients with melanoma. Sci Transl Med. 2019;11:496. doi:10.1126/scitranslmed.aat5857
11. He Y, Wang L, Shi J, et al. In vivo label-free photoacoustic flow cytography and on-the-spot laser killing of single circulating melanoma cells. Sci Rep. 2016;6:39616. doi:10.1038/srep39616
12. Chen CK, Liu TM. Imaging morphodynamics of human blood cells in vivo with video-rate third harmonic generation microscopy. Biomed Opt Express. 2012;3(11):2860–2865. doi:10.1364/BOE.3.002860
13. Golan L, Yeheskely-hayon D, Minai L, Dann EJ, Yelin D. Noninvasive imaging of flowing blood cells using label-free spectrally encoded flow cytometry. Biomed Opt Express. 2012;3(6):1455–1464. doi:10.1364/BOE.3.001455
14. Georgakoudi I, Solban N, Novak J, et al. In vivo flow cytometry: a new method for enumerating circulating cancer cells. Cancer Res. 2004;64(15):5044–5047. doi:10.1158/0008-5472.CAN-04-1058
15. Hwu D, Boutrus S, Greiner C, DiMeo T, Kuperwasser C, Georgakoudi I. Assessment of the role of circulating breast cancer cells in tumor formation and metastatic potential using in vivo flow cytometry. J Biomed Opt. 2011;16(4):040501. doi:10.1117/1.3560624
16. He W, Wang H, Hartmann LC, Cheng JX, Low PS. In vivo quantitation of rare circulating tumor cells by multiphoton intravital flow cytometry. Proc Natl Acad Sci U S A. 2007;104(28):11760–11765. doi:10.1073/pnas.0703875104
17. Nedosekin DA, Verkhusha VV, Melerzanov AV, Zharov VP, Galanzha EI. In vivo photoswitchable flow cytometry for direct tracking of single circulating tumor cells. Chem Biol. 2014;21(6):792–801. doi:10.1016/j.chembiol.2014.03.012
18. Chang YC, Ye JY, Thomas TP, et al. Fiber-optic multiphoton flow cytometry in whole blood and in vivo. J Biomed Opt. 2010;15(4):047004. doi:10.1117/1.3463481
19. Zettergren E, Vickers D, Runnels J, Murthy SK, Lin CP, Niedre M. Instrument for fluorescence sensing of circulating cells with diffuse light in mice in vivo. J Biomed Opt. 2012;17(3):037001. doi:10.1117/1.JBO.17.3.037001
20. Tan X, Patil R, Bartosik P, Runnels JM, Lin CP, Niedre M. In vivo flow cytometry of extremely rare circulating cells. Sci Rep. 2019;9:3366. doi:10.1038/s41598-019-40143-2
21. Patil R, Tan X, Bartosik P, et al. Fluorescence monitoring of rare circulating tumor cell and cluster dissemination in a multiple myeloma xenograft model in vivo. J Biomed Opt. 2019;24(8):1–11. doi:10.1117/1.JBO.24.8.085004
22. Pera V, Zettergren E, Brooks DH, Niedre M. Maximum likelihood tomographic reconstruction of extremely sparse solutions in diffuse fluorescence flow cytometry. Opt Lett. 2013;38(13):2357–2359. doi:10.1364/OL.38.002357
23. Di W, Tan X, Calderon IAC, Neal Reilly AE, Niedre M, Clark HA. Real-time particle-by-particle detection of erythrocyte-camouflaged microsensor with extended circulation time in the bloodstream. Proc Natl Acad Sci U S A. 2020;117:3509–3517. doi:10.1073/pnas.1914913117
24. Pestana N, Mortensen LJ, Runnels JP, et al. Improved diffuse fluorescence flow cytometer prototype for high sensitivity detection of rare circulating cells in vivo. J Biomed Opt. 2013;18(7):077002. doi:10.1117/1.JBO.18.7.077002
25. Zettergren E, Swamy T, Runnels J, Lin CP, Niedre M. Tomographic sensing and localization of fluorescently labeled circulating cells in mice in vivo. Phys Med Biol. 2012;57(14):4627–4641. doi:10.1088/0031-9155/57/14/4627
26. Shaner NC, Steinbach PA, Tsien RY. A guide to choosing fluorescent proteins. Nat Methods. 2005;2(12):905–909. doi:10.1038/nmeth819
27. Haase M, Schafer H. Upconverting nanoparticles. Angew Chem Int Ed Engl. 2011;50(26):5808–5829.
28. Jacques SL. Optical properties of biological tissues: a review. Phys Med Biol. 2013;58(11):R37–61. doi:10.1088/0031-9155/58/11/R37
29. Esipova TV, Ye X, Collins JE, et al. Dendritic upconverting nanoparticles enable in vivo multiphoton microscopy with low-power continuous wave sources. Proc Natl Acad Sci U S A. 2012;109(51):20826–20831. doi:10.1073/pnas.1213291110
30. Wang M, Abbineni G, Clevenger A, Mao C, Xu S. Upconversion nanoparticles: synthesis, surface modification and biological applications. Nanomedicine. 2011;7(6):710–729. doi:10.1016/j.nano.2011.02.013
31. Abdul Jalil R, Zhang Y. Biocompatibility of silica coated NaYF(4) upconversion fluorescent nanocrystals. Biomaterials. 2008;29(30):4122–4128. doi:10.1016/j.biomaterials.2008.07.012
32. Wang F, Banerjee D, Liu Y, Chen X, Liu X. Upconversion nanoparticles in biological labeling, imaging, and therapy. Analyst. 2010;135(8):1839–1854. doi:10.1039/c0an00144a
33. Plunkett S, El Khatib M, Sencan I, et al. In vivo deep-tissue microscopy with UCNP/Janus-dendrimers as imaging probes: resolution at depth and feasibility of ratiometric sensing. Nanoscale. 2020;12(4):2657–2672. doi:10.1039/C9NR07778B
34. Gnach A, Lipinski T, Bednarkiewicz A, Rybka J, Capobianco JA. Upconverting nanoparticles: assessing the toxicity. Chem Soc Rev. 2015;44(6):1561–1584. doi:10.1039/C4CS00177J
35. Xiong L, Yang T, Yang Y, Xu C, Li F. Long-term in vivo biodistribution imaging and toxicity of polyacrylic acid-coated upconversion nanophosphors. Biomaterials. 2010;31(27):7078–7085. doi:10.1016/j.biomaterials.2010.05.065
36. Vedunova MV, Mishchenko TA, Mitroshina EV, et al. Cytotoxic effects of upconversion nanoparticles in primary hippocampal cultures. RSC Adv. 2016;6:33656–33665. doi:10.1039/C6RA01272H
37. Guller AE, Nadort A, Generalova AN, et al. Rational surface design of upconversion nanoparticles with polyethylenimine coating for biomedical applications: better safe than brighter? ACS Biomater Sci Eng. 2018;4:3143–3153. doi:10.1021/acsbiomaterials.8b00633
38. Xiong L, Chen Z, Tian Q, Cao T, Xu C, Li F. High contrast upconversion luminescence targeted imaging in vivo using peptide-labeled nanophosphors. Anal Chem. 2009;81(21):8687–8694. doi:10.1021/ac901960d
39. Xiong LQ, Chen ZG, Yu MX, Li FY, Liu C, Huang CH. Synthesis, characterization, and in vivo targeted imaging of amine-functionalized rare-earth up-converting nanophosphors. Biomaterials. 2009;30(29):5592–5600. doi:10.1016/j.biomaterials.2009.06.015
40. Hu H, Xiong L, Zhou J, Li F, Cao T, Huang C. Multimodal-luminescence core-shell nanocomposites for targeted imaging of tumor cells. Chemistry. 2009;15(14):3577–3584. doi:10.1002/chem.v15:14
41. Goh Y, Song YH, Lee G, Bae H, Mahata MK, Lee KT. Cellular uptake efficiency of nanoparticles investigated by three-dimensional imaging. Phys Chem Chem Phys. 2018;20(16):11359–11368. doi:10.1039/C8CP00493E
42. Foroozandeh P, Aziz AA. Insight into cellular uptake and intracellular trafficking of nanoparticles. Nanoscale Res Lett. 2018;13(1):339. doi:10.1186/s11671-018-2728-6
43. Chatterjee DK, Rufaihah AJ, Zhang Y. Upconversion fluorescence imaging of cells and small animals using lanthanide doped nanocrystals. Biomaterials. 2008;29(7):937–943. doi:10.1016/j.biomaterials.2007.10.051
44. Wang M, Mi CC, Wang WX, et al. Immunolabeling and NIR-excited fluorescent imaging of HeLa cells by using NaYF(4): yb,Er upconversion nanoparticles. ACS Nano. 2009;3(6):1580–1586. doi:10.1021/nn900491j
45. He W, Kularatne SA, Kalli KR, et al. Quantitation of circulating tumor cells in blood samples from ovarian and prostate cancer patients using tumor-specific fluorescent ligands. Int J Cancer. 2008;123(8):1968–1973. doi:10.1002/ijc.v123:8
46. Pera V, Tan X, Runnels J, Sardesai N, Lin CP, Niedre M. Diffuse fluorescence fiber probe for in vivo detection of circulating cells. J Biomed Opt. 2017;22(3):37004. doi:10.1117/1.JBO.22.3.037004
47. Dong A, Ye X, Chen J, et al. A generalized ligand-exchange strategy enabling sequential surface functionalization of colloidal nanocrystals. J Am Chem Soc. 2011;133(4):998–1006. doi:10.1021/ja108948z
48. Bogdan N, Vetrone F, Roy R, Capobianco JA. Carbohydrate-coated lanthanide-doped upconverting nanoparticles for lectin recognition. J Mater Chem. 2010;20(35):7543–7550. doi:10.1039/c0jm01617a
49. Jin J, Gu YJ, Man CW, et al. Polymer-coated NaYF(4): yb(3)(+),Er(3)(+) upconversion nanoparticles for charge-dependent cellular imaging. ACS Nano. 2011;5(10):7838–7847. doi:10.1021/nn201896m
50. Yaseen MA, Srinivasan VJ, Gorczynska I, Fujimoto JG, Boas DA, Sakadzic S. Multimodal optical imaging system for in vivo investigation of cerebral oxygen delivery and energy metabolism. Biomed Opt Express. 2015;6(12):4994–5007. doi:10.1364/BOE.6.004994
51. Gainer CF, Utzinger U, Romanowski M. Scanning two-photon microscopy with upconverting lanthanide nanoparticles via Richardson-Lucy deconvolution. J Biomed Opt. 2012;17(7):076003. doi:10.1117/1.JBO.17.7.076003
52. Finikova OS, Lebedev AY, Aprelev A, et al. Oxygen microscopy by two-photon-excited phosphorescence. Chemphyschem. 2008;9(12):1673–1679. doi:10.1002/cphc.v9:12
53. Pitsillides CM, Runnels JM, Spencer JA, Zhi L, Wu MX, Lin CP. Cell labeling approaches for fluorescence-based in vivo flow cytometry. Cytometry A. 2011;79(10):758–765. doi:10.1002/cyto.a.21125
54. Spring BQ, Bryan Sears R, Zheng LZ, et al. A photoactivable multi-inhibitor nanoliposome for tumour control and simultaneous inhibition of treatment escape pathways. Nat Nanotechnol. 2016;11(4):378–387. doi:10.1038/nnano.2015.311
55. Huang Y, Hemmer E, Rosei F, Vetrone F. Multifunctional liposome nanocarriers combining upconverting nanoparticles and anticancer drugs. J Phys Chem B. 2016;120(22):4992–5001. doi:10.1021/acs.jpcb.6b02013
 © 2020 The Author(s). This work is published and licensed by Dove Medical Press Limited. The
full terms of this license are available at https://www.dovepress.com/terms.php
and incorporate the Creative Commons Attribution
- Non Commercial (unported, v3.0) License.
By accessing the work you hereby accept the Terms. Non-commercial uses of the work are permitted
without any further permission from Dove Medical Press Limited, provided the work is properly
attributed. For permission for commercial use of this work, please see paragraphs 4.2 and 5 of our Terms.
© 2020 The Author(s). This work is published and licensed by Dove Medical Press Limited. The
full terms of this license are available at https://www.dovepress.com/terms.php
and incorporate the Creative Commons Attribution
- Non Commercial (unported, v3.0) License.
By accessing the work you hereby accept the Terms. Non-commercial uses of the work are permitted
without any further permission from Dove Medical Press Limited, provided the work is properly
attributed. For permission for commercial use of this work, please see paragraphs 4.2 and 5 of our Terms.