Back to Journals » Journal of Pain Research » Volume 14
Prospective Analysis Utilizing Intraoperative Neuromonitoring for the Evaluation of Inter-Burst Frequencies
Authors Falowski SM ![]() , Benison A
, Benison A
Received 3 January 2021
Accepted for publication 6 February 2021
Published 11 March 2021 Volume 2021:14 Pages 703—710
DOI https://doi.org/10.2147/JPR.S298797
Checked for plagiarism Yes
Review by Single anonymous peer review
Peer reviewer comments 2
Editor who approved publication: Dr Dawood Sayed
Steven M Falowski, Alexander Benison
Neurosurgical Associates of Lancaster, Lancaster, PA, USA
Correspondence: Steven M Falowski
Director Functional Neurosurgery, Neurosurgical Associates of Lancaster, 160 N Pointe Blvd Suite 200, Lancaster, PA, 17601 Tel +44-358-0800
Email [email protected]
Background: Intraoperative neuromonitoring (IONM) for spinal cord stimulation (SCS) uses electromyography (EMG) responses to determine myotomal coverage as a marker for dermatomal coverage.
Objective: These responses can be utilized to evaluate the effects of stimulation platforms on the nervous system.
Methods: Eight patients were tested at inter-burst frequencies of 10 Hz, 20 Hz, 30 Hz, and 40 Hz using DeRidder Burst stimulation to determine the amplitude of onset of post-synaptic signal generation. Three patients had additional data recording amplitude of onset of tonic stimulation prior to and post DeRidder Burst stimulation at each inter-burst frequency. This represented post-synaptic excitability.
Results: In all patients, the DeRidder Burst waveform generated EMG responses under all inter-burst frequencies including temporal summation, deeper fiber recruitment, and compounded action potentials. There was a non-significant decrease of 7.6– 7.8% in amplitudes to generate response under 40 Hz, compared to the other frequencies. However, there was a 73.1% reduction in energy requirements at 10 Hz. The enhanced post-synaptic excitability effect was demonstrated at all frequencies.
Conclusion: DeRidder Burst has similar effects of temporal summation, deeper fiber recruitment, and compounded action potentials under IONM at 40 Hz, 30 Hz, 20 Hz, and 10 Hz. In addition, the hyperexcitability phenomenon was also observed regardless of the frequency. This demonstrates that postsynaptic responses captured via IONM may be a sensitive biomarker to SCS mechanism of action. In addition, lower inter-burst frequencies may have a similar clinical effect on pain relief thus reducing power consumption even further than current dosing paradigms.
Keywords: electromyogram, EMG, SCS, somatosensory evoked potentials, spinal cord stimulation, SSEPS, Burst, DeRidder Burst
Introduction
Spinal cord stimulation (SCS) has relied on overlapping paresthesia with the painful region.1 Confirming lead positioning to achieve this overlap has been accomplished with awake intraoperative testing allowing verbal feedback, or with intraoperative neuromonitoring (IONM) in sedated patients.2–6 IONM has demonstrated not only its safety and use for confirmation of lead placement, but also potential lower adverse events, decreased operative times, and improved accuracy of lead positioning.2–6
The Neuromodulation Appropriateness Consensus Committee (NACC) guidelines state
Confirmation of correct lead placement has been advocated with either awake intraoperative confirmation of paresthesia coverage or use of neuromonitoring in asleep placement, such as Electromyography (EMG) responses or SSEP collision testing.7
IONM uses electromyography (EMG) responses, or myotomal coverage, as a marker for dermatomal coverage. This confirmation determines physiological midline and guides the positioning of the electrode.6
The Gate Control Theory of Melzack and Wall postulated that certain nonpainful sensory inputs, such as those transmitted by Aß fibers, could block or mask the nociceptive input transmitted by A∂ and C fibers.8 A study demonstrated that SCS decreases H-reflex amplitudes, and the spinal withdrawal reflex, correlating with the degree of SCS induced pain relief.8 This is particularly important with IONM, as the generation of EMG responses is correlative to the generation of antidromic post-synaptic signals that are representative of generating an H-reflex intraoperatively.9 Hence, SCS may exert its effects on involuntary sensorimotor reflexes mediated by large-diameter (Aβ) and small-diameter (Aδ and C) sensory afferents. This neural circuit and it’s neuroplastic behavior may be an important biomarker for mechanisms of action (MOA) of SCS therapy.
Most new therapies are paresthesia-free, but continuing to be based on physiological placement. These various waveforms can include traditional tonic, DeRidder Burst passive discharge, high frequency (10,000 Hz), high dose (1000 Hz), and Burst 3D or active discharge cycling tonic stimulation.10–13 These waveforms have distinct differences working by different MOA.9
Falowski et al demonstrated DeRidder Burst had the most distinct responses under IONM, compared to other signals as well as traditional tonic firing.9 This waveform was the most energy efficientenergy-efficient generating its signals at the lowest thresholds. It was also associated with a priming or propagating effect leading to a hyperexcitable state of the nerve fibers following cessation of the active stimulation. Several publications have looked at the differences observed post-synaptically where DeRidder Burst overrides ongoing activity via a stronger post-synaptic neuronal effect9,14,15 This was also seen with the enhanced excitability and the DeRidder post-synaptic potentials observed under IONM. These fundamental differences were only observed with DeRidder Burst demonstrating its unique characteristics with objective electrophysiological recordings in a clinical setting compared to other SCS paradigms.16
DeRidder Burst at 40 Hz has been associated in animal studies with decreased perception of painful responses.17 It is programmed using 40 Hz inter-burst frequency with 5 spikes at an intra-burst frequency of 500 Hz with a pulse width of 1000 µS. It is theorized that the MOA of this stimulation pattern is due to the charge accumulation during the burst, more so than the overall frequency of 40 Hz which was based on early animal work and neuronal firing characteristics.15 In this series, we use IONM to determine if the unique characteristics of DeRidder Burst can be duplicated at different inter-burst frequencies. Specifically, we determine if lower frequencies, with potential large energy savings, can produce the same responses including temporal summation, deeper fiber recruitment, compounded action potentials, and enhanced post-synaptic excitability.
Methods
This is a prospective case series of 8 consecutive patients being tested at 10 Hz, 20 Hz, 30 Hz, and 40 Hz under DeRidder Burst (Abbott BurstDR, Plano, Tx),10 for amplitude of post-synaptic signals. Three patients had additional data recording amplitude of post-synaptic signal onset using tonic stimulation (250 µS, 8 Hz) prior and post DeRidder Burst stimulation, at each inter-burst frequencies. This was used as a marker of post-synaptic excitability. The three patients were the last three of the series in which it was determined that the onset of DeRidder Burst signal generation were duplicated in the first 5 patients, and therefore the addition of testing for the hyperexcitability effect was added. Statistical analysis was performed with a one-way ANOVA comparing groups, followed by a Fisher’s LSD for multiple or individual comparisons.
All patients underwent a successful percutaneous trial (>50% relief) prior to their permanent implantation. IONM was performed during permanent implantation. WCG Western IRB approval was obtained (Protocol No 2020-IONM). All patients provided informed consent, in accordance with the Declaration of Helsinki. Information was obtained without identifiable features. All implants were performed by a single private practice surgeon in an outpatient surgical center setting. Standard procedure for general anesthesia with IONM was performed.6 Neuromonitoring was performed by a single well-experienced board-certified neurophysiologist.
All patients had the same type of five-column paddle electrode implanted covering T8-T10 (Abbott Penta Paddle, Plano, Tx). Physiological mapping was performed under traditional tonic parameters to place the lead on midline. Programming parameters were a midline bipole with 10 Hz, Pulse Width (PW) 250 µS, and amplitudes up to 10.0 mA. These parameters have been previously established.6 EMG activity is used to determine proper paresthesia coverage (Figure 1).
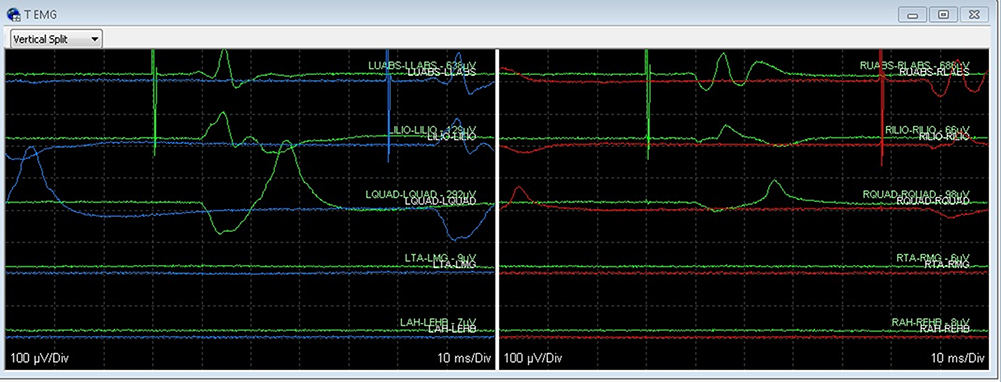 |
Figure 1 EMG myotomal coverage as a marker for dermatomal coverage. Coverage demonstrating bilateral EMG activity slightly favoring the left side that start in the abdominal muscles and progressively work to more distal muscle groups. There are a total of five muscle groups seen in this figure for both the left and right sides. The muscles groups, in order, are abdominal, iliopsoas, quadriceps, tibialis anterior, and abductor hallicus. Time-locked spikes can be seen on the left side with higher amplitudes compared to the right side. |
Once appropriate position was obtained recordings were performed using DeRidder Burst. The amplitude was increased at 0.05 mA increments until EMG responses were obtained. The amplitude of recorded effect was at the onset of distal muscle responses for 40 Hz, 30 Hz, 20 Hz, and 10 Hz inter-burst frequencies. Testing order was randomized with a 60 second rest period initiated between each frequency. Figure 2 demonstrates expected responses including closely packed five pulse-train sequences, with a quiescent rest phase, occurring in the abdominal muscles.9 The EMG response propagates into one large compounded DeRidder EMG spike, which is distinct from tonic stimulation which has a 1–1 non-summated response (Figures 1 and 2). The onset of EMG recruitment is first seen in the distal muscle group of the gastrocnemius, distinct from the more proximal activation with tonic stimulation.
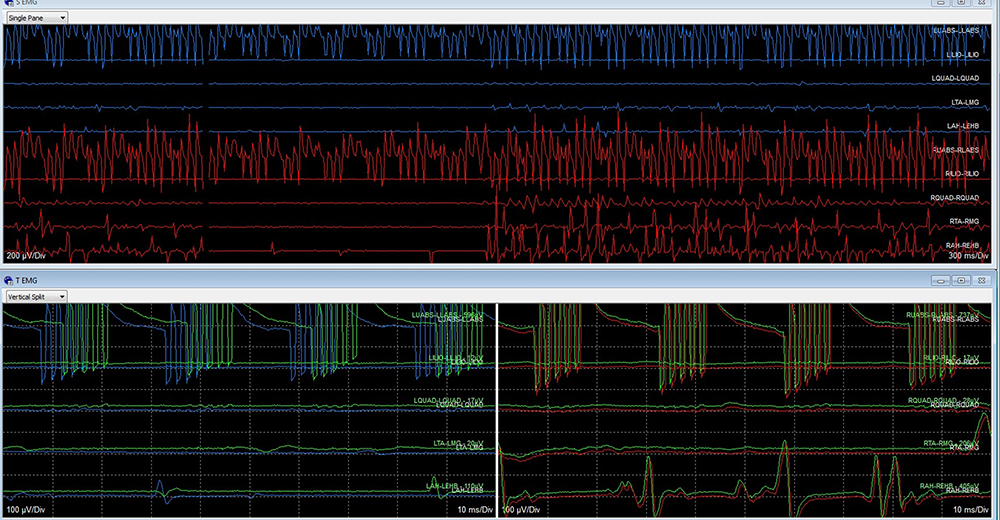 |
Figure 2 DeRidder Burst (BurstDR) waveform with closely packed five pulse-train pattern, with a quiescent phase, in the abdominal muscles which is the first line on lower portion of image for both left and right sides of the figure. EMG responses were propagated into one large EMG spike as you follow the time locked responses through the subsequent muscle groups. The right side is larger than the left. In the final muscle group of abductor hallicus you can see a single very large spike. The top half of the image demonstrates stimulation artifact within the same muscle groups which is earlier onset than time locked complete EMG responses. |
For the final three patients, the post-synaptic excitability effect was recorded. The amplitude of tonic stimulation was increased at 0.10 mA increments until EMG responses were obtained. The amplitude was recorded at the onset of muscle responses in the Quadricep. A baseline tonic stimulation activation was obtained. The patients then underwent stimulation with DeRidder Burst for a total of 30 seconds. They were immediately returned to tonic stimulation with the amplitude being taken again evaluating for changes in threshold. This was performed at DeRidder Burst 40 Hz, 30 Hz, 20 Hz, and 10 Hz with a 60 second rest period between each frequency.
Results
In all patients, DeRidder Burst generated responses with 40 Hz, 30 Hz, 20 Hz, and 10 Hz including temporal summation, deeper fiber recruitment, and compounded action potentials (Tables 1 and 2). Table 2 lists the amplitude of stimulation. There was not a statistically significant reduction in activation amplitude after burst stimulation from 40 Hz, when compared to 30 Hz through 10 Hz. However, this difference was approximately 0.10 −0.20 mA which equates to a 7.6–7.8% difference in amplitudes. There was no difference comparing 30Hz, 20Hz, and 10Hz. Figure 3 is the post-synaptic activation thresholds across the different frequencies. Calculations, utilizing Ohms’s law (Voltage=Current x Resistance), determined the energy savings that would occur at lower frequencies when offset by the slight increase in amplitudes. There was a 73.1% reduction in energy requirements utilizing 10 Hz compared to 40 Hz, 46.1% with 20 Hz, and 19.1% with 30 Hz.
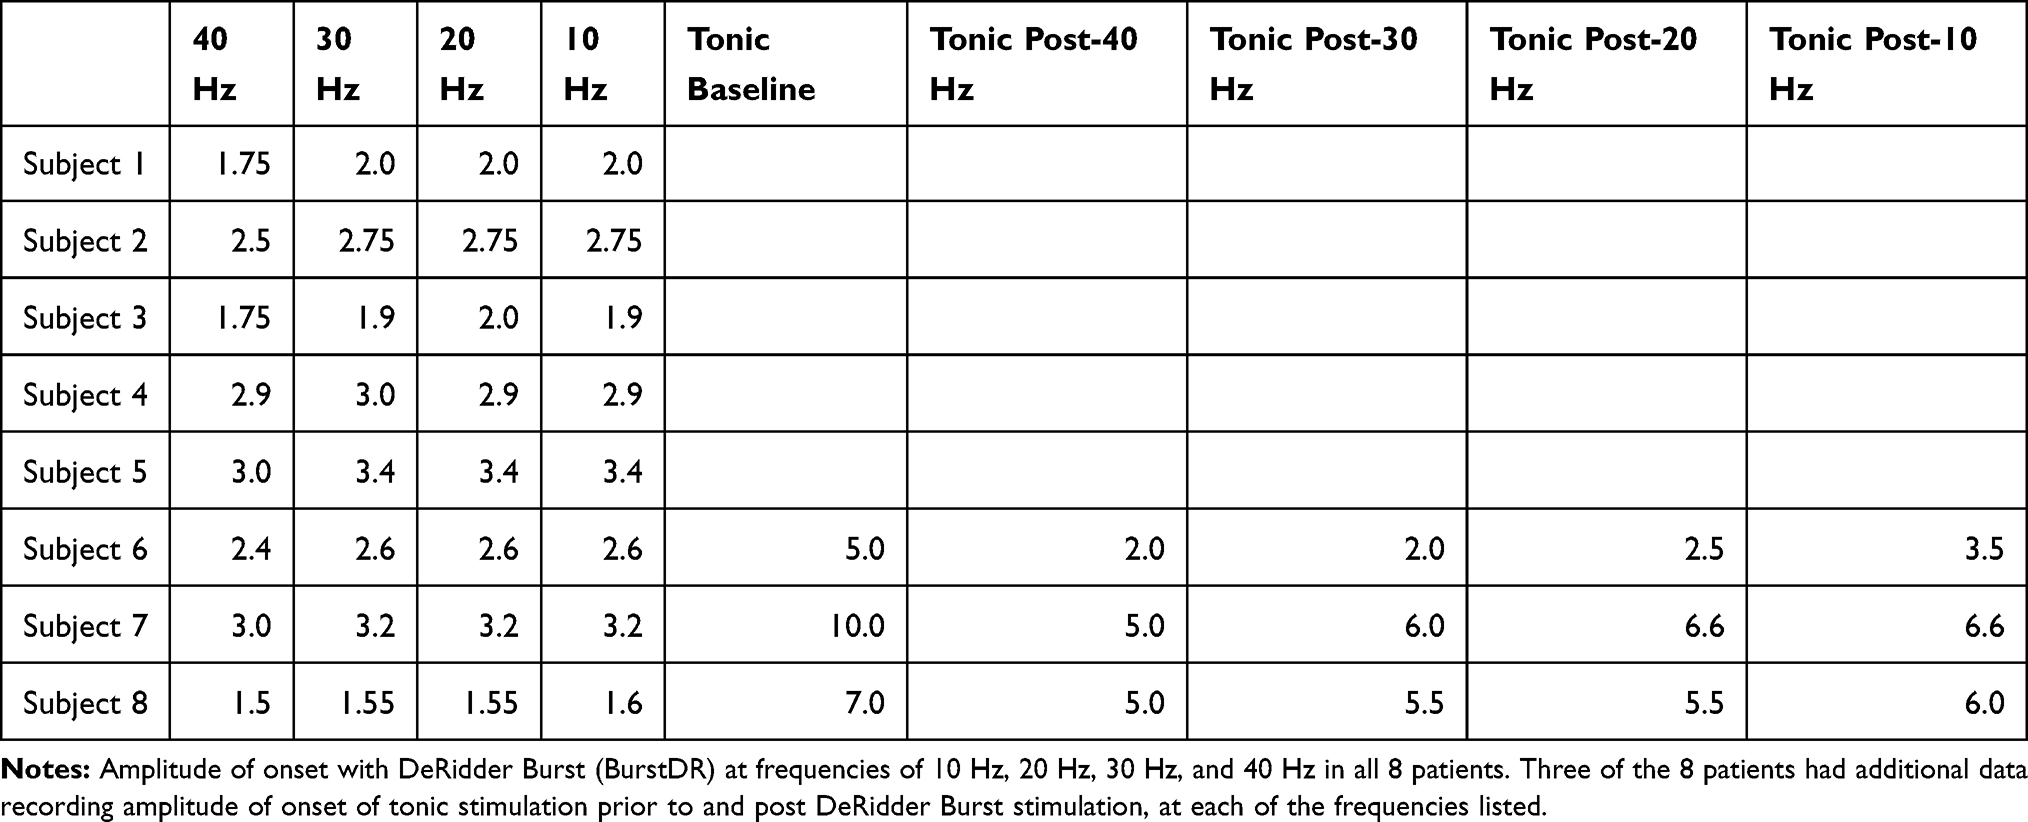 |
Table 1 Amplitude of Onset of Signal Generation |
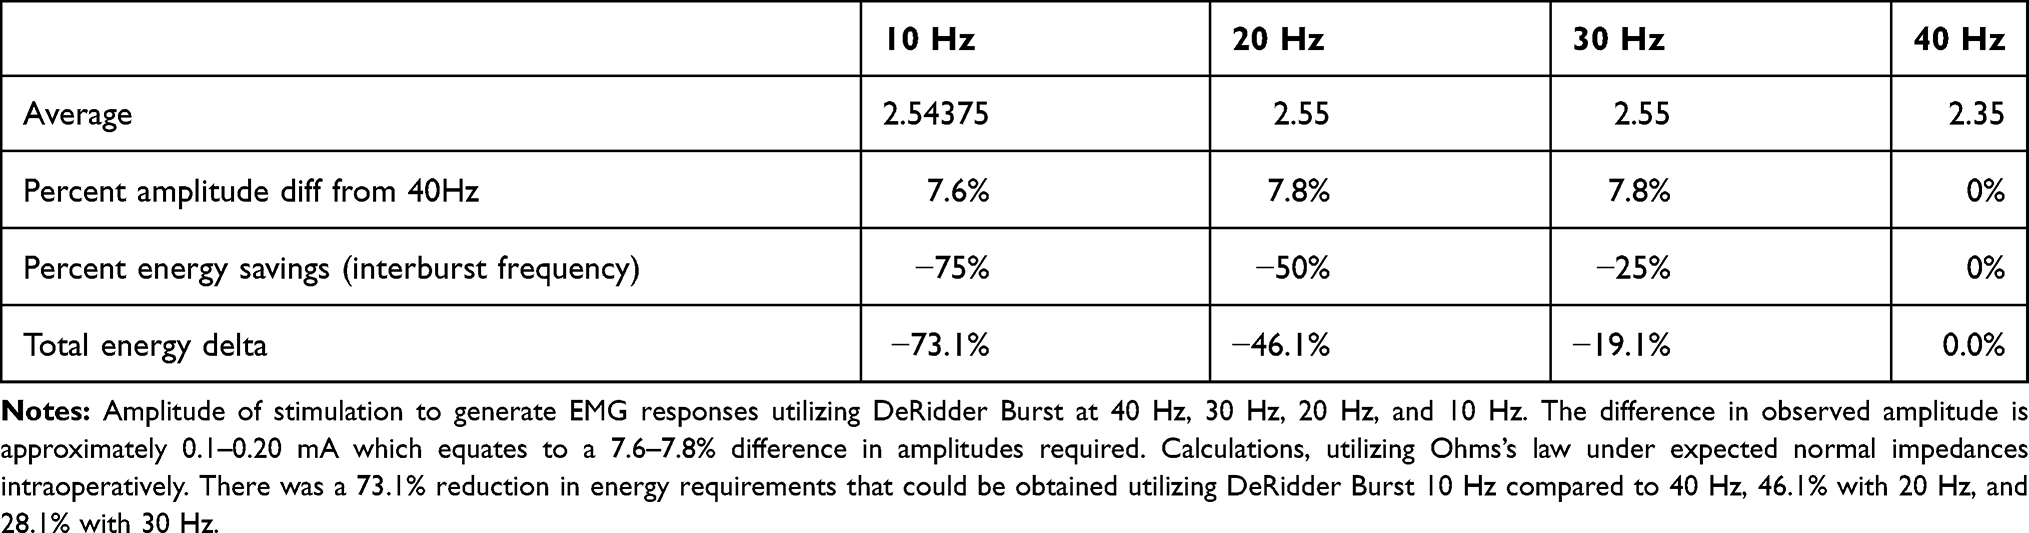 |
Table 2 EMG Response Signal Onset |
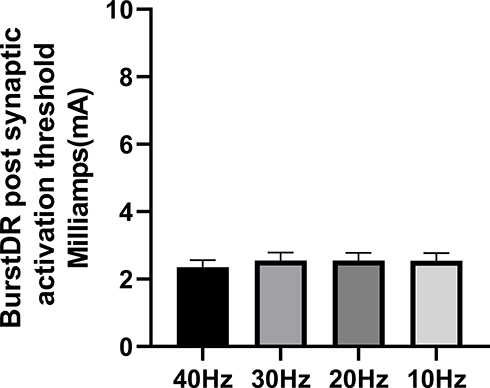 |
Figure 3 Post-synaptic activation thresholds across the different frequencies of DeRidder Burst. There was a slight reduction in the activation amplitude necessary to elicit a response after burst stimulation from baseline at 40 Hz compared to 30 Hz-10 Hz, but this did not reach statistical significance. There was also no difference when comparing 30 Hz, 20 Hz, and 10 Hz. |
Table 1 is the post-synaptic excitability effect in the final three patients. For each, baseline tonic threshold was obtained. The thresholds differ across patients due to anatomical and physiological variations with our patients having 5.0 mA, 7.0 mA, and 10.0 mA. The threshold for tonic after each DeRidder Burst frequency is recorded demonstrating an average reduction of approximately 54% with 40 Hz (p value 0.0002). There were higher required amplitudes with decreasing frequency, with all tested frequencies demonstrating statistically significant lower activation thresholds compared to baseline tonic (40 Hz: p value 0.0002, 30 Hz: p value 0.0005, 20 Hz: p value 0.001, 10 Hz: p value 0.005), and therefore a post-synaptic excitability effect in which activation thresholds decreased. There was a statistically significant difference comparing post-synaptic excitability at 40 Hz to 10 Hz (p value 0.03), but not between 30 Hz and 20 Hz. Figure 4A demonstrates the post-synaptic excitability effect in each patient. Figure 4B is the average post-synaptic excitability effect compared to average baseline tonic.
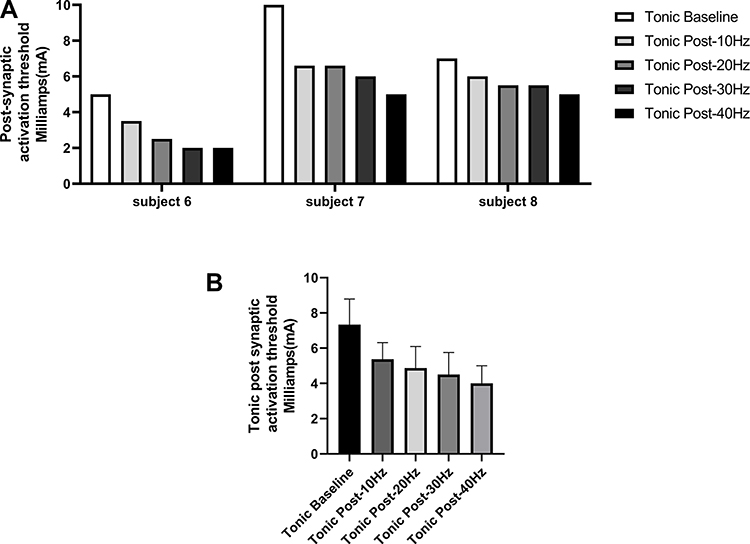 |
Figure 4 (A) Post-synaptic excitability effect in each of the final three patients. For each of the three patients a baseline tonic stimulation threshold was obtained. These were 5.0 mA, 7.0 mA, and 10 mA. The threshold of activation after each DeRidder Burst frequency is recorded. There was a trend for higher required amplitudes with decreasing frequency in each individual. (B) Average post-synaptic excitability effect when compared to baseline tonic stimulation. Baseline tonic is statistically significantly different from tonic post burst 40–10 Hz. There is also statistically significant difference between tonic post burst 40 Hz and 10 Hz, but not comparing between the others. |
Figure 5 is the average amplitudes for tonic, post DeRidder Burst tonic, and DeRidder Burst. The DeRidder Burst averages include all 8 patients while the others include the three patients tested for post-synaptic excitability. There is a statistically significant decrease in thresholds for traditional tonic with the post-synaptic excitability effect (p value 0.0008). There is also the significant decrease in thresholds with DeRidder Burst, which is statistically significant from both baseline tonic (p value 0.0001) and tonic post DeRidder Burst (p value 0.0001). These findings have been previously demonstrated in another publication that was without statistical analysis (9) and equate to significant reduction in energy.
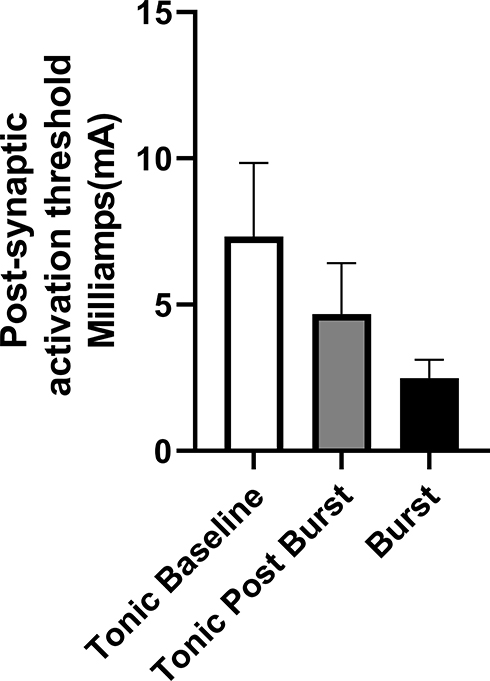 |
Figure 5 Average amplitudes for tonic, post DeRidder Burst tonic, and DeRidder Burst. The DeRidder Burst averages include all 8 patients while the post DeRidder Burst tonic include the three patients tested for hyperexcitability. There is a statistically significant decrease in thresholds for activation with traditional tonic stimulation with the post-synaptic excitability effect. There is also the expected significant decrease in thresholds with DeRidder Burst, which is statistically significant from both baseline tonic and tonic post DeRidder Burst. |
Discussion
Neurophysiological mapping for lead positioning is a mainstay of SCS. This is performed with awake placement or the use of IONM,18 also being supported by the NACC guidelines.7 IONM uses EMG responses, or myotomal coverage, as a marker for dermatomal coverage to confirm lead positioning, and has the safety measure of monitoring the spinal cord.5,6
IONM generates EMG responses that are correlative to generation of antidromic post-synaptic signals that are representative of generating an H-reflex intraoperatively.4,9 Shils and Arle demonstrated that stimulation from tonic SCS solicits compound muscle action potentials from antidromic activation of the dorsal columns though large diameter fibers.4 Another study demonstrated that SCS decreases H-reflex amplitudes, and the spinal withdrawal reflex, correlating with the degree of SCS induced pain relief.8 Although most studies with SCS evaluate traditional tonic parameters, the use of IONM to evaluate waveform morphology and responses has been evaluated.9 It was demonstrated that DeRidder Burst had the most fundamentally different mechanism being the most energy efficient generating its signals at the lowest thresholds, had deep or distal fiber recruitment, and associated with a priming or propagating effect leading to a hyperexcitable/post-synaptic excitable state of the nerve fibers.
DeRidder Burst is a five pulse-train waveform with a passive quiescent phase. It is run at a 40 Hz inter-burst frequency with 5 spikes at an intra-burst frequency 500 Hz, and pulse width 1000 µS. Although the use of 40 Hz has been demonstrated for its use in decreasing painful response,17 the unique characteristics of the 5-pulse sequence may be able to generate similar responses and results at other frequencies. The 5-pulse sequence includes a train of action potentials occurring during an active phase, followed by a quiescence or rest phase. This uniqueness leads to a rest phase that is the result of calcium influx on top of sodium spikes causing compounding of action potentials.19 Given that a hyperexcitable/post-synaptic excitable effect has been demonstrated it is not clear what would be considered over versus under-stimulation, as well what is the ideal On and Off times of stimulation.
In this series, DeRidder Burst generated responses with 40 Hz, 30 Hz, 20 Hz, and 10 Hz including temporal summation, deeper fiber recruitment, and compounded action potentials. This demonstrates that the unique features of the waveform lie in the 5-pulse sequence and not the overall frequency. When comparing the interburst frequencies, although not statistically significant, there were slightly lower amplitudes needed for response with 40 Hz compared to others, but this would not be offset by the large energy savings obtained at a lower frequency. There was a 73.1% reduction in energy requirements that could be obtained utilizing DeRidder Burst 10 Hz compared to 40 Hz.
Post-synaptic excitability was present with each frequency. When returning to tonic stimulation following DeRidder Burst there was a statistically significant difference of larger amplitudes for the smallest interburst frequency, but all interburst frequencies demonstrated lower thresholds when compared to baseline tonic. There was an average reduction of 54% in tonic response thresholds following DeRidder Burst at 40 Hz. This reduction was less with lower frequencies and hence the post-synaptic excitability effect, although present at all frequencies, may be more significant at 40 Hz. There is also the significant decrease in thresholds with DeRidder Burst. Both the post-synaptic excitable effect and low amplitude activation of DeRidder Burst 40 Hz have been previously demonstrated,9 but these effects being demonstrated at lower frequencies is novel and equate to significant reduction in required energy.
Overall, there are significant energy savings achieved by lowering the overall frequency. However, this must be balanced by the ability to still generate the unique characteristics of the 5-pulse sequence such as low amplitude activation, deep or distal fiber recruitment, and a post-synaptic excitable effect.9,15 This series of patients demonstrated these features are still generated regardless of overall frequency used. A previous publication demonstrated patients obtained equal pain relief with the stimulation cycled off for up to 6 minutes compared to the standard off times of 90 seconds.20 In our series, although slightly higher amplitudes may be needed under DeRidder Burst at 10–30 Hz, and the hyperexcitable effect may not be as strong, the energy savings at 10 Hz may offset this even if less Off time is needed.
This study did not have the goal of correlating our findings with clinical outcomes of pain relief. Several studies have looked at unique mechanisms of action of waveforms, and also its findings on IONM.9,15 The authors goal was to further demonstrate that the uses of IONM can elucidate mechanism of action and fundamental differences in the effects of a waveform. More importantly, the data obtained can help guide clinical studies where this waveform can now be tested at a lower frequency to determine if clinical outcomes will match its prior results for pain relief.
Limitations in this study include small sample size, and interpretational bias with an observational series. The use of one-way ANOVA and Fisher’s LSD adds additional strong statistical significance, but it is performed on a small sample size. This work is preliminary and further validation would be necessary with a larger sample size. In addition, these specific findings will need to be correlated with clinical outcomes. Lastly, although IONM is becoming more defined in its use and mechanism for SCS, the use of it for interpretation of waveform morphology and its overall effects is less so defined.
This series examined a real-world experience of the effects of DeRidder Burst on human nerve recordings. A larger sample size may be needed to determine which frequency may deliver the ideal hyperexcitable or post-synaptic excitable effect with the lowest amplitude, and then be offset by the energy savings with frequency reduction, in order to demonstrate which would be the most ideal frequency to use in clinical practice. Our findings demonstrate that the use of 10Hz with DeRidder Burst may be ideal, as 40Hz may be overstimulation for some patients depending on the length of the Off period of stimulation. To further elaborate on the post-synaptic excitable effect, future studies will need to determine how long the effect lasts under IONM before returning to baseline. This may be a marker for determining how long patients should have stimulation On versus Off, and eliminate the trial and error of present-day programming leading to a more objective approach for the use of SCS in pain management.
Conclusion
IONM is used for safety and neurophysiological mapping for positioning of the SCS lead. Its uses have also been expanded to evaluating the effects of different waveforms. This series demonstrated that DeRidder Burst may have similar effects of temporal summation, deeper fiber recruitment, and compounded action potentials at 40 Hz, 30 Hz, 20 Hz, and 10 Hz. In addition, the post-synaptic excitability phenomenon existed at all frequencies. These findings equate to significant reduction in energy with the lower frequencies and potential equal efficacy.
Author Contributions
Steven Falowski performed the design, and data collection. All authors contributed to data analysis, drafting or revising the article, have agreed on the journal to which the article will be submitted, gave final approval of the version to be published, and agree to be accountable for all aspects of the work.
Disclosure
Steven Falowski consults for Abbott, Medtronic, Boston Scientific, Vertoss and Saluda. Research is performed with Abbott, Medtronic, Biotronik, Saluda, and Vertiflex. Equity positions held in Saluda, CornerLoc, SPR Therapeutics, Thermaquil, Stimgenics, SpineThera, Neural Integrative Solutions, and AGR. Alex Benison is an employee of Abbott. The authors report no other conflicts of interest in this work.
References
1. Falowski S, Celii A, Sharan A. Spinal cord stimulation: an update. Neurotherapeutics. 2008;5(1):86–99. doi:10.1016/j.nurt.2007.10.066
2. Falowski SM, Celii A, Sestokas AK, Schwartz DM, Matsumoto C, Sharan A. Awake vs. asleep placement of spinal cord stimulators: a cohort analysis of complications associated with placement. Neuromodulation. 2011;14(2):
3. Mammis A, Mogilner AY. The use of intraoperative electrophysiology for the placement of spinal cord stimulator paddle leads under general anesthesia. Neurosurgery. 2012;70:ons230–ons236.
4. Shils JL, Arle JE. Intraoperative neurophysiologic methods for spinal cord stimulator placement under general anesthesia. Neuromodulation. 2012;15(6):
5. Falowski S, Sharan A, McInerney J, Jacobs D, Venkatesan L, Agnesi F. NAPS – nonawake versus awake placement of spinal cord stimulators: a prospective, multicenter study comparing safety and efficacy. Neurosurgery. 2018. doi:10.1093/neuros/nyy062
6. Falowski S, Dianna A. Neuromonitoring protocol for spinal cord stimulator cases with case descriptions. Int J Acad Med. 2016;2:132–144.
7. Deer TR, Lamer TJ, Pope JE, et al. The neurostimulation appropriateness consensus committee (NACC) safety guidelines for the reduction of severe neurological injury. Neuromodulation. 2017;20(1):15–30. doi:10.1111/ner.12564
8. de Andrade DC, Bendib B, Hattou M, Keravel Y, Nguyen JP, Lefaucheur JP. Neurophysiological assessment of spinal cord stimulation in failed back surgery syndrome. Pain. 2010;150(3):485–491. doi:10.1016/j.pain.2010.06.001.
9. Falowski S. An observational case series of spinal cord stimulation waveforms visualized on intraoperative neuromonitoring. Neuromodulation. 2019;22(2):219–228. doi:10.1111/ner.12781.
10. Deer T, Slavin KV, Amirdelfan K, North RB, Burton AW, Yearwood TL. Success using neuromodulation with BURST (SUNBURST) study: results from a prospective, randomized controlled trial using a novel burst waveform. Neuromodulation. 2018;21(1):56–66. doi:10.1111/ner.12698
11. Kapural L, Yu C, Doust M. Novel 10-kHz high-frequency therapy (HF10 therapy) is superior to traditional low-frequency spinal cord stimulation for the treatment of chronic back and leg pain. The SENZA-RCT randomized controlled trial. Anesthesiology. 2015;123(4):851–860. doi:10.1097/ALN.0000000000000774
12. Provenzano DA, Rebman J, Kuhel C, Trenz H, Kilgore J. The efficacy of high-density spinal cord stimulation among trial, implant, and conversion patients: a retrospective case series. Neuromodulation. 2017;20(7):654. doi:10.1111/ner.12612
13. Veizi E, Hayek SM, North J, et al. Spinal Cord Stimulation (SCS) with anatomically guided (3D) neural targeting shows superior chronic axial low back pain relief compared to traditional SCS-LUMINA study. Pain Med. 2017;18(8):1534–1548. doi:10.1093/pm/pnw286
14. Weisshaar CL, Kent AR, Venkatesan L, et al. Comparison of burst SCS paradigms on acute spinal neuronal activity in a rat model of painful radiculopathy. San Diego, CA, USA: American Society of Regional Anesthesia and Pain Medicine (ASRA); 2016,
15. De Ridder D, Vancamp T, Falowski SM, Vanneste S. All bursts are equal, but some are more equal (to burst firing): burstDR stimulation versus Boston burst stimulation. Expert Rev Med Devices. 2020;1–7. doi:10.1080/17434440.2020.1736560
16. Falowski S. Fundamental differences in burst stimulation waveform design: eliminating confusion in the marketplace. Neuromodulation. 2018;21(3):320. doi:10.1111/ner.12762.
17. Chakravarthy K, Fishman MA, Zuidema X, et al. Mechanism of action in burst spinal cord stimulation: review and recent advances. Pain Med. 2019;20(Supplement_1):S13–S22. doi:10.1093/pm/pnz073
18. Falowski S, Sharan A. A review on spinal cord stimulation. J Neurosurg Sci. 2012;56(4):287–298.
19. Weiergraber M, Stephani U, Kohling R. Voltage-gated calcium channels in the etiopathogenesis and treatment of absence epilepsy. Brain Res Rev. 2010;62(2):245–271.
20. Deer T Efficacy of burst spinal cord stimulation microdosing in a de-novo patient. Poster presented at: NAPA Pain; 2019.
 © 2021 The Author(s). This work is published and licensed by Dove Medical Press Limited. The
full terms of this license are available at https://www.dovepress.com/terms
and incorporate the Creative Commons Attribution
- Non Commercial (unported, 3.0) License.
By accessing the work you hereby accept the Terms. Non-commercial uses of the work are permitted
without any further permission from Dove Medical Press Limited, provided the work is properly
attributed. For permission for commercial use of this work, please see paragraphs 4.2 and 5 of our Terms.
© 2021 The Author(s). This work is published and licensed by Dove Medical Press Limited. The
full terms of this license are available at https://www.dovepress.com/terms
and incorporate the Creative Commons Attribution
- Non Commercial (unported, 3.0) License.
By accessing the work you hereby accept the Terms. Non-commercial uses of the work are permitted
without any further permission from Dove Medical Press Limited, provided the work is properly
attributed. For permission for commercial use of this work, please see paragraphs 4.2 and 5 of our Terms.