Back to Journals » Cancer Management and Research » Volume 10
Progression and prognostic value of ECT2 in non-small-cell lung cancer and its correlation with PCNA
Authors Bai X, Yi M, Xia X ![]() , Yu S, Zheng X, Wu K
, Yu S, Zheng X, Wu K ![]()
Received 4 April 2018
Accepted for publication 28 June 2018
Published 28 September 2018 Volume 2018:10 Pages 4039—4050
DOI https://doi.org/10.2147/CMAR.S170033
Checked for plagiarism Yes
Review by Single anonymous peer review
Peer reviewer comments 2
Editor who approved publication: Dr Antonella D'Anneo
Xianguang Bai,1,* Ming Yi,2,* Xichao Xia,1 Shengnan Yu,2 Xinhua Zheng,1 Kongming Wu2
1Medical School of Pingdingshan University, Pingdingshan, Henan, People’s Republic of China; 2Department of Oncology, Tongji Hospital of Tongji Medical College, Huazhong University of Science and Technology, Wuhan, Hubei, People’s Republic of China
*These authors contributed equally to this work
Purpose: Epithelial cell transforming sequence 2 (ECT2) is a guanine nucleotide exchange factor, which is involved in cell division regulation and cell cycle modulation. Recent evidence indicates that ECT2 is overexpressed in many human cancers. However, the exact prognostic value of ECT2 in lung cancer has not been elucidated.
Patients and methods: In the current study, we performed correlation and prognosis analyses using public databases and conducted immunohistochemical staining in tissue microarrays, using samples from 204 lung cancer patients with survival data.
Results: We found that the expression of ECT2 was markedly increased in lung cancer tissues compared with normal tissues. Moreover, we demonstrated that the expression of ECT2 was related to tumor cell differentiation degree, TNM stage, lymph node metastasis, and prognosis in non-small-cell lung cancer (NSCLC). A correlation analysis indicated that ECT2 levels were significantly correlated with proliferating cell nuclear antigen (PCNA) levels in NSCLC. Furthermore, Kaplan–Meier analyses revealed that high ECT2 expression was associated with unfavorable overall survival (OS) and progression-free survival (PFS) in NSCLC patients.
Conclusion: Taken together, these results indicate that the overexpression of ECT2 contributes to tumor invasion and progression, suggesting that ECT2 is a potential prognostic marker for NSCLC patients.
Keywords: epithelial cell transforming sequence 2, ECT2, non-small cell lung cancer, progression, prognosis, proliferating cell nuclear antigen, PCNA
Introduction
Non-small-cell lung cancer (NSCLC) including lung adenocarcinoma (ADC), lung squamous cell carcinoma (SQC) and large cell carcinoma, is the most common pathological type of lung cancer and is one of the leading causes of cancer-related death worldwide.1 Activation of KRAS is most frequent oncogenic driver for ADC, and a recent study identified that epithelial cell transforming sequence 2 (ECT2)-dependent rRNA synthesis is required for KRAS-driven lung ADC.2 ECT2, a guanine nucleotide exchange factor (GEF), was originally reported to regulate cell division via Rho signaling pathways, and interaction between ECT2 and the plasma membrane during anaphase is required and sufficient for cytokinesis.3 Recent evidence has indicated that ECT2 is overexpressed in various human cancers and is related to tumor cell differentiation, TNM stage, lymph node metastasis, and prognosis. For example, Wang et al4 found that high expression of ECT2 predicted a poor prognosis and may play a critical role in breast cancer. Chen et al5 reported that high ECT2 expression was an independent prognostic factor for osteosarcoma and can upregulate the metastatic capacity of osteosarcoma cells. Jin et al6 found that ECT2 was significantly associated with the degree of histological differentiation, invasion depth, lymph node metastasis, distant metastasis, TNM stage and overall survival rate in gastric cancer patients. Sano et al7 reported that the expression of ECT2 was markedly increased in poorly differentiated gliomas compared with well differentiated gliomas, and a high level expression of ECT2 predicted poor survival. A mechanistic study indicated that knockdown of ECT2 can inhibit Rac1 activity and block the growth, invasion and tumorigenicity of lung ADC cells.8 In summary, ECT2 has been shown to play an important oncogenic role in many human cancers. However, the precise role of ECT2 in lung cancer progression and prognosis is not well defined. To explore the functions of ECT2, we carried out an analysis based on Kaplan–Meier plotted datasets, which indicated that patients with higher mRNA levels of ECT2 had poor overall survival (hazard ratio [HR] =1.71, 95% CI: 1.44–2.02, P<0.0001) (Figure S1 A) and progression-free survival (HR =1.42, 95% CI: 1.08–1.87, P=0.011) (Figure S1 B). Furthermore, we investigated the effect of ECT2 mRNA levels on the prognosis of ADC and SQC. We found that high ECT2 expression in ADC was an unfavorable prognostic element for overall survival (HR =1.31, 95% CI: 1.03–1.67, P=0.029) (Figure S1 C) and progression-free survival (HR =1.34, 95% CI: 0.97–1.85, P=0.076) (Figure S1 D). However high ECT2 expression could not serve as a predictor for overall survival (HR =0.99, 95% CI: 0.72–1.36, P=0.94) and progression-free survival (HR =1.42, 95% CI: 0.85–2.38, P=0.18) among the SQC population (Figure S1 E, F). In summary, these analyses indicated high ECT2 mRNA expression predicted poor survival in NSCLC. To validate the conclusion from the Kaplan–Meier plotter, we conducted a comprehensive study to investigate the relationship between ECT2 expression and clinical pathological features through a systematic mRNA expression analysis based on open database and immunohistochemical staining.
Materials and methods
Online analysis tool
Kaplan–Meier survival curves with a log-rank test were calculated and plotted using the analysis tool which is available online at: http://kmplot.com. The background database downloaded from GEO (https://www.ncbi.nlm.nih.gov/geo/) offers gene expression data, relapse-free and overall survival information. A total of 2,437 lung cancer patients were divided into two groups according to the expression levels of ECT2, and then the Kaplan–Meier survival curves were downloaded from the website and adjusted in Adobe Illustrator CS6.
Human lung cancer tissue array
Three commercial human lung cancer tissue microarrays (TMAs) were purchased, including one BC041115c (Alenabio, Xi’an, China) and two HlugA180Su05 (Outdo biobank, Shanghai, China). Patient personal information was blocked and the study protocol was approved by the Ethics Committee of the Tongji Hospital of Huazhong University of Science and Technology. BC041115c includes 10 cases of normal lung tissues, 4 cases of lung atypical carcinoid tissues, 48 cases of ADC, 40 cases of SQC, 8 cases of small cell carcinoma and 3 cases of large cell carcinoma. HlugA180Su05 includes 94 cases of ADC with 87 matched adjacent lung tissues, with survival follow-up data covering 5–10 years.
Immunohistochemical staining quantification analysis
Immunohistochemical staining was carried out with the three TMAs using a two-step standard protocol by the Bios Biotech.9,10 A polyclonal anti-ECT2 antibody (catalog no. 07–1364; Millipore Corporation, Billerica, MA, USA, 1:150) and an anti-PCNA antibody (catalog no. ab18197; Abcam, Cambridge, UK, 1:1500) were utilized for the immunohistochemistry. Immunohistochemical scoring was assessed by two experienced pathologists without clinicopathological information of the patients according to the Fromowitz Standard.11 The product of intensity and the proportion of positively stained cancer cells in each whole tissue sample was used to represent the protein levels of ECT2. The staining intensity was scored as 0 (no staining), 1 (weak staining, light yellow), 2 (moderate staining, yellow brown) and 3 (strong staining, brown). The proportions of stained tumor cells were identified as 1 (0%–25% positive cells), 2 (26%–50% positive cells), 3 (51%–75% positive cells) and 4 (76%–100% positive cells).12
Meta-analysis of the expression of ECT2 using published gene expression omnibus (GEO) databases
We carried out a comprehensive search of relevant GEO databases to assess the mRNA expression of ECT2 through ArrayExpress and Oncomine, as previously described.13,14 The dataset met the following criteria: 1) the dataset concerned human NSCLC; 2) the mRNA expression of ECT2 was measured in the dataset; 3) the clinical outcomes of patients were shown in the dataset; 4) the sample capacity was more than 50; 5) only the latest and most complete datasets were included when several databases shared common patients. A total of 21 independent NSCLC microarray databases were enrolled in this systematic analysis (Table 1). Statistical analysis was performed based on the guidelines of meta-analysis of observational studies. The Stata software package (version 12.0) was employed to perform the meta-analysis.
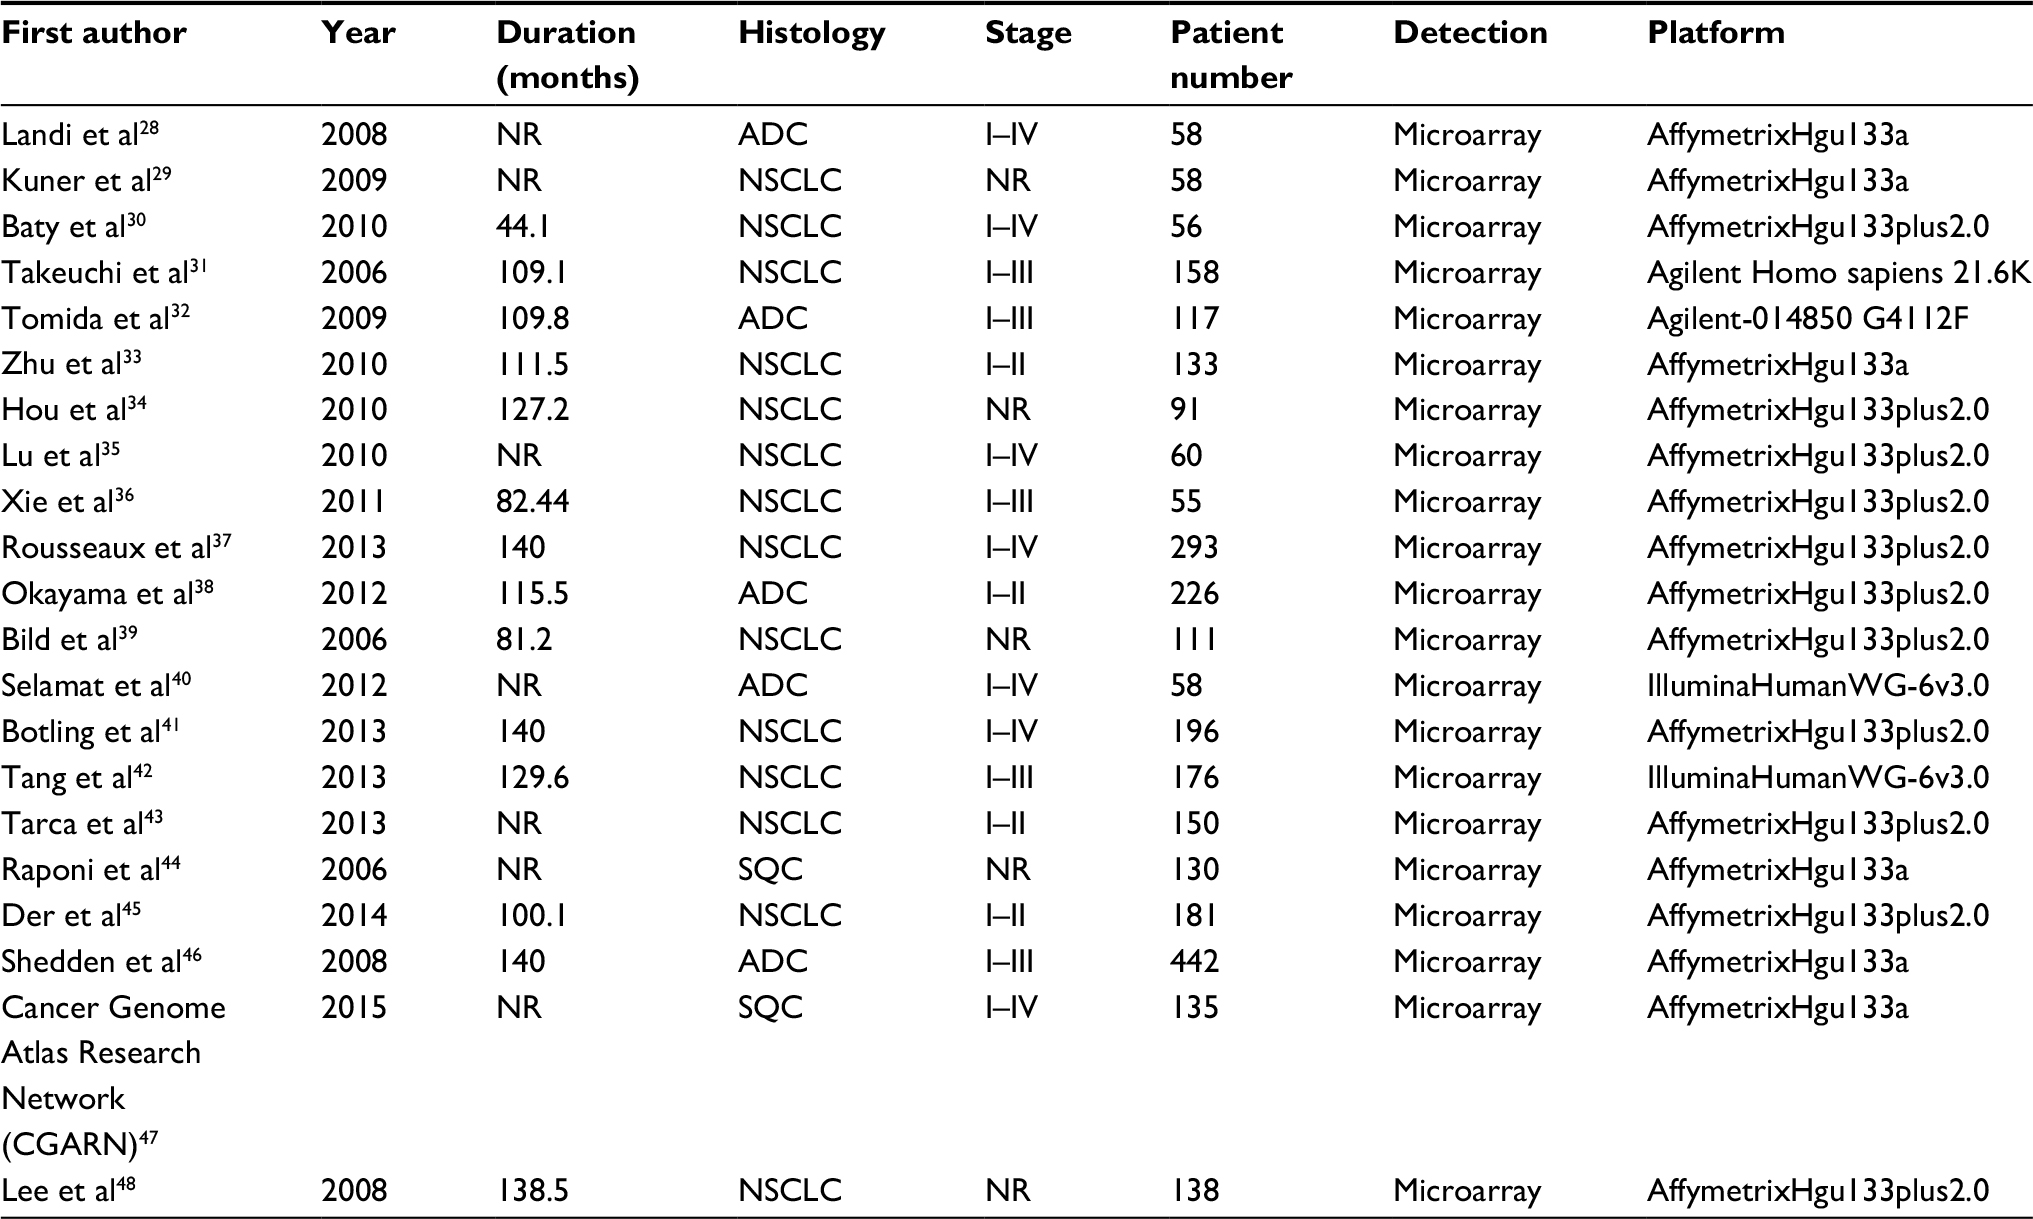 | Table 1 Microarray databases detailing the mRNA expression of ECT2 (these databases were included in the meta-analysis) Abbreviations: ECT2, epithelial cell transforming sequence 2; NSCLC, non-small-cell lung cancer; ADC, adenocarcinoma; SQC, squamous cell lung cancer; NR, not reported. |
Survival analysis based on immunohistochemical scoring
Based on the immunohistochemical scoring for 94 ADC patients, an overall survival curve was constructed using SPSS and univariate analyses were conducted through Cox regression, which yielded an HR and 95% CI. The cutoff value for ECT2 was the median expression.
The correlation analysis of ECT2 and PCNA
The immunohistochemical (IHC) scores for ECT2 and PCNA for the same tissue arrays (HlugA180Su05) were analyzed to evaluate the correlation between ECT2 and PCNA protein expression. Two public GEO databases, GSE434215 and GSE32474,16 consisting of NSCLC cell lines, and three databases, GSE31210,38 GSE6846546 and GSE30219,37 containing the highest number of NSCLC patients of the 21 databases, were analyzed to evaluate the correlation between the mRNA expression of ECT2 and PCNA.
Statistical analysis
Expression analysis and correlation analyses were calculated using GraphPad Prism 5.0 and SPSS 20 statistical software. The difference between groups was evaluated using Student’s t-test and one-way analysis of variance (ANOVA). A two-tailed P-value <0.05 was considered statistically significant.
Results
ECT2 expression was significantly increased in various subtypes of lung cancer compared with normal lung tissues
We compared ECT2 expression in several subtypes of lung cancer and normal lung tissues through IHC staining and representative images of the IHC staining are shown in Figure 1A. The average score for normal, SQC, adenosquamous carcinoma, ADC, bronchioloalveolar carcinoma, large cell carcinoma, small cell carcinoma and atypical carcinoid was 0.90±0.28, 5.43±0.46, 8.67±1.76, 4.38±0.44, 1.75±0.75, 3.33±0.33, 4.25±1.10 and 4.25±1.82, respectively (Figure 1B). The average scores for all lung cancer subtypes were 4–5 fold higher than those of normal samples, and the adenosquamous carcinoma samples exhibited the highest abundance of ECT2 compared with the other lung cancer subtypes (Figure 1B). The results also showed that ECT2 expression was higher in SQC than in ADC tissues, but the difference was not statistically significant (P=0.1029). The correlation between ECT2 protein expression in TMAs and the clinicopathological features of 202 lung cancer patients is shown in Table 2. A meta-analysis indicated that expression of ECT2 mRNA in NSCLC tissue was higher than in normal tissue (pooled odds ratio [OR] =7.87, 95% CI: 5.57–11.11, P=0.000, and I2=87.5%) (Figure 1C). Furthermore, we investigated the difference in ECT2 mRNA expression between ADC and SQC and found that the ECT2 mRNA expression of SQC was higher than that of ADC (pooled OR =4.16, 95% CI: 3.26–5.30, P=0.000, and I2=84.9%) (Figure 1D).
 | Figure 1 ECT2 was enriched in various subtypes of lung cancer. Notes: (A) Representative images of IHC staining of normal, squamous cell carcinoma, adenosquamous carcinoma, adenocarcinoma, bronchioloalveolar carcinoma, large cell carcinoma, small cell carcinoma, and atypical carcinoid; (B) quantitative IHC scores of ECT2 in various lung cancer subtypes; (C) meta-analysis of ECT2 mRNA expression in tumors vs normal; (D) meta-analysis of ECT2 mRNA expression in SQC vs ADC. Abbreviations: ECT2, epithelial cell transforming sequence 2; IHC, immunohistochemical; T, tumor; N, normal; OR, odds ratio; ADC, adenocarcinoma; SQC, squamous cell lung cancer. |
 | Table 2 Correlation between ECT2 expression and the clinicopathological features of 202 lung cancer patients on TMAs (BC041115c and HlugA180Su05) Notes: aPearson chi-squared test; bContinuity correction chi-squared test; N–, lymph node negative; N+, lymph node positive. Abbreviations: ECT2, epithelial cell transforming sequence 2; TMAs, tissue microarrays. |
The expression level of ECT2 was associated with cancer progression and prognosis in NSCLC
Based on the immunohistochemical scoring of the HlugA180Su05 and BC041115c tissue microarrays, we found the immunohistochemical scores of tumor tissues were significantly higher than those of matched adjacent tissues (P<0.0001) (Figure 2A). Moreover, we compared the protein level of ECT2 in lung cancer tissues with clinical-pathological parameters. The protein level of ECT2 in lung cancer was significantly and positively correlated with clinicopathological parameters including TNM stage, tumor cell differentiation, tumor size, and lymph node metastasis (Figure 2B–E). We also used a meta-analysis to examine the relationship between the mRNA level of ECT2 and clinical-pathological characteristics. The patients were divided into ECT2 high and low subgroups based on the median ECT2 mRNA expression values. The level of ECT2 mRNA expression in patients with stage III and IV NSCLC was higher than in patients with stage I and II NSCLC (pooled OR =2.17, 95% CI: 1.69–2.79, P=0.117, and I2=36.4%) (Figure 3A). Meanwhile, the level of ECT2 mRNA expression in ADC patients showed a similar trend and the patients with stage III and IV was higher than patients with stage I and II (pooled OR =1.83, 95% CI: 1.32–2.54, P=0.899, and I2=0.0%) (Figure 3B). The ECT2 mRNA expression in stage III and IV NSCLC was higher compared with stage I and II NSCLC in SQC, but the difference was not statistically significant (pooled OR =1.32, 95% CI: 0.78–2.25, P=0.429, and I2=0.0%) (Figure 3C). The ECT2 mRNA expression of T3 and T4 was higher compared with T1 and T2 in NSCLC (pooled OR =2.27, 95% CI: 1.62–3.20, P=0.023, and I2=61.7%) (Figure 3D). The ECT2 mRNA expression of lymph node-positive patients was higher than that of lymph node-negative patients in NSCLC (pooled OR =1.45, 95% CI: 1.12–1.89, P=0.939, and I2=0.0%) (Figure 3E). Because the clusters with histological differentiation information were poor, we used GSE68465 to test the ECT2 mRNA expression in patients with different degrees of cell differentiation. The results showed that the ECT2 mRNA expression of the poorly differentiated group was remarkably higher than that in the well differentiated group (P<0.0001) and that of the moderately differentiated group was also higher than that of the well differentiated group (P=0.0001) (Figure 3F). In summary, the protein and mRNA expression of ECT2 were correlated with clinical-pathological characteristics in NSCLC.
 | Figure 2 Protein level of ECT2 was associated with cancer progression and prognosis. Notes: (A) Representative images and IHC scores of ECT2 in tumor vs matched adjacent tissue; (B) various stages; (C) various degrees of tumor cell differentiation; (D) various tumor sizes; (E) lymph node positive vs lymph node negative. N−, lymph node negative; N+, lymph node positive. Abbreviations: ECT2, epithelial cell transforming sequence 2; IHC, immunohistochemical. |
 | Figure 3 mRNA level of ECT2 was associated with cancer progression and prognosis. Notes: (A) Meta-analysis of ECT2 mRNA expression at stage III + IV vs I + II; (B) stage III + IV vs I + II in ADC; (C) stage III + IV vs I + II in SQC; (D) tumor size T3 + T4 vs. T1 + T2; (E) lymph node positive vs lymph node negative; (F) the mRNA expression of ECT2 at different degrees of tumor cell differentiation in GSE68465. N−, lymph node negative; N+, lymph node positive. Abbreviations: ECT2, epithelial cell transforming sequence 2; IHC, immunohistochemical staining; CGARN, Cancer Genome Atlas Research Network; OR, odds ratio; ADC, adenocarcinoma; SQC, squamous cell lung cancer. |
High ECT2 expression predicted poor survival in NSCLC
To evaluate the prognostic value of ECT2 in NSCLC, we first investigated the association between ECT2 protein expression and overall survival using a Cox univariate regression analysis. A TMA consisting of 94 ADC patients was divided into ECT2 high and low subgroups following the immunohistochemical staining score of 3–4 vs 1–2. The median overall survival (OS) time of the ECT2 high group was 29±5.561 months, while that of the low group was 56±3.548 months (P=0.006) (Figure 4A). A Cox univariate regression analysis between the cumulative overall survival rates and clinicopathological factors demonstrated that ECT2 expression (HR =2.010, 95% CI: 1.204–3.355, P=0.008), lymph node metastasis (HR =2.672, 95% CI: 1.541–4.633, P=0.000) and TNM stage (HR =2.658, 95% CI: 1.483–4.765, P=0.001) were prognostic factors for overall survival in ADC patients. We performed a forward variable-selection procedure and found the ECT2 expression was a statistically significant independent prognostic factor for the OS of ADC patients (HR =0.406, 95% CI: 0.226–0.727, P=0.002) (Table 3).
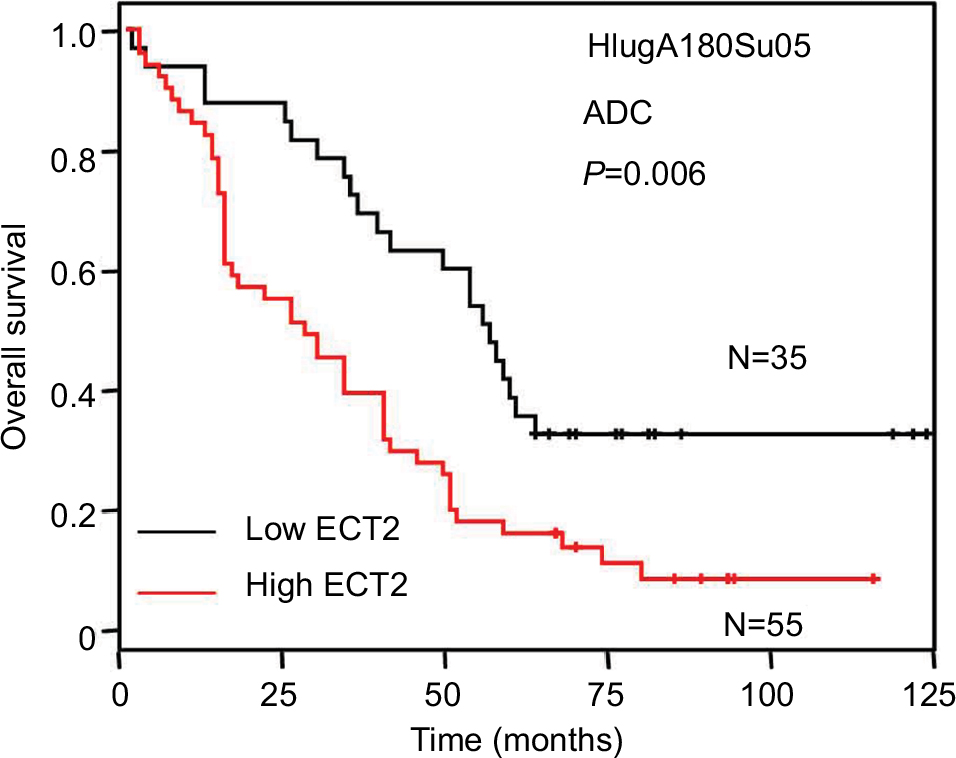 | Figure 4 Overexpression of ECT2 protein predicted poor survival. Notes: Kaplan–Meier curve of patients with low or high ECT2 expression in ADC. Median level of IHC scores was used to divide patients into subgroups; Abbreviations: ECT2, epithelial cell transforming sequence 2; HR, hazard ratio; ADC, adenocarcinoma; IHC, immunohistochemical staining. |
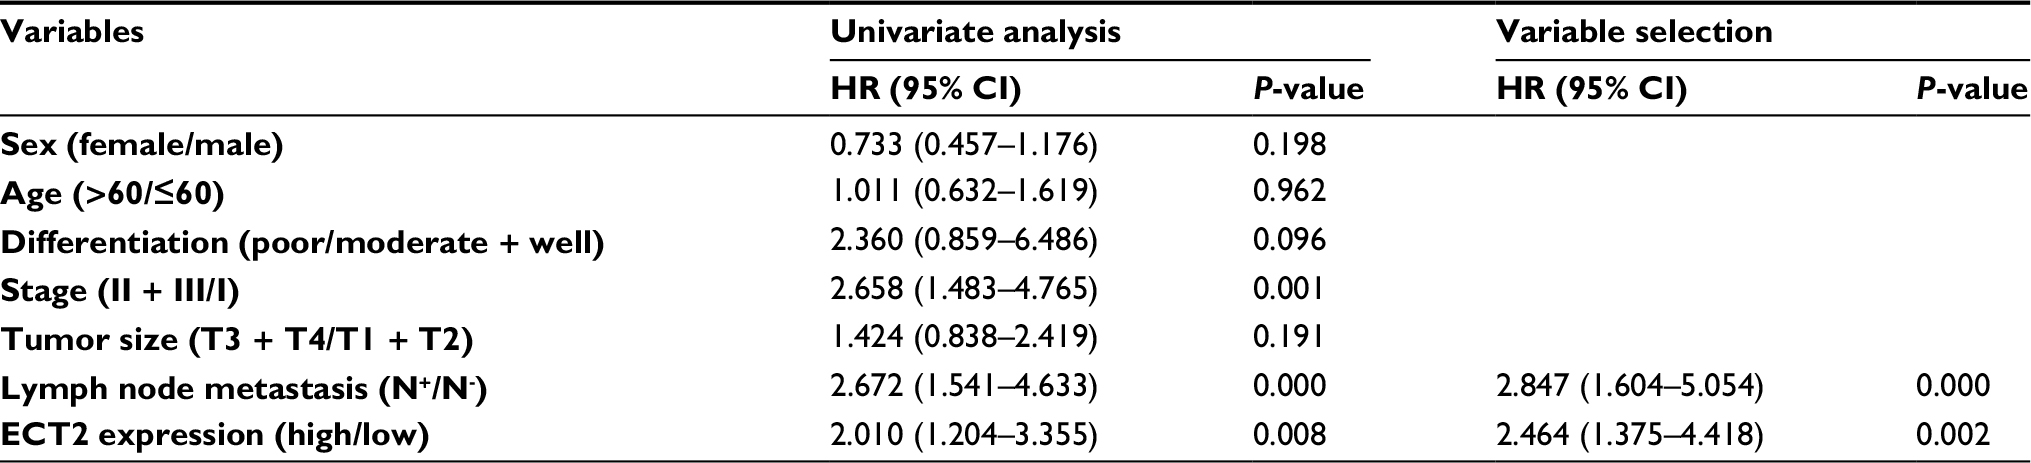 | Table 3 ECT2 expression in ADC is an independent prognostic factor for ADC patients (HlugA180Su05) Notes: N−, lymph node negative; N+, lymph node positive. Abbreviations: ECT2, epithelial cell transforming sequence 2; ADC, adenocarcinoma; HR, hazard ratio. |
ECT2 expression was correlated with that of PCNA
Based on the immunohistochemical scoring for PCNA, we found that the protein levels of PCNA in ADC were significantly higher than those in matched adjacent normal lung tissue (P<0.0001), and they were positively correlated with clinicopathological parameters including TNM stage, tumor cell differentiation, tumor size, and metastasis (Figure 5A, C). An immunohistochemical analysis of PCNA and ECT2 for the same tissue microarray (HlugA180Su05) showed that ECT2 protein expression was positively correlated with that of PCNA (R=0.624, P=0.000) (Figure 5B, D). Public datasets GSE4342, GSE32474, GSE31210, GSE68465 and GSE30219 containing 45 NSCLC cell lines, 26 NSCLC cell lines, 226 patients, 442 patients and 293 patients, respectively, were interrogated to assess the association between ECT2 and PCNA. The results showed that ECT2 mRNA expression was positively correlated with that of PCNA in GSE4342 (R=0.307, P=0.003) (Figure 5E), GSE32474 (R=0.539, P=0.005) (Figure 5F), GSE31210 (R=0.601, P=0.000) (Figure 5G), GSE68465 (R=0.536, P=0.000) (Figure 5H) and GSE30219 (R=0.612, P=0.000) (Figure 5I).
 | Figure 5 ECT2 expression correlated with PCNA expression. Notes: (A) Representative images of IHC staining of PCNA; (B) representative images of IHC staining of PCNA and ECT2 in the same lung cancer tissues; (C) IHC scores of PCNA in lung cancer; (D) the correlation between ECT2 and PCNA based on protein expression; (E) based on the mRNA level of the GSE4342 cell line; (F) GSE32474 cell line; (G) GSE31210 cell line; (H) GSE68465 cell line; (I) GSE30219 cell line. N-, lymph node negative; N+, lymph node positive. Abbreviations: IHC, immunohistochemical staining; PCNA, proliferating cell nuclear antigen; ECT2, epithelial cell transforming sequence 2; HR, hazard ratio; ADC, adenocarcinoma; SQC, squamous cell lung cancer. |
Discussion
Recent targeted therapies of driver genes have achieved surprising outcomes in lung cancer.17 However, only a small fraction of patients can benefit from precision medicine. Searching for new biomarkers is still a key subject for lung cancer research. Besides the well-characterized oncogenes RAS, epidermal growth factor receptor (EGFR), and MET, and the tumor suppressor gene p53, several novel genes or pathways have been identified as being involved in the malignant behavior of lung cancer and its prognosis, such as dachshund family transcription factor 1 (DACH1)-SIX homeobox 1 (SIX1) and kelch like ECH associated protein 1 (KEAP1) /nuclear factor, erythroid 2 like 2 (NRF2) signals.18–23 With the identification of more driving genes and biomarkers, precise treatment options for individual patients based on the distinction of morphological and molecular features is expected.
ECT2 is a guanine nucleotide exchange factor for the Rho family of GTPases (Rho, Cdc42 and Rac), and was originally identified as a gene that can transform mouse fibroblasts.24 ECT2 is an important link between the cell cycle machinery and Rho signaling pathways involved in the regulation of cell division, and the exchange function relies on its phosphorylation during G2 and M phases.3 Our data show that ECT2 expression in various lung cancer subtypes is significantly higher than that in normal tissues and its expression was associated with TNM stage, tumor cell differentiation, tumor size and metastasis, indicating that ECT2 plays an important role in the initiation and progression of lung cancer. We also investigated the relationship between ECT2 protein and mRNA expression and survival. A multivariate Cox regression analysis demonstrated that ECT2 overexpression in ADC was an independent prognostic factor. The current study revealed that ECT2 was a key factor in the progression of NSCLC and predicted poor prognosis. The high expression of ECT2 was related to the proliferation, survival and invasion of lung cancer cells, which contributed to the prognosis of NSCLC. These results are in agreement with those of prior studies of the role of ECT2 in breast cancer, osteosarcoma, gastric cancer and glioma.4–7
We also examined the expression of PCNA in ADC and found that it was positively correlated with clinicopathological parameters including TNM stage, tumor cell differentiation, tumor size, and metastasis, supporting the previous study showing that PCNA is expressed in proliferating cells, and is an important factor for the initiation of cell proliferation.25,26 Until now, no studies have reported a correlation between ECT2 and PCNA. In the current study, we demonstrated the ECT2 expression is positively correlated with PCNA expression in ADC at both the protein and mRNA level, suggesting that ECT2 is an important factor in the regulation of NSCLC cell division. The expression level of ECT2 may be a useful biomarker to predict proliferation and aggression in NSCLC. Moreover, high ECT2 expression predicts a shorter survival time, indicating that ECT2 expression may serve as a prognostic marker for NSCLC patients.
As a common GEF for the Rho GTPase family, ECT2 can catalyze guanine nucleotide exchange on RhoA, Rac1, and Cdc42 in vitro.3,27 Therefore, gene therapy to abolish ECT2 activity may restrain the Rac1/RhoA/Cdc42 signaling pathways, which may provide an effective approach to block Rho GTPase activity and reverse a malignant phenotype.
One interesting finding is that ECT2 expression in SQC is higher than that in ADC, but ECT2 levels did not significantly affect the OS of SQC cancer patients, suggesting that ECT2 may play a different function in ADC compared with SQC. Therefore, further study of the molecular mechanism of ECT2 in ADC and SQC should provide valuable information. In addition, immunohistochemical staining of lung tissue specimens indicated that ECT2 is expressed both in the cytoplasm and nucleus of lung cancer cells, while ECT2 is only weakly expressed in the nucleus of healthy lung tissue, which supports previous findings that ECT2 is mislocalized to the cytoplasm to activate Rac1 for transformed growth.8 Therefore exploring the transport of the ECT2 protein from the nucleus to the cytoplasm and blocking the translocation process of ECT2 may have potential therapeutic value.
Conclusion
This study demonstrated that ECT2 expression in various lung cancer subtypes is significantly higher than in normal tissues and its expression was positively related to TNM stage, tumor cell differentiation, tumor size, and metastasis in NSCLC. In the current study, we have reported for the first time that the expression of ECT2 is positively correlated with that of PCNA in lung cancer at the protein and mRNA level. ECT2 overexpression is an unfavorable prognostic factor predicting poor disease-free survival and overall survival for NSCLC patients, especially in ADC, and may serve as a potential prognostic indicator and biomarker for NSCLC patients.
Acknowledgments
This study was supported by the National Natural Science Foundation of China (grant No. 81572608, 81172422, and 81874120) and the Wuhan Science and Technology Bureau (grant No. 2017060201010170).
Author contributions
XB carried out the experiments and drafted the manuscript. MY, SY and XX participated in data collection, analysis and IHC scoring; XZ and KW designed the study, evaluated the results, and revised the manuscript. All authors contributed toward data analysis, drafting and critically revising the paper and agree to be accountable for all aspects of the work.
Disclosure
The authors report no conflicts of interest in this work.
References
Siegel RL, Miller KD, Jemal A. Cancer statistics, 2017. CA Cancer J Clin. 2017;67(1):7–30. | ||
Justilien V, Ali SA, Jamieson L, et al. Ect2-dependent rRNA synthesis is required for KRAS-TRP53-driven lung adenocarcinoma. Cancer Cell. 2017;31(2):256–269. | ||
Tatsumoto T, Xie X, Blumenthal R, Okamoto I, Miki T. Human ECT2 is an exchange factor for Rho GTPases, phosphorylated in G2/M phases, and involved in cytokinesis. J Cell Biol. 1999;147(5):921–928. | ||
Wang HK, Liang JF, Zheng HX, Xiao H. Expression and prognostic significance of ECT2 in invasive breast cancer. J Clin Pathol. 2018;71(5):442-445. | ||
Chen Z, Liu J, Zhang Y. Role of epithelial cell transforming sequence 2 (ECT2) in predicting prognosis of osteosarcoma. Med Sci Monit. 2017;23:3861–3868. | ||
Jin Y, Yu Y, Shao Q, et al. Up-regulation of ECT2 is associated with poor prognosis in gastric cancer patients. Int J Clin Exp Pathol. 2014;7(12):8724–8731. | ||
Sano M, Genkai N, Yajima N, et al. Expression level of ECT2 proto-oncogene correlates with prognosis in glioma patients. Oncol Rep. 2006;16(5):1093–1098. | ||
Justilien V, Fields AP. Ect2 links the PKCiota-Par6alpha complex to Rac1 activation and cellular transformation. Oncogene. 2009;28(41):3597–3607. | ||
Xu H, Wu K, Tian Y, et al. CD44 correlates with clinicopathological characteristics and is upregulated by EGFR in breast cancer. Int J Oncol. 2016;49(4):1343–1350. | ||
Chu Q, Han N, Yuan X, et al. DACH1 inhibits cyclin D1 expression, cellular proliferation and tumor growth of renal cancer cells. J Hematol Oncol. 2014;7:73. | ||
Fromowitz FB, Viola MV, Chao S, et al. ras p21 expression in the progression of breast cancer. Hum Pathol. 1987;18(12):1268–1275. | ||
Wu K, Yu S, Liu Q, Bai X, Zheng X, Wu K. The clinical significance of CXCL5 in non-small cell lung cancer. Onco Targets Ther. 2017;10:5561–5573. | ||
Xu HX, Wu KJ, Tian YJ, Hx X, Kj W, et al. Expression profile of SIX family members correlates with clinic-pathological features and prognosis of breast cancer: a systematic review and meta-analysis. Medicine. 2016;95(27):e4085. | ||
Liu Q, Li A, Tian Y, et al. The expression profile and clinic significance of the SIX family in non-small cell lung cancer. J Hematol Oncol. 2016;9(1):119. | ||
Coldren CD, Helfrich BA, Witta SE, et al. Baseline gene expression predicts sensitivity to gefitinib in non-small cell lung cancer cell lines. Mol Cancer Res. 2006;4(8):521–528. | ||
Pfister TD, Reinhold WC, Agama K, et al. Topoisomerase I levels in the NCI-60 cancer cell line panel determined by validated ELISA and microarray analysis and correlation with indenoisoquinoline sensitivity. Mol Cancer Ther. 2009;8(7):1878–1884. | ||
Politi K, Herbst RS. Lung cancer in the era of precision medicine. Clin Cancer Res. 2015;21(10):2213–2220. | ||
Liu Q, Yu S, Zhao W, Qin S, Chu Q, Wu K. EGFR-TKIs resistance via EGFR-independent signaling pathways. Mol Cancer. 2018;17(1):53. | ||
Govindan R, Ding L, Griffith M, et al. Genomic landscape of non-small cell lung cancer in smokers and never-smokers. Cell. 2012; 150(6):1121–1134. | ||
Liu Q, Li A, Yu S, Tian Y, et al. DACH1 antagonizes CXCL8 to repress tumorigenesis of lung adenocarcinoma and improve prognosis. J Hematol Oncol. 2018;11(1):53. | ||
Mimae T, Okada M, Hagiyama M, et al. Upregulation of notch2 and six1 is associated with progression of early-stage lung adenocarcinoma and a more aggressive phenotype at advanced stages. Clin Cancer Res. 2012;18(4):945–955. | ||
Romero R, Sayin VI, Davidson SM, et al. Keap1 loss promotes Kras-driven lung cancer and results in dependence on glutaminolysis. Nat Med. 2017;23(11):1362–1368. | ||
Tian Y, Liu Q, He X, et al. Emerging roles of Nrf2 signal in non-small cell lung cancer. J Hematol Oncol. 2016;9:14. | ||
Miki T, Smith CL, Long JE, Eva A, Fleming TP. Oncogene ect2 is related to regulators of small GTP-binding proteins. Nature. 1993; 362(6419):462–465. | ||
Guo JL, Gu SQ, Li Y, Zhang XY. Evaluation of clinical significance of endoglin expression during breast cancer and its correlation with ER and PCNA. Eur Rev Med Pharmacol Sci. 2017;21(23):5402–5407. | ||
Malkas LH, Herbert BS, Abdel-Aziz W, et al. A cancer-associated PCNA expressed in breast cancer has implications as a potential biomarker. Proc Natl Acad Sci U S A. 2006;103(51):19472–19477. | ||
Mansour M, Haupt S, Chan AL, et al. The E3-ligase E6AP represses breast cancer metastasis via regulation of ECT2-rho signaling. Cancer Res. 2016;76(14):4236–4248. | ||
Landi MT, Dracheva T, Rotunno M, et al. Gene expression signature of cigarette smoking and its role in lung adenocarcinoma development and survival. PLoS One. 2008;3(2):e1651. | ||
Kuner R, Muley T, Meister M, et al. Global gene expression analysis reveals specific patterns of cell junctions in non-small cell lung cancer subtypes. Lung Cancer. 2009;63(1):32–38. | ||
Baty F, Facompré M, Kaiser S, et al. Gene profiling of clinical routine biopsies and prediction of survival in non-small cell lung cancer. Am J Respir Crit Care Med. 2010;181(2):181–188. | ||
Takeuchi T, Minami Y, Iijima T, et al. Characteristics of loss of heterozygosity in large cell neuroendocrine carcinomas of the lung and small cell lung carcinomas. Pathol Int. 2006;56(8):434–439. | ||
Tomida S, Takeuchi T, Shimada Y, et al. Relapse-related molecular signature in lung adenocarcinomas identifies patients with dismal prognosis. J Clin Oncol. 2009;27(17):2793–2799. | ||
Zhu CQ, Ding K, Strumpf D, et al. Prognostic and predictive gene signature for adjuvant chemotherapy in resected non-small-cell lung cancer. J Clin Oncol. 2010;28(29):4417–4424. | ||
Hou J, Aerts J, den Hamer B, et al. Gene expression-based classification of non-small cell lung carcinomas and survival prediction. PLoS One. 2010;5(4):e10312. | ||
Lu TP, Tsai MH, Lee JM, et al. Identification of a novel biomarker, SEMA5A, for non-small cell lung carcinoma in nonsmoking women. Cancer Epidemiol Biomarkers Prev. 2010;19(10):2590–2597. | ||
Xie Y, Xiao G, Coombes KR, et al. Robust gene expression signature from formalin-fixed paraffin-embedded samples predicts prognosis of non-small-cell lung cancer patients. Clin Cancer Res. 2011;17(17):5705–5714. | ||
Rousseaux S, Debernardi A, Jacquiau B, et al. Ectopic activation of germline and placental genes identifies aggressive metastasis-prone lung cancers. Sci Transl Med. 2013;5186(186):ra166. | ||
Okayama H, Kohno T, Ishii Y, et al. Identification of genes upregulated in ALK-positive and EGFR/KRAS/ALK-negative lung adenocarcinomas. Cancer Res. 2012;72(1):100–111. | ||
Bild AH, Yao G, Chang JT, et al. Oncogenic pathway signatures in human cancers as a guide to targeted therapies. Nature. 2006;439(7074):353–357. | ||
Selamat SA, Chung BS, Girard L, et al. Genome-scale analysis of DNA methylation in lung adenocarcinoma and integration with mRNA expression. Genome Res. 2012;22(7):1197–1211. | ||
Botling J, Edlund K, Lohr M, et al. Biomarker discovery in non-small cell lung cancer: integrating gene expression profiling, meta-analysis, and tissue microarray validation. Clin Cancer Res. 2013;19(1):194–204. | ||
Tang H, Xiao G, Behrens C, et al. A 12-gene set predicts survival benefits from adjuvant chemotherapy in non-small cell lung cancer patients. Clin Cancer Res. 2013;19(6):1577–1586. | ||
Tarca AL, Lauria M, Unger M, et al. Strengths and limitations of microarray-based phenotype prediction: lessons learned from the IMPROVER Diagnostic Signature Challenge. Bioinformatics. 2013;29(22):2892–2899. | ||
Raponi M, Zhang Y, Yu J, et al. Gene expression signatures for predicting prognosis of squamous cell and adenocarcinomas of the lung. Cancer Res. 2006;66(15):7466–7472. | ||
Der SD, Sykes J, Pintilie M, et al. Validation of a histology-independent prognostic gene signature for early-stage, non-small-cell lung cancer including stage IA patients. J Thorac Oncol. 2014;9(1):59–64. | ||
Director’s Challenge Consortium for the Molecular Classification of Lung Adenocarcinoma, Shedden K, Taylor JM, et al. Gene expression-based survival prediction in lung adenocarcinoma: a multi-site, blinded validation study. Nat Med. 2008;14(8):822–827. | ||
Cancer Genome Atlas Research Network. Comprehensive genomic characterization of squamous cell lung cancers. Nature. 2012;489(7417):519–525. | ||
Lee ES, Son DS, Kim SH, et al. Prediction of recurrence-free survival in postoperative non-small cell lung cancer patients by using an integrated model of clinical information and gene expression. Clin Cancer Res. 2008;14(22):7397–7404. |
Supplementary materials
 | Figure S1 Overexpression of ECT2 mRNA predicted poor survival. Notes: Kaplan–Meier curve of patients with low or high ECT2 expression. Median of mRNA expression was used to divide patients into subgroups. (A) Overall survival; (B) progression-free survival; (C) overall survival in ADC; (D) progression-free survival in ADC; (E) overall survival in SQC; (F) progression-free survival in SQC. Abbreviations: ECT2, epithelial cell transforming sequence; HR, hazard ratio; ADC, adenocarcinoma; SQC, squamous cell lung cancer. |
 © 2018 The Author(s). This work is published and licensed by Dove Medical Press Limited. The
full terms of this license are available at https://www.dovepress.com/terms
and incorporate the Creative Commons Attribution
- Non Commercial (unported, 3.0) License.
By accessing the work you hereby accept the Terms. Non-commercial uses of the work are permitted
without any further permission from Dove Medical Press Limited, provided the work is properly
attributed. For permission for commercial use of this work, please see paragraphs 4.2 and 5 of our Terms.
© 2018 The Author(s). This work is published and licensed by Dove Medical Press Limited. The
full terms of this license are available at https://www.dovepress.com/terms
and incorporate the Creative Commons Attribution
- Non Commercial (unported, 3.0) License.
By accessing the work you hereby accept the Terms. Non-commercial uses of the work are permitted
without any further permission from Dove Medical Press Limited, provided the work is properly
attributed. For permission for commercial use of this work, please see paragraphs 4.2 and 5 of our Terms.