Back to Journals » Cancer Management and Research » Volume 11
Programmed cell death 1 expression and Epstein-Barr virus infection in chronic lymphocytic leukaemia: a prospective cohort study
Authors Grywalska E ![]() , Pasiarski M, Sosnowska-Pasiarska B, Macek P, Rolińska A, Samardakiewicz M, Ludian J, Góźdź S, Roliński J
, Pasiarski M, Sosnowska-Pasiarska B, Macek P, Rolińska A, Samardakiewicz M, Ludian J, Góźdź S, Roliński J
Received 13 April 2019
Accepted for publication 4 July 2019
Published 12 August 2019 Volume 2019:11 Pages 7605—7618
DOI https://doi.org/10.2147/CMAR.S212069
Checked for plagiarism Yes
Review by Single anonymous peer review
Peer reviewer comments 2
Editor who approved publication: Dr Eileen O'Reilly
Ewelina Grywalska,1 Marcin Pasiarski,2,3 Barbara Sosnowska-Pasiarska,4 Paweł Macek,5 Agnieszka Rolińska,6 Marzena Samardakiewicz,6 Jarosław Ludian,1 Stanisław Góźdź,3,7 Jacek Roliński1
1Department of Clinical Immunology and Immunotherapy, Medical University of Lublin, Lublin, Poland; 2Department of Hematology, Holy Cross Oncology Center of Kielce, Kielce, Poland; 3Faculty of Health Sciences, Jan Kochanowski University, Kielce, Poland; 4Department of Oncocardiology, Holy Cross Oncology Center of Kielce, Kielce, Poland; 5Department of Cancer Epidemiology and Cancer Control, Holy Cross Oncology Center of Kielce, Kielce, Poland; 6Department of Applied Psychology, Medical University of Lublin, Lublin, Poland; 7Department of Oncology, Holy Cross Oncology Center of Kielce, Kielce, Poland
Purpose: Infection with Epstein-Bar virus (EBV) is associated with an unfavourable prognosis in chronic lymphocytic leukaemia (CLL), but the underlying mechanisms remain unknown. We aimed to establish whether EBV worsens the course of CLL by up-regulating the programmed cell death 1 expression.
Patients and methods: Using polymerase chain reaction, we measured EBV DNA in the blood of 110 newly diagnosed, treatment-naïve patients with CLL. We used flow cytometry to measure the expression of programmed cell death protein 1 (PD-1) and programmed cell death protein 1 ligand (PD-L1) on CD4+, CD8+, and CD19+ cells. Additionally, PD-1 and PD-L1 serum concentrations were measured using enzyme-linked immunosorbent assays. We related the expressions of PD-1 and PD-L1 to EBV DNA load and clinical outcomes.
Results: Fifty-nine (54%) patients had detectable EBV DNA [EBV(+)], and these patients had more advanced disease at baseline than the rest. PD-1 and PD-L1 serum concentrations and their expressions on all cell populations were higher in EBV(+) than EBV(-) patients. EBV load correlated positively with unfavourable clinical markers of CLL and the expression of PD-1 and PD-L1 on CD4+ and CD8+ cells (rho =0.42–0.75; p<0.001). EBV(+) patients had increased risks of treatment initiation and lymphocyte doubling during a median follow-up period of 32 months (p<0.001). Among EBV(+), but not EBV(-), patients, higher expressions of PD-1 and PD-L1 on CD4+ and CD8+ cells were associated with higher risks of treatment initiation and lymphocyte doubling (p≤0.020).
Conclusion: EBV-induced up-regulation of PD-1-PD-L1 expression is associated with worse outcomes in CLL.
Keywords: chronic lymphocytic leukaemia, Epstein-Barr virus, programmed cell death protein 1, programmed cell death protein 1 ligand
Introduction
Chronic lymphocytic leukaemia (CLL) is the most common leukaemia in adults, accounting for about 20–30% of all leukaemia cases in western countries.1 CLL is characterized by uncontrolled proliferation of mature B-cells in the peripheral blood, lymph nodes, liver, spleen, and bone marrow, which causes symptoms such as lymphocytosis, lymphadenopathy, hepato-splenomegaly, and cytopenias.2 The clinical course of CLL is variable, with some patients surviving for decades and others for several months.3 Clinical stage and some molecular factors, like deletion 17p and CD38 or ZAP70 expression by leukaemia cells, are associated with the course of CLL;4 however, other factors are likely implicated.
The Epstein-Barr virus (EBV), which infects over 90% of people, can transform B-cells into cancer cells.5,6 People with a history of EBV infection (mononucleosis) are more likely to develop CLL,7 and patients with CLL who are infected with EBV have a greater risk of progressing into diffuse large B-cell lymphoma (Richter’s transformation).8 Moreover, in patients with CLL, our group showed that the presence of EBV DNA in the blood was associated with a shorter time to treatment initiation and a greater disease burden.9 We do not know, however, how EBV worsens the course of CLL.
Chronic viral infections may cause T-cell exhaustion and thus an impaired immune response towards cancer cells and EBV infection may have similar effects.10 Indeed, previous studies found that B-cell lymphomas associated with EBV express programmed cell death 1 ligand 1 (PD-L1), which, by binding to the inhibitory programmed cell death protein 1 (PD-1), inhibits T-cell-mediated cytotoxicity.11,12 Similarly, the immune cells of patients with CLL display exhaustion, with an increased expression of immune inhibitory molecules, including PD-1 and PD-L1.13–16 It remains unknown, however, whether the exhaustion of immune cells in CLL is related to EBV infection. We aimed to establish whether EBV worsens the course of CLL by up-regulating the programmed cell death 1 expresison. Thus, we measured the expression of PD-1 and PD-L1 on immune cells in patients with CLL, and we related the expression of these proteins to clinical outcomes and indicators of EBV infection.
Materials and methods
Patients
We included 110 treatment-naïve, newly diagnosed, consecutive patients with CLL (62 men and 48 women) and 20 healthy volunteers (11 men and 9 women) matched for sex and age, who served as a control group. CLL was diagnosed according to the criteria of the National Cancer Institute.17 None of the patients received immunomodulatory treatment, had signs of infection ≤2 months before enrolment, had undergone blood transfusion, or had autoimmune or allergic diseases. The median follow-up was 32 months (range: 10.5–74 months). The study was approved by the Ethics Committee of the Medical University of Lublin (KE-0254/227/2010), and written informed consent was obtained from all participants. This study was conducted in accordance with the Declaration of Helsinki
Preparation of material
We collected 15 mL of peripheral blood in EDTA-coated tubes and an additional 10 mL in tubes with a clot activator (Sarstedt, Nümbrecht, Germany). Blood from the EDTA-coated tubes was used to isolate peripheral blood mononuclear cells (PBMCs) by density gradient centrifugation. Briefly, we layered 5 mL of whole blood diluted with 5 mL of normal saline on 5 mL of Ficoll-Paque™ (Milteny Biotec, Bergisch-Gladbach, Germany) in 15 mm tubes. The tubes were centrifuged at 400 g for 30 mins without brake. PBMCs were removed from buffy coats with a Pasteur pipette. PBMCs were counted and assayed for viability with trypan blue (0.4% trypan blue solution; Sigma Aldrich, Hamburg, Germany). Only PBMCs with a viability ≥95% were used. Serum from the tubes with a clot activator was frozen and stored at −80 °C until used.
Immunophenotyping
Immunophenotyping was carried out using whole blood after erythrocyte lysis . Blood samples were incubated in the dark at room temperature for 20 min with monoclonal antibodies labelled with fluorescein isothiocyanate (FITC), phycoerythrin (PE), or CyChrome (PE-Cy5). We stained the blood cells using antibodies (BD Biosciences, San Jose, USA), against the following antigens: CD3 (FITC, PE, PE-Cy5) CD4 (FITC, PE-Cy5), CD8 (FITC, PE-Cy5), CD19 (FITC, PE, PE-Cy5), PD-1 (PE), and PD-L1 (PE). CD19+ cells were stained using antibodies against CD38 and ZAP-70 as described by Hus et al.18 The cut-off for CD38 positivity was ≥30%, and the cut-off for ZAP-70 positivity was ≥20%. After incubation, the cells were washed and analysed by flow cytometry (BD FACSCalibur, San Jose, USA). For all measurements, 20,000 events were acquired and analysed with the CellQuest Pro software. Isotype-matched antibodies were used to verify staining specificity and separate cell populations. We analysed the percentages of cells expressing different surface markers. Figure S1 shows the flow cytometric analysis of the expression of PD-1 and PD-L1.
Leukaemia cell genotyping
Leukaemia cells were genotyped with interphase fluorescence in situ hybridization (I-FISH). In short, PBMCs were cultured for 24 hrs in RPMI 1640 without mitogen stimulation. After hypotonic treatment and methanol-acetic acid 3:1 fixation, cell suspensions were dropped onto microscope slides and used directly for I-FISH. We used commercially available probes: Vysis LSI ATM SpectrumOrange, CEP 11 SpectrumGreen Probe, LSI TP53 SpectrumOrange, and CEP 17 SpectrumGreen (Abbott Molecular Europe, Wiesbaden, Germany). At least 200 nuclei were analysed per probe. The cut-off for positive values for normal controls was 2.5% (mean ± SD).
DNA isolation and calculation of EBV load
We isolated DNA from 5×10⁶ PBMCs with the QIAamp DNA Blood Mini Kit (QIAGEN, Hilden, Germany) according to the manufacturer’s instructions. The concentration and purity of the isolated DNA were verified with the BioSpec-nano spectrophotometer (Shimadzu, Kyoto, Japan). The number of EBV-DNA copies in PBMCs was calculated with the ISEX variant of the EBV polymerase chain reaction (PCR) kit (GeneProof, Brno, Czech Republic). EBV DNA was analysed qualitatively and quantitatively with real-time PCR (RT-PCR). A specific conservative DNA sequence for the EBV nuclear antigen 1 (EBNA-1) gene was amplified with PCR. The number of viral DNA copies per μL of eluent was adjusted for the efficiency of DNA isolation, and then it was expressed as the viral DNA copy number per μg of DNA. All samples were examined in duplicate. A sample of pure buffer used for DNA elution was used as a negative control in every case. Because we used a method with a detection threshold of 10 EBV DNA copies per μL, all samples below this threshold were considered EBV-negative [EBV(–)]. PCR was performed with the 7300 Real Time PCR System (Applied Biosystems, Foster City, USA). The reaction was conducted on MicroAmp® Optical 96-Well Reaction Plates (Life Technologies, Carlsbad, USA) with MicroAmp® Optical Adhesive Film (Life Technologies, Carlsbad, USA).
Measurement of EBV-specific antibodies in serum
We detected EBV-specific antibodies with commercial enzyme-linked immunosorbent assays (ELISA; IBL International, Hamburg, Germany). We analysed IgA, IgM, and IgG antibody classes against the early antigen (EA), viral capsid antigen (VCA), and EBNA-1. ELISA plates were read with the ELISA Reader Victor TM3 (PerkinElmer, Waltham, USA). We adopted manufacturer-specified cut-offs.
Measurement of soluble PD-1 and PD-L1 in serum
The concentrations of soluble PD-1 and PD-L1 proteins were measured with commercially available ELISA kits according to the manufacturer’s instructions (RayBiotech, Peachtree Corners, USA; Abcam, Cambridge, UK, respectively).
Measurement of lactic dehydrogenase and beta-2 microglobulin concentrations in serum
The concentrations of lactic dehydrogenase (LDH) and beta-2 microglobulin (B2M) in serum were measured using clinical-grade assays in local laboratories.
Statistical analysis
The Shapiro-Wilk test was used to test for normality. Variables were compared using analysis of variance (ANOVA) or the Kruskal-Wallis test, as appropriate. Dunn’s test was used for post-hoc comparisons, with the Benjamini–Hochberg method for false discovery rate correction. Categorical variables were compared using Fisher’s exact test. Correlations between pairs of variables were assessed with Spearman’s rank correlation coefficient (rho). We used survival analysis to compare the time to treatment initiation and the time to lymphocyte doubling between EBV(+) and EBV(−) patients and between patients with a high and low expression of PD-1 and PD-L1 within the subgroups of EBV(+) and EBV(−) patients. The classification of PD-1 and PD-L1 expression as high or low was based on medians specific for the subgroups of EBV(+) and EBV(−) patients. Kaplan-Meier curves were compared with the log-rank test; with p-values for log-rank tests were adjusted with Holm’s correction. P<0.05 was considered significant. All calculations were completed using the R software (https://www.r-project.org).
Results
At baseline, compared to EBV(−) patients with CLL, EBV(+) patients had a greater clinical disease burden (RAI and BINET scores) and higher values of unfavourable prognostic factors (B2M, LDH, percentage of CD19+CD38+ and CD19+ZAP70+ cells, deletion 11q; Table 1). EBV(+) and EBV(−) patients with CLL had similar white blood cell and lymphocyte counts (Table 1).
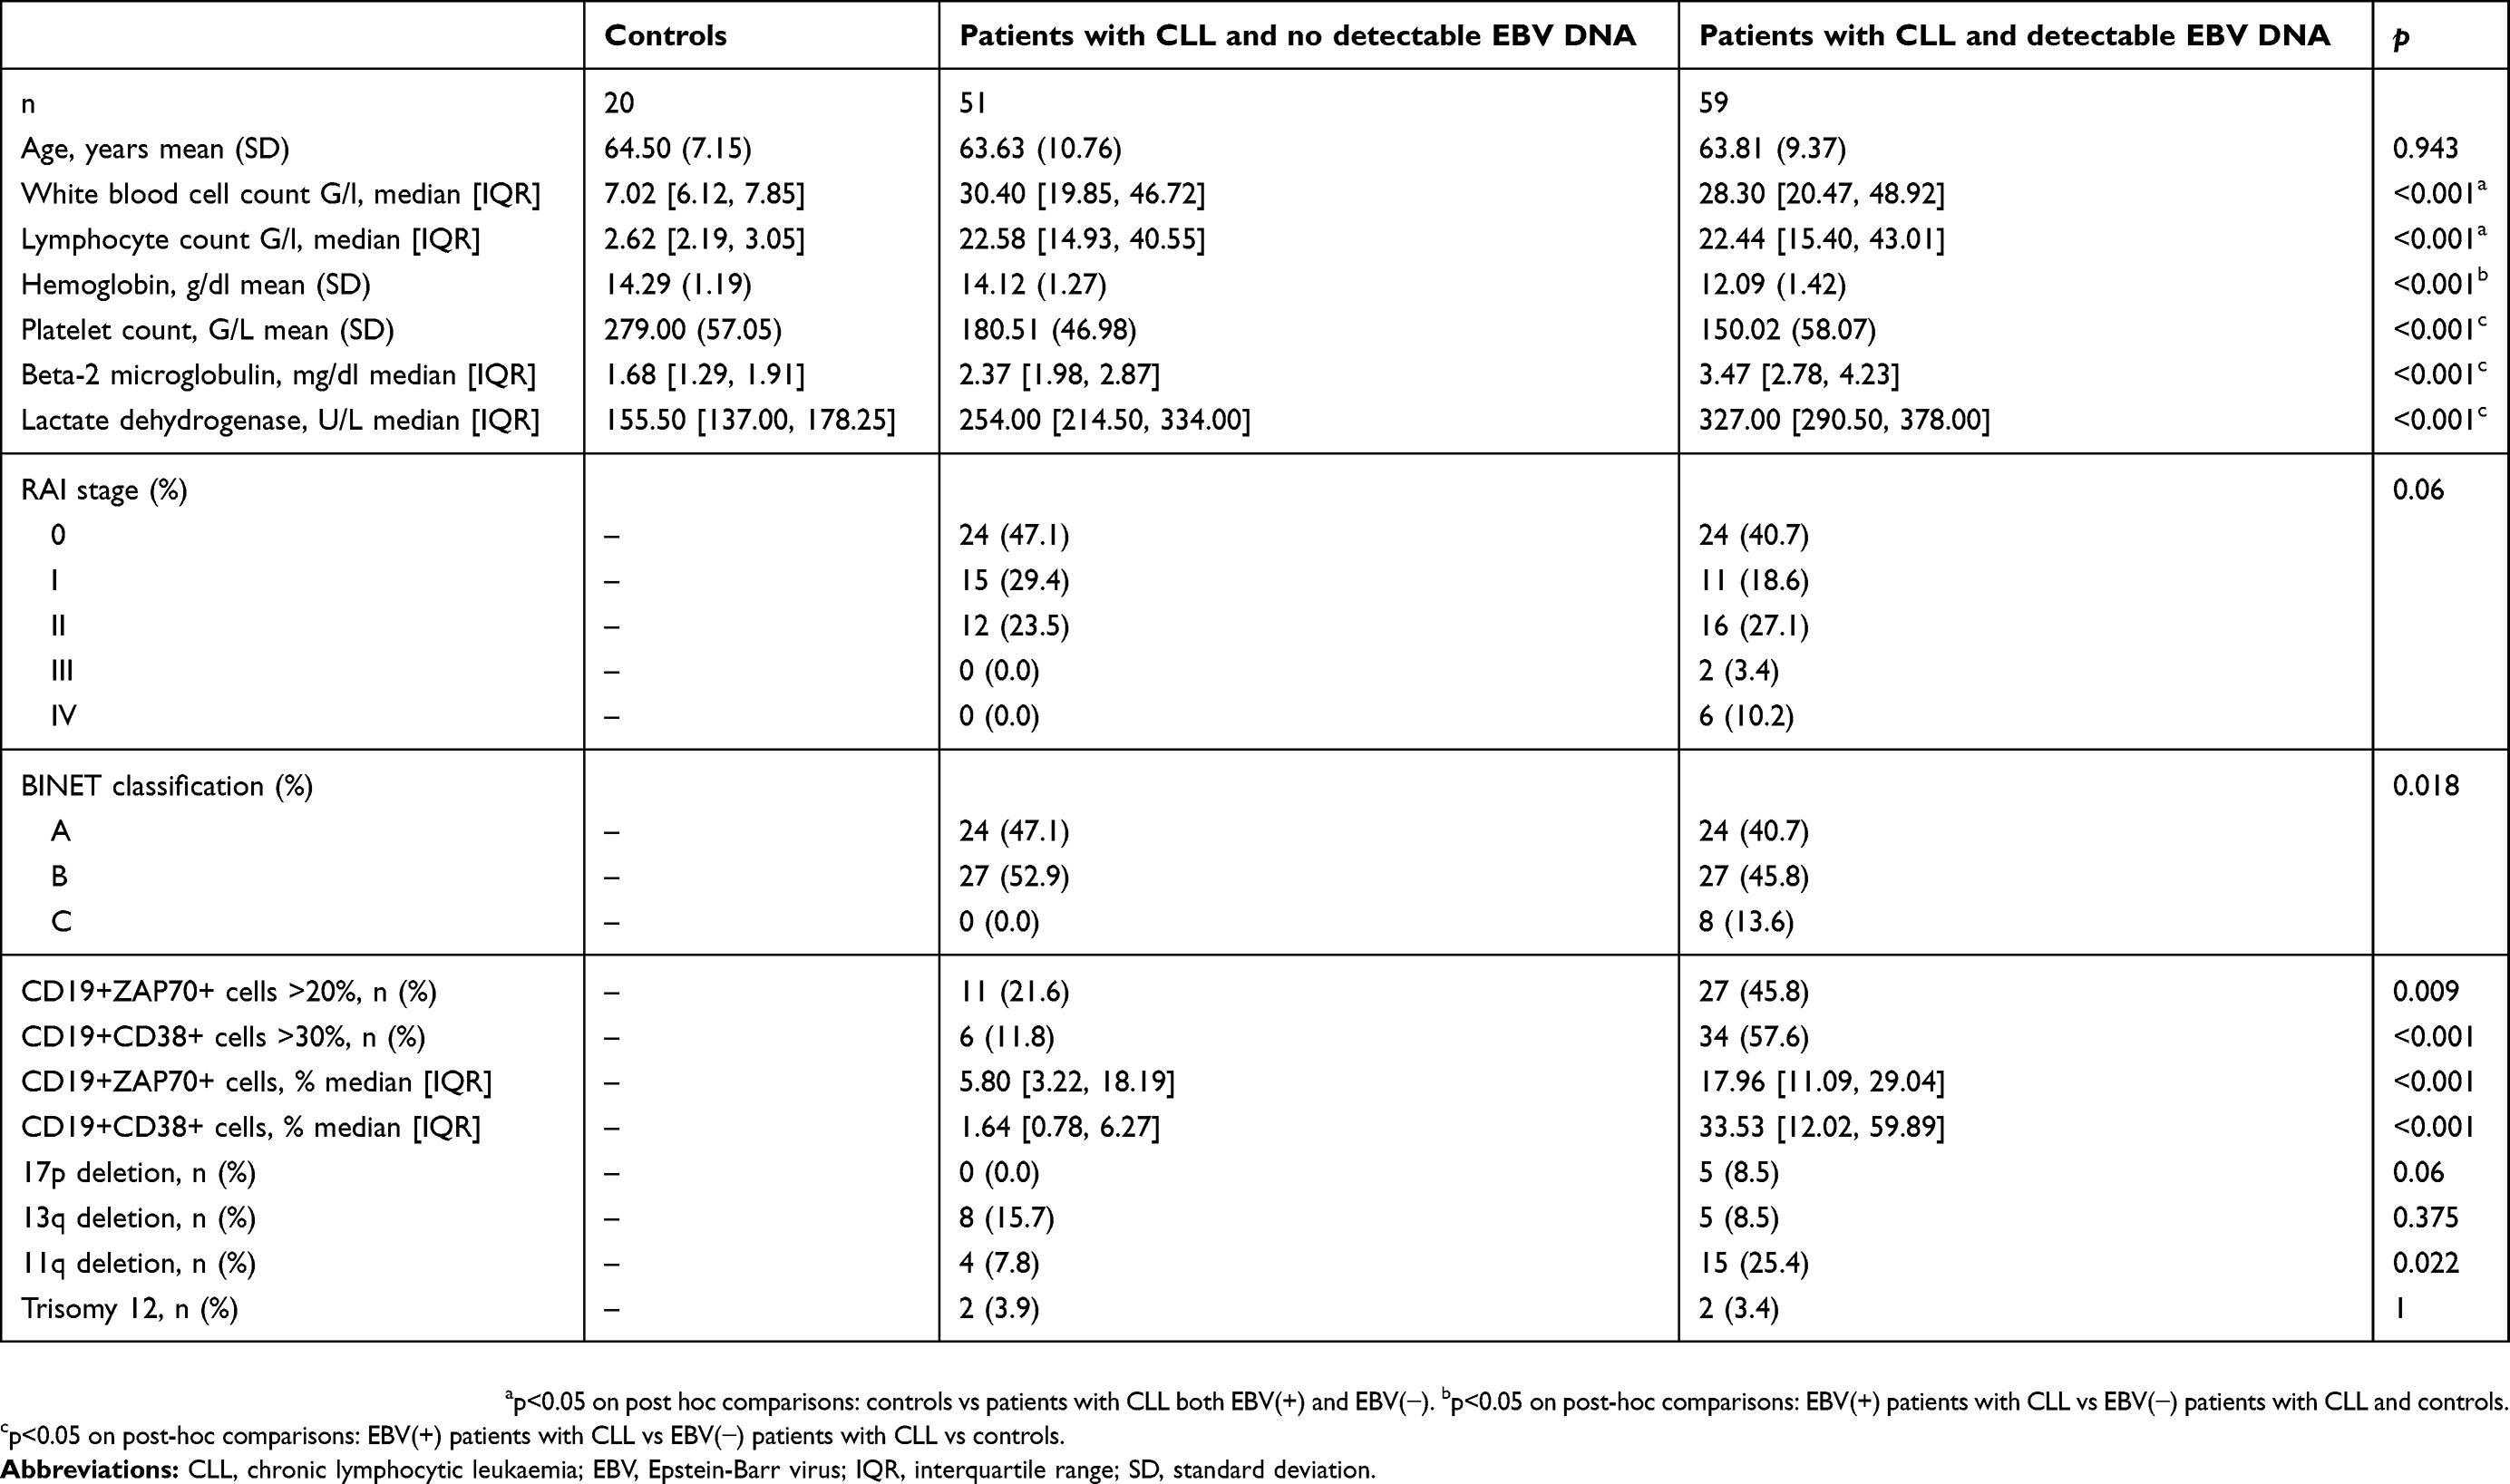 |
Table 1 Baseline characteristics of all participants |
Concentrations of soluble PD-1 and PD-L1 and the expressions of both PD-1 and PD-L1 on CD4+, CD8+, and CD19+ cells were significantly higher in patients with CLL than in controls. Furthermore, they were significantly higher in EBV(+) patients than in EBV(−) patients (p<0.05 for all comparisons, Table 2).
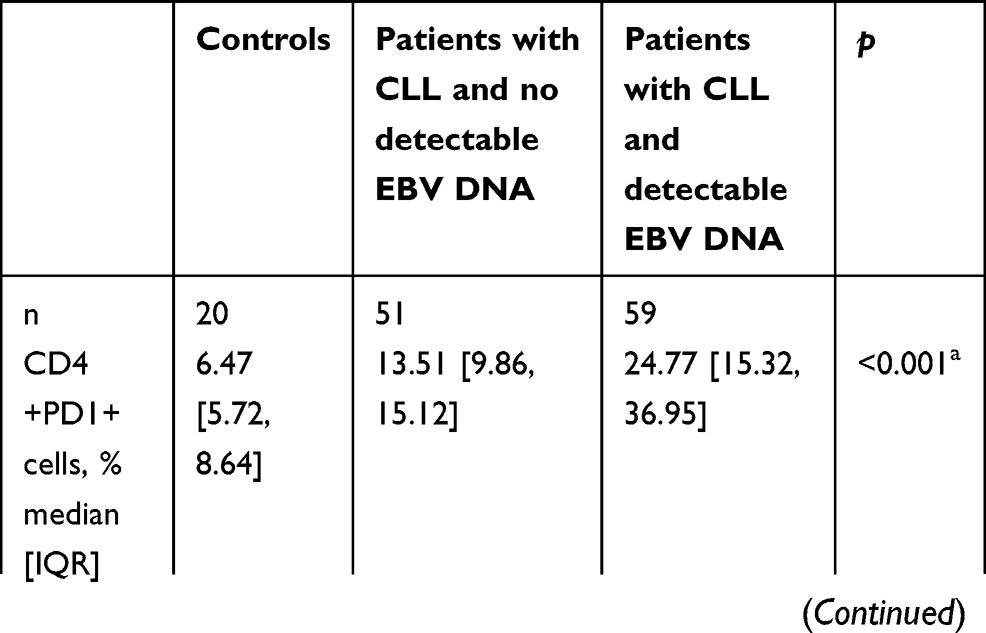 |
Table 2 Programmed cell death protein 1 and programmed cell death ligand 1 expression in controls, EBV(−) patients with CLL, and EBV(+) patients with CLL |
Among EBV(+) patients with CLL, EBV load correlated positively with LDH, B2M, and the percentages of CD19+CD38+ cells and CD19+ZAP70+ cells (Figure 1A–D).
 |
Figure 1 Association of EBV DNA load with the expression of prognostic markers, programmed cell death protein, and protein cell death ligand on immune cells, leukaemia cells, and serum in patients with chronic lymphocytic leukaemia. p-values are for log-rank tests, adjusted with Holm’s correction, comparisons between patients with high or low expression within the EBV(–) or EBV(+) groups; A – correlation between LDH concentration [U/l] and EBV load [copy number/μg of DNA], B - correlation between Beta 2 microglobulin concentration [mg/l] and EBV load [copy number/μg of DNA], C - correlation between the frequencies of CD19+CD38+ cells [%] and EBV load [copy number/μg of DNA], D - correlation between the frequencies of CD19+ZAP70+ cells [%] and EBV load [copy number/μg of DNA], E - correlation between the frequencies of CD4+PD-1+ cells [%] and EBV load [copy number/μg of DNA], F - correlation between the frequencies of CD8+PD-1+ cells [%] and EBV load [copy number/μg of DNA], G - correlation between the frequencies of CD19+PD-1+ cells [%] and EBV load [copy number/μg of DNA], H - correlation between the serum concentration of soluble PD-1 molecule [pg/ml] and EBV load [copy number/μg of DNA], I - correlation between the frequencies of CD4+PD-L1+ cells [%] and EBV load [copy number/μg of DNA], J - correlation between the frequencies of CD8+PD-L1+ cells [%] and EBV load [copy number/μg of DNA], K - correlation between the frequencies of CD19+PD-L1+ cells [%] and EBV load [copy number/μg of DNA], L - correlation between the serum concentration of soluble PD-L1 molecule [pg/ml] and EBV load [copy number/μg of DNA]. Abbreviations: EBV, Epstein-Barr virus; LDH, lactic dehydrogenase; PD1, programmed cell death protein 1; PD-L1, programmed cell death protein ligand 1; EBV(−), patients without detectable EBV DNA; EBV(+), patients with detectable EBV DNA; low, expression below median within the EBV(−) or EBV(+) groups; high, expression above median within the EBV(−) or EBV(+) groups. |
Among EBV(+) patients with CLL, those with higher EBV loads had greater concentrations of soluble PD-1 and PDL-1 and a greater expression of PD-1 on CD4+ and CD8+ cells. The expression of PD-1, but not PD-L1, on CD19+ cells was greater in patients with higher EBV loads (Figure 1E–L).
Compared with EBV(−) patients with CLL, EBV(+) patients had higher risks of both treatment initiation and lymphocyte doubling (p<0.001; Figures 2A and 3A).
 |
Figure 2 Time to treatment initiation in patients with chronic lymphocytic leukaemia and detectable [EBV(+)] vs undetectable [EBV(−)] EBV DNA (A) and high or low expression of PD-1 on CD4+, CD8+, and CD19+ cells and in serum (B–E). The classification of PD-1 expression as high or low was based on medians specific for EBV(+) and EBV(−) patients. P-values for log-rank tests are presented for comparisons between EBV(+) and EBV(−) patients (A) and between patients with high or low PD-1 expression within the groups of EBV(+) and EBV(−) patients (B–E). p-values are for log-rank tests, adjusted with Holm’s correction, comparisons between patients with high or low expression within the EBV(−) or EBV(+) groups. Abbreviations: EBV, Epstein-Barr virus; PD1, programmed cell death protein 1, EBV(−), patients without detectable EBV DNA; EBV(+), patients with detectable EBV DNA; low, expression below median within the EBV(−) or EBV(+) groups; high, expression above median within the EBV(−) or EBV(+) groups. |
 |
Figure 3 Time to lymphocyte doubling in patients with chronic lymphocytic leukaemia and detectable [EBV(+)] vs undetectable [EBV(−)] EBV DNA (A) and high or low expression of PD-1 on CD4+, CD8+, and CD19+ cells and in serum (B–E). The classification of PD-1 expression as high or low was based on medians specific for EBV(+) and EBV(−) patients. P-values for log-rank tests are presented for comparisons between EBV(+) and EBV(−) patients (A) and between patients with high or low PD-1 expression within the groups of EBV(+) and EBV(-) patients (B–E). p-values are for log-rank tests, adjusted with Holm’s correction, comparisons between patients with high or low expression within the EBV(−) or EBV(+) groups. Abbreviations: EBV, Epstein-Barr virus; PD1, programmed cell death protein 1, EBV(−), patients without detectable EBV DNA; EBV(+), patients with detectable EBV DNA; low, expression below median within the EBV(−) or EBV(+) groups; high, expression above median within the EBV(−) or EBV(+) groups. |
Among EBV(-) patients, those with high (above median) or low (below median) PD-1 and PD-L1 serum concentrations or high or low PD-1 and PD-L1 expressions on CD4+, CD8, and CD19+ cells had similar risks of treatment initiation and lymphocyte doubling (p≥0.352; Figures 2, 3, S2 and S3).
Among EBV(+) patients, high PD-1 and PD-L1 expressions on CD4+ and CD8+ cells were associated with greater risks of treatment initiation and lymphocyte doubling (p≤0.020; Figures 2B–C, 3B–C, S2A–B and S3A–B).
Among EBV(+) patients, high PD-1 and PD-L1 concentrations were associated with a greater risk of treatment initiation (p=0.009, Figure 2E; p=0.183, Figure S2D), but not with a greater risk of lymphocyte doubling (p=0.280, Figure 3E; p=0.280, Figure S3D).
Among EBV(+) patients with CLL, neither the expression of PD-1 nor of PD-L1 on CD19+ cells was related to the risks of treatment initiation or lymphocyte doubling (p≥0.360; Figures 2D, 3D, S2C and S3C).
Discussion
This study confirmed that EBV infection was associated with worse outcomes in patients with CLL, and this may be due to an EBV-induced upregulation of PD-1-PD-L1 expression on host immune cells. In our patients with CLL, those with detectable EBV DNA had increased PD-1 and PD-L1 expression, and the expression of PD-1 and PD-L1 correlated positively with EBV DNA load. Moreover, PD-1 and PD-L1 expression on host immune cells, but not on leukaemia cells, was associated with worse outcomes in patients with CLL. Previous studies concentrated on the expression of PD-1 on T cells and on PD-L1 expression in cancer cells. However, we investigated the expression of PD-1 and PD-L1 on both T cells and leukaemia cells, because PD-1 was shown to be overexpressed on leukaemia cells in CLL.13,15 Moreover, in other cancers, PD-L1 expression on T cells, but not cancer cells, was associated with differences in key outcomes.19,20
In our study, about half of the patients had detectable EBV DNA at baseline, and these patients had more severe disease at baseline than did the remaining patients, which was indicated by both laboratory markers of disease burden (LDH, B2M, ZAP70, CD38) and clinical status (RAI and Binet scores). These baseline differences translated into worse longitudinal outcomes in EBV(+) patients with CLL, which is in line with our previous findings.9
In this study, we hypothesized that EBV worsens CLL prognosis by inducing the PD-1-PD-L1 immune inhibitory pathway. The PD-1-PD-L1 pathway is one of the most important mechanisms of immune tolerance, but it is also used by viruses and cancer cells to evade immune surveillance. The expression of both PD-1 and PD-L1 increases during viral infections and cancer due to chronic stimulation of T cell receptors.21 For example, PD-1-PD-L1 signalling is increased in HIV, viral hepatitis, and many cancer types.22,23 In agreement with the results of previous studies, we found an increased expression of PD-1 and PD-L1 on CD4+, CD8+, and CD19+ cells in patients with CLL, including those without detectable EBV DNA. Moreover, the expression of PD-1 and PD-L1 was even greater in patients with CLL who had detectable EBV DNA.
We also observed that PD-1 and PD-L1 expression on CD4+ and CD8+ cells correlated positively with EBV DNA load, which suggests that a more severe EBV infection is associated with greater PD-1-PD-L1 expression. Importantly, among EBV(+), but not EBV(−) patients with CLL, a higher expression of PD-1 and PD-L1 on CD4+ and CD8+ cells was associated with greater risks of treatment initiation and lymphocyte doubling. Similarly, in nasopharyngeal carcinoma, a high expression of PD-1 on intratumoral CD8+ cells was associated with worse survival.24
Although EBV DNA load correlated weakly with PD-1 expression on leukaemia cells (CD19+), there was no correlation between EBV DNA load and PD-L1 expression on these cells. Moreover, PD-1 and PD-L1 expression on CD19+ cells was not related to the risks of treatment initiation and lymphocyte doubling. In contrast, PD-L1 expression on lung cancer cells is associated with a worse relapse-free survival.25 Our observations suggest that PD-1-PD-L1 expression in CLL affects primarily effector immune responses towards cancer cells rather than the behaviour of leukaemia cells.
Our study was observational, and we measured EBV DNA at baseline only. Thus, we do not know how EBV status changes with time in CLL. Because about 90% of adults have a history of EBV infection, we suspect that most patients with CLL who have detectable EBV DNA have a reactivation of EBV infection rather than a new infection. In our study, all patients without detectable EBV DNA had antibodies against EBV antigens, which indicates previous EBV infection, and patients with detectable EBV DNA had increased titres of reactivation markers (anti-EA and anti-VCA antibodies). Furthermore, because of a limited sample size, it was not feasible in this study to analyse clinical outcomes in patient subgroups that received different treatments. However, this limitation did not affect the analysis of the time to treatment initiation, and findings regarding this end point were consistent with the time to lymphocyte doubling. Finally, PD-1/PD-L1 expression can be induced by both tumour immune evasion and chronic EBV infection. Because our study was observational, it could not separate these two mechanisms. Thus, functional studies are needed.
Conclusion
In conclusion, our findings suggest that EBV infection worsens the prognosis in patients with CLL, and this is due, at least partly, to EBV-induced up-regulation of PD-1-PD-L1 expression. Because inhibitors of both PD-1 and PD-L1 are effective treatments for various cancers, they are promising alternatives for patients with CLL. Importantly, PD-1 inhibitors (nivolumab, pembrolizumab) are approved for the treatment of Hodgkin’s lymphoma, which is related to EBV infection in about half of the patients.22,26,27 Based on our findings, we suggest that clinical trials evaluating the use of PD-1-PD-L1 inhibitors should be considered for patients with CLL who have EBV reactivation. Screening for EBV reactivation in CLL might identify patients at an increased risk of treatment failure, but this should be tested in a new study.
Ethical statement
The study was approved by the Ethics Committee of the Medical University of Lublin (KE-0254/227/2010), and written informed consent was obtained from all participants.
Acknowledgments
The authors would like to thank Proper Medical Writing Sp. z o.o. for language correction the final version of our manuscript. This work was supported by the Polish National Science Center (grant no UMO-2016/21/B/NZ6/02279) and the Medical University of Lublin (grant no DS460). The sponsors had no role in study design, data collection and analysis, decision to publish, or preparation of the manuscript.
Author contributions
All authors contributed to data analysis, drafting or revising the article, gave final approval of the version to be published, and agree to be accountable for all aspects of the work.
Disclosure
The authors report no conflicts of interest in this work.
References
1. Rozman C, Montserrat E. Chronic Lymphocytic Leukemia. N Engl J Med. 1995;333(16):1052–1057. doi:10.1056/NEJM199510193331606
2. Ghia P, Ferreri AJM, Caligaris-Cappio F. Chronic lymphocytic leukemia. Crit Rev Oncol Hematol. 2007;64(3):234–246. doi:10.1016/J.CRITREVONC.2007.04.008
3. Pulte D, Castro FA, Jansen L, et al. Trends in survival of chronic lymphocytic leukemia patients in Germany and the USA in the first decade of the twenty-first century. J Hematol Oncol. 2016;9:28. doi:10.1186/s13045-016-0257-2
4. Ghia P, Hallek M. Management of chronic lymphocytic leukemia. Haematologica. 2014;99(6):965–972. doi:10.3324/haematol.2013.096107
5. Küppers R. B cells under influence: transformation of B cells by Epstein–Barr virus. Nat Rev Immunol. 2003;3(10):801–812. doi:10.1038/nri1201
6. De Roos AJ, Martinez-Maza O, Jerome KR, et al. Investigation of Epstein-Barr Virus as a Potential Cause of B-Cell Non-Hodgkin Lymphoma in a Prospective Cohort. Cancer Epidemiol Biomarkers Prev. 2013;22(10):1747–1755. doi:10.1158/1055-9965.EPI-13-0240
7. Becker N, Falster MO, Vajdic CM, et al. Self-reported history of infections and the risk of non-Hodgkin lymphoma: an InterLymph pooled analysis. Int J Cancer. 2012;131(10):2342–2348. doi:10.1002/ijc.27438
8. García-Barchino MJ, Sarasquete ME, Panizo C, et al. Richter transformation driven by Epstein-Barr virus reactivation during therapy-related immunosuppression in chronic lymphocytic leukaemia. J Pathol. 2018;245(1):61–73. doi:10.1002/path.5060
9. Grywalska E, Roliński J, Pasiarski M, et al. High Viral Loads of Epstein-Barr Virus DNA in Peripheral Blood of Patients with Chronic Lymphocytic Leukemia Associated with Unfavorable Prognosis. Pagano JS, ed. PLoS One. 2015;10(10):e0140178. doi:10.1371/journal.pone.0140178
10. McKinney EF, Lee JC, Jayne DRW, Lyons PA, Smith KGC. T-cell exhaustion, co-stimulation and clinical outcome in autoimmunity and infection. Nature. 2015;523(7562):612–616. doi:10.1038/nature14468
11. Goodman A, Patel SP, Kurzrock R. PD-1-PD-L1 immune-checkpoint blockade in B-cell lymphomas. Nat Rev Clin Oncol. 2017;14(4):203–220. doi:10.1038/nrclinonc.2016.168
12. Green MR, Rodig S, Juszczynski P, et al. Constitutive AP-1 activity and EBV infection induce PD-L1 in Hodgkin lymphomas and posttransplant lymphoproliferative disorders: implications for targeted therapy. Clin Cancer Res. 2012;18(6):1611–1618. doi:10.1158/1078-0432.CCR-11-1942
13. Grzywnowicz M, Zaleska J, Mertens D, et al. Programmed death-1 and its ligand are novel immunotolerant molecules expressed on leukemic B cells in chronic lymphocytic leukemia. Lapteva N, ed. PLoS One. 2012;7(4):e35178. doi:10.1371/journal.pone.0035178
14. Riches JC, Davies JK, McClanahan F, et al. T cells from CLL patients exhibit features of T-cell exhaustion but retain capacity for cytokine production. Blood. 2013;121(9):1612–1621. doi:10.1182/blood-2012-09-457531
15. Xerri L, Chetaille B, Seriari N, et al. Programmed death 1 is a marker of angioimmunoblastic T-cell lymphoma and B-cell small lymphocytic lymphoma/chronic lymphocytic leukemia. Hum Pathol. 2008;39(7):1050–1058. doi:10.1016/j.humpath.2007.11.012
16. Brusa D, Serra S, Coscia M, et al. The PD-1/PD-L1 axis contributes to T-cell dysfunction in chronic lymphocytic leukemia. Haematologica. 2013;98(6):953–963. doi:10.3324/haematol.2012.077537
17. Hallek M. Chronic lymphocytic leukemia: 2013 update on diagnosis, risk stratification and treatment. Am J Hematol. 2013;88(9):803–816. doi:10.1002/ajh.23491
18. Hus I, Podhorecka M, Bojarska-Junak A, et al. The clinical significance of ZAP-70 and CD38 expression in B-cell chronic lymphocytic leukaemia. Ann Oncol. 2006;17(4):683–690. doi:10.1093/annonc/mdj120
19. Kim HR, Ha S-J, Hong MH, et al. PD-L1 expression on immune cells, but not on tumor cells, is a favorable prognostic factor for head and neck cancer patients. Sci Rep. 2016;6(1):36956. doi:10.1038/srep36956
20. Kowanetz M, Zou W, Gettinger SN, et al. Differential regulation of PD-L1 expression by immune and tumor cells in NSCLC and the response to treatment with atezolizumab (anti–PD-L1). Proc Natl Acad Sci. 2018;115(43):E10119–E10126. doi:10.1073/pnas.1802166115
21. Wherry EJ, Kurachi M. Molecular and cellular insights into T cell exhaustion. Nat Rev Immunol. 2015;15(8):486–499. doi:10.1038/nri3862
22. Bardhan K, Anagnostou T, Boussiotis VA. The PD1: PD-L1/2 Pathway from Discovery to Clinical Implementation. Front Immunol. 2016;7:550. doi:10.3389/fimmu.2016.00550
23. Hofmeyer KA, Jeon H, Zang X. The PD-1/PD-L1 (B7-H1) pathway in chronic infection-induced cytotoxic T lymphocyte exhaustion. J Biomed Biotechnol. 2011;2011:451694. doi:10.1155/2011/451694
24. Hsu M-C, Hsiao J-R, Chang K-C, et al. Increase of programmed death-1-expressing intratumoral CD8 T cells predicts a poor prognosis for nasopharyngeal carcinoma. Mod Pathol. 2010;23(10):1393–1403. doi:10.1038/modpathol.2010.130
25. Igarashi T, Teramoto K, Ishida M, Hanaoka J, Daigo Y. Scoring of PD-L1 expression intensity on pulmonary adenocarcinomas and the correlations with clinicopathological factors. ESMO Open. 2016;1(4):e000083. doi:10.1136/esmoopen-2016-000083
26. Flavell KJ, Murray PG, Hodgkin’s disease and the Epstein-Barr virus. Mol Pathol. 2000;53(5):262–269. doi:10.1136/mp.53.5.262
27 Donato EM, Fernández-Zarzoso M, Hueso JA, de la Rubia J. Brentuximab vedotin in Hodgkin lymphoma and anaplastic large-cell lymphoma: an evidence-based review. Onco Targets Ther. 2018;11:4583–4590. doi:10.2147/OTT.S141053
Supplementary materials
 |
Figure S1 Continued |
 |
Figure S1 Continued |
 |
Figure S1 Flow cytometric analysis of the expression of PD-1 and PD-L1. Analysis of the expression of PD-1 for (A) EBV (+) patients with CLL; (B) EBV (−) patients with CLL and (C) control patients (C). Analysis of the expression of PD-L1 for (D) EBV (+) patients with CLL; (E) EBV (−) patients with CLL and (F) control patients. p-values are for log-rank tests, adjusted with Holm’s correction, comparisons between patients with high or low expression within the EBV(−) or EBV(+) groups.Abbreviations: CLL, chronic lymphocytic leukaemia; EBV, Epstein-Barr virus; PD1, programmed cell death protein 1, PD-L1, programmed cell death protein ligand 1; EBV (−), patients without detectable EBV DNA; EBV(+), patients with detectable EBV DNA; low, expression below median within the EBV (−) or EBV(+) groups; high, expression above median within the EBV(−) or EBV(+) groups. |
 |
Figure S2 Time to treatment initiation in patients with chronic lymphocytic leukaemia and detectable [EBV(+)] and undetectable [EBV(-)] EBV DNA according to high or low expression of PDL-1 on CD4+, CD8+, and CD19+ cells and in serum. The classification of PDL-1 expression as high or low was based on medians specific for EBV(+) and EBV(−) patients. P-values for log-rank tests are presented for comparisons between patients with high or low PD-L1 expression within the groups of EBV(+) and EBV(−) patients. p-values are for log-rank tests, adjusted with Holm’s correction, comparisons between patients with high or low expression within the EBV(−) or EBV(+) groups. Abbreviations: EBV, Epstein-Barr virus; PD-L1, programmed cell death protein ligand 1, EBV(−), patients without detectable EBV DNA; EBV(+), patients with detectable EBV DNA; low, expression below median within the EBV(−) or EBV(+) groups; high, expression above median within the EBV(−) or EBV(+) groups. |
 |
Figure S3 Time to lymphocyte doubling in patients with chronic lymphocytic leukaemia and detectable [EBV(+)] and undetectable [EBV(−)] EBV DNA according to high or low expression of PD-L1 on CD4+, CD8+, and CD19+ cells and in serum. The classification of PD-L1 expression as high or low was based on medians specific for EBV(+) and EBV(−) patients. P-values for log-rank tests are presented for comparisons between patients with high or low PD-L1 expression within the groups of EBV(+) and EBV(−) patients. p-values are for log-rank tests, adjusted with Holm’s correction, comparisons between patients with high or low expression within the EBV(−) or EBV(+) groups. Abbreviations: EBV, Epstein-Barr virus; PD-L1, programmed cell death protein ligand 1, EBV(−), patients without detectable EBV DNA; EBV(+), patients with detectable EBV DNA; low, expression below median within the EBV(−) or EBV(+) groups; high, expression above median within the EBV(−) or EBV(+) groups. |
 © 2019 The Author(s). This work is published and licensed by Dove Medical Press Limited. The
full terms of this license are available at https://www.dovepress.com/terms
and incorporate the Creative Commons Attribution
- Non Commercial (unported, 3.0) License.
By accessing the work you hereby accept the Terms. Non-commercial uses of the work are permitted
without any further permission from Dove Medical Press Limited, provided the work is properly
attributed. For permission for commercial use of this work, please see paragraphs 4.2 and 5 of our Terms.
© 2019 The Author(s). This work is published and licensed by Dove Medical Press Limited. The
full terms of this license are available at https://www.dovepress.com/terms
and incorporate the Creative Commons Attribution
- Non Commercial (unported, 3.0) License.
By accessing the work you hereby accept the Terms. Non-commercial uses of the work are permitted
without any further permission from Dove Medical Press Limited, provided the work is properly
attributed. For permission for commercial use of this work, please see paragraphs 4.2 and 5 of our Terms.