Back to Journals » Cancer Management and Research » Volume 14
Programmed Cell Death-1 and Its Ligands as Targets for Therapy of Multiple Myeloma Patients
Authors Karczmarczyk A, Korpysz M, Bilska S, Purkot J, Hus M, Giannopoulos K ![]()
Received 26 November 2021
Accepted for publication 1 March 2022
Published 28 March 2022 Volume 2022:14 Pages 1267—1281
DOI https://doi.org/10.2147/CMAR.S351383
Checked for plagiarism Yes
Review by Single anonymous peer review
Peer reviewer comments 2
Editor who approved publication: Dr Sanjeev K. Srivastava
Agnieszka Karczmarczyk,1 Maciej Korpysz,2 Sylwia Bilska,3 Joanna Purkot,1 Marek Hus,3 Krzysztof Giannopoulos1,4
1Department of Experimental Hematooncology, Medical University of Lublin, Lublin, Poland; 2Department of Biochemical Diagnostics, Medical University of Lublin, Lublin, Poland; 3Department of Hematooncology and Bone Marrow Transplantation, Medical University of Lublin, Lublin, Poland; 4Department of Hematology, St. John’s Cancer Centre, Lublin, Poland
Correspondence: Krzysztof Giannopoulos, Department of Experimental Hematooncology, Medical University of Lublin, Chodzki 1, Lublin, 20-093, Poland, Tel + 48 81448 6632, Fax + 48 81448 6634, Email [email protected]
Purpose: Among hematological malignancies, the expression profile of programmed cell death-1 (PD-1) and its ligands in multiple myeloma (MM) is still debated by numerous research groups. In current study, we characterized the expression of PD-1 and its ligands both on RNA and protein levels in MM patients. We have also attempted to analyze whether daratumumab therapy might overcome CD38-mediated immunosuppression that inhibits in particular CD8+ T-cell function.
Patients and Methods: This study included 149 newly diagnosed MM patients and 15 relapsed/refractory MM patients before and after daratumumab treatment. The mRNA levels of PDCD1, PDCD1LG1, PDCD1LG2 and their splicing variants was assessed by quantitative reverse transcriptase-polymerase chain reaction (qRT-PCR). Flow cytometry was used to characterize the surface expression of PD-1 and its ligands on plasma cells, B and T cells. The surface expression of PD-1 on T cells was assessed by flow cytometry before and after daratumumab treatment.
Results: The mRNA expression of PDCD1LG1, PDCD1LG2 and their splicing variants were higher in plasma cells as compared to bone marrow mononuclear cells (BMMCs). Our results show that the percentage of plasma cells expressing PD-L1 was significantly higher than plasma cells expressing PD-L2 (p< 0.0001) in bone marrow (BM) of MM patients. There was no significant difference between the percentage of plasma cells expressing PD-1 and B cells expressing PD-1 in BM of MM patients (11.19% vs 8.91%). We also found that the percentage of CD8+PD-1+ T cells was significantly higher than CD4+PD-1+T cells in BM (p< 0.0001) of MM patients. Here, we observed no change in PD-1 expression on CD4+ and CD8+ T cells after the daratumumab treatment.
Conclusion: The PD-1 and its ligands might represent an interesting target for MM immunotherapy, as one would target both malignant plasma cells as well as the immune cells that play a key role in tumor escape mechanisms.
Keywords: PD-1, PD-L1, PD-L2, daratumumab, multiple myeloma
Introduction
Multiple myeloma (MM) is the second most common diagnosed hematological disease, derived from B-cells in the terminal stage of differentiation after immunoglobulin heavy (IGH) chain recombination and immunoglobulin class switching. In the pathogenesis of MM, the immune dysregulation has emerged as a critical process responsible for promoting tumor cell growth, survival, and disease progression. This dysfunction is due to the reduction of T cells cytotoxicity, the B cells immunodeficiency, the expansion of regulatory T cells (Tregs), the dendritic cells (DCs) dysfunction, which makes plasma cells can easily escape immune surveillance.1 Programmed cell death-1 (PD-1, CD279) is a type I transmembrane protein belonging to the cluster of differentiation 28 (CD28)/cytotoxic T lymphocyte antigen-4 (CTLA-4) family and is mainly expressed on antigen-activated and exhausted T and B cells.2,3 PD-1 interacts with two ligands, the programmed death ligand-1 (PD-L1, B7-H1, CD274), and the programmed death ligand-2 (PD-L2), known as B7-DC or CD273. PD-L1 is widely expressed on immune cells, including activated T cells, B cells, macrophages, DCs, and neutrophils but also at low levels on organs such as lung, heart, liver and kidneys.4 PD-L2 is another ligand of PD-1, its role in modulating the immune response is not as well-known as that of PD-L1. The expression of PD-L2 is more limited than PD-L1 and is found on DCs and macrophages, and its expression can be induced in other cells, depending on the microenvironmental stimuli.5,6 PD-1 transmits suppressive signals to T cells after binding to PD-L1 or PD-L2 on antigen-presenting cells (APCs) or cancer cells.7 Multiple studies have demonstrated that the increased expression level of PD-L1 in different tumor types is associated with advanced disease stages and weak prognosis.8–10 Studies on MM models have shown that the PD-L1-expressing plasma cells inhibit T cell activities, thus contributing to the escape from immune surveillance.11 Studies in cell lines and animal models have provided sufficient evidence for the potential therapeutic effect of PD-1/PD-L1 pathway blockade in MM.12–14 In a Phase I clinical trial anti-PD-1 monotherapy provided no clear clinical benefit in relapsed/refractory MM (RRMM) patients.15 Interestingly, the recent data have reported that the resistance to anti-PD-1 or anti-PD-L1 therapy is associated with the upregulation of CD38 on tumor cells.16,17
The aim of the study was the analysis of PD-1 and its ligands both on RNA and protein levels in the bone marrow (BM) of MM patients. The study was also aimed at the characterization of PD-1 and PD-L1 expression on CD4+ and CD8+ T cells in the BM and peripheral blood (PB) of MM patients. Moreover, the analysis of PD-1 expression on CD4+ and CD8+ T cells in RRMM patients before and after anti-CD38 (daratumumab) treatment was performed.
Materials and Methods
The Study Groups
Peripheral blood (PB) samples and bone marrow (BM) aspirates were obtained from 149 patients diagnosed with MM at the Department of Hematooncology and Bone Marrow Transplantation, Medical University of Lublin, Poland and Hematology Department, St John’s Cancer Center, Lublin, Poland. All samples were collected at the point of initial diagnosis and prior to any treatment. Among a cohort of 149 MM patients, in 68 patient samples (BMMCs=38 and CD138+ PCs=30) assessment of the mRNA expression of PDCD1, CD724 (PDCD1LG1), PDCD1LG2, and their splicing variants was performed with quantitative reverse transcriptase-polymerase chain reaction (qRT-PCR). For 98 patients assessment of surface expression of PD-1, PD-L1 and PD-L2 on plasma cells as well as B cells was examined with flow cytometry. In 66 MM cases (BM=45 and PB=21), the expression of PD-1 and PD-L1 on CD4+ and CD8+ T cells was analyzed with flow cytometry. The clinical characteristics of the cohorts of MM patients are presented in Tables 1 and 2.
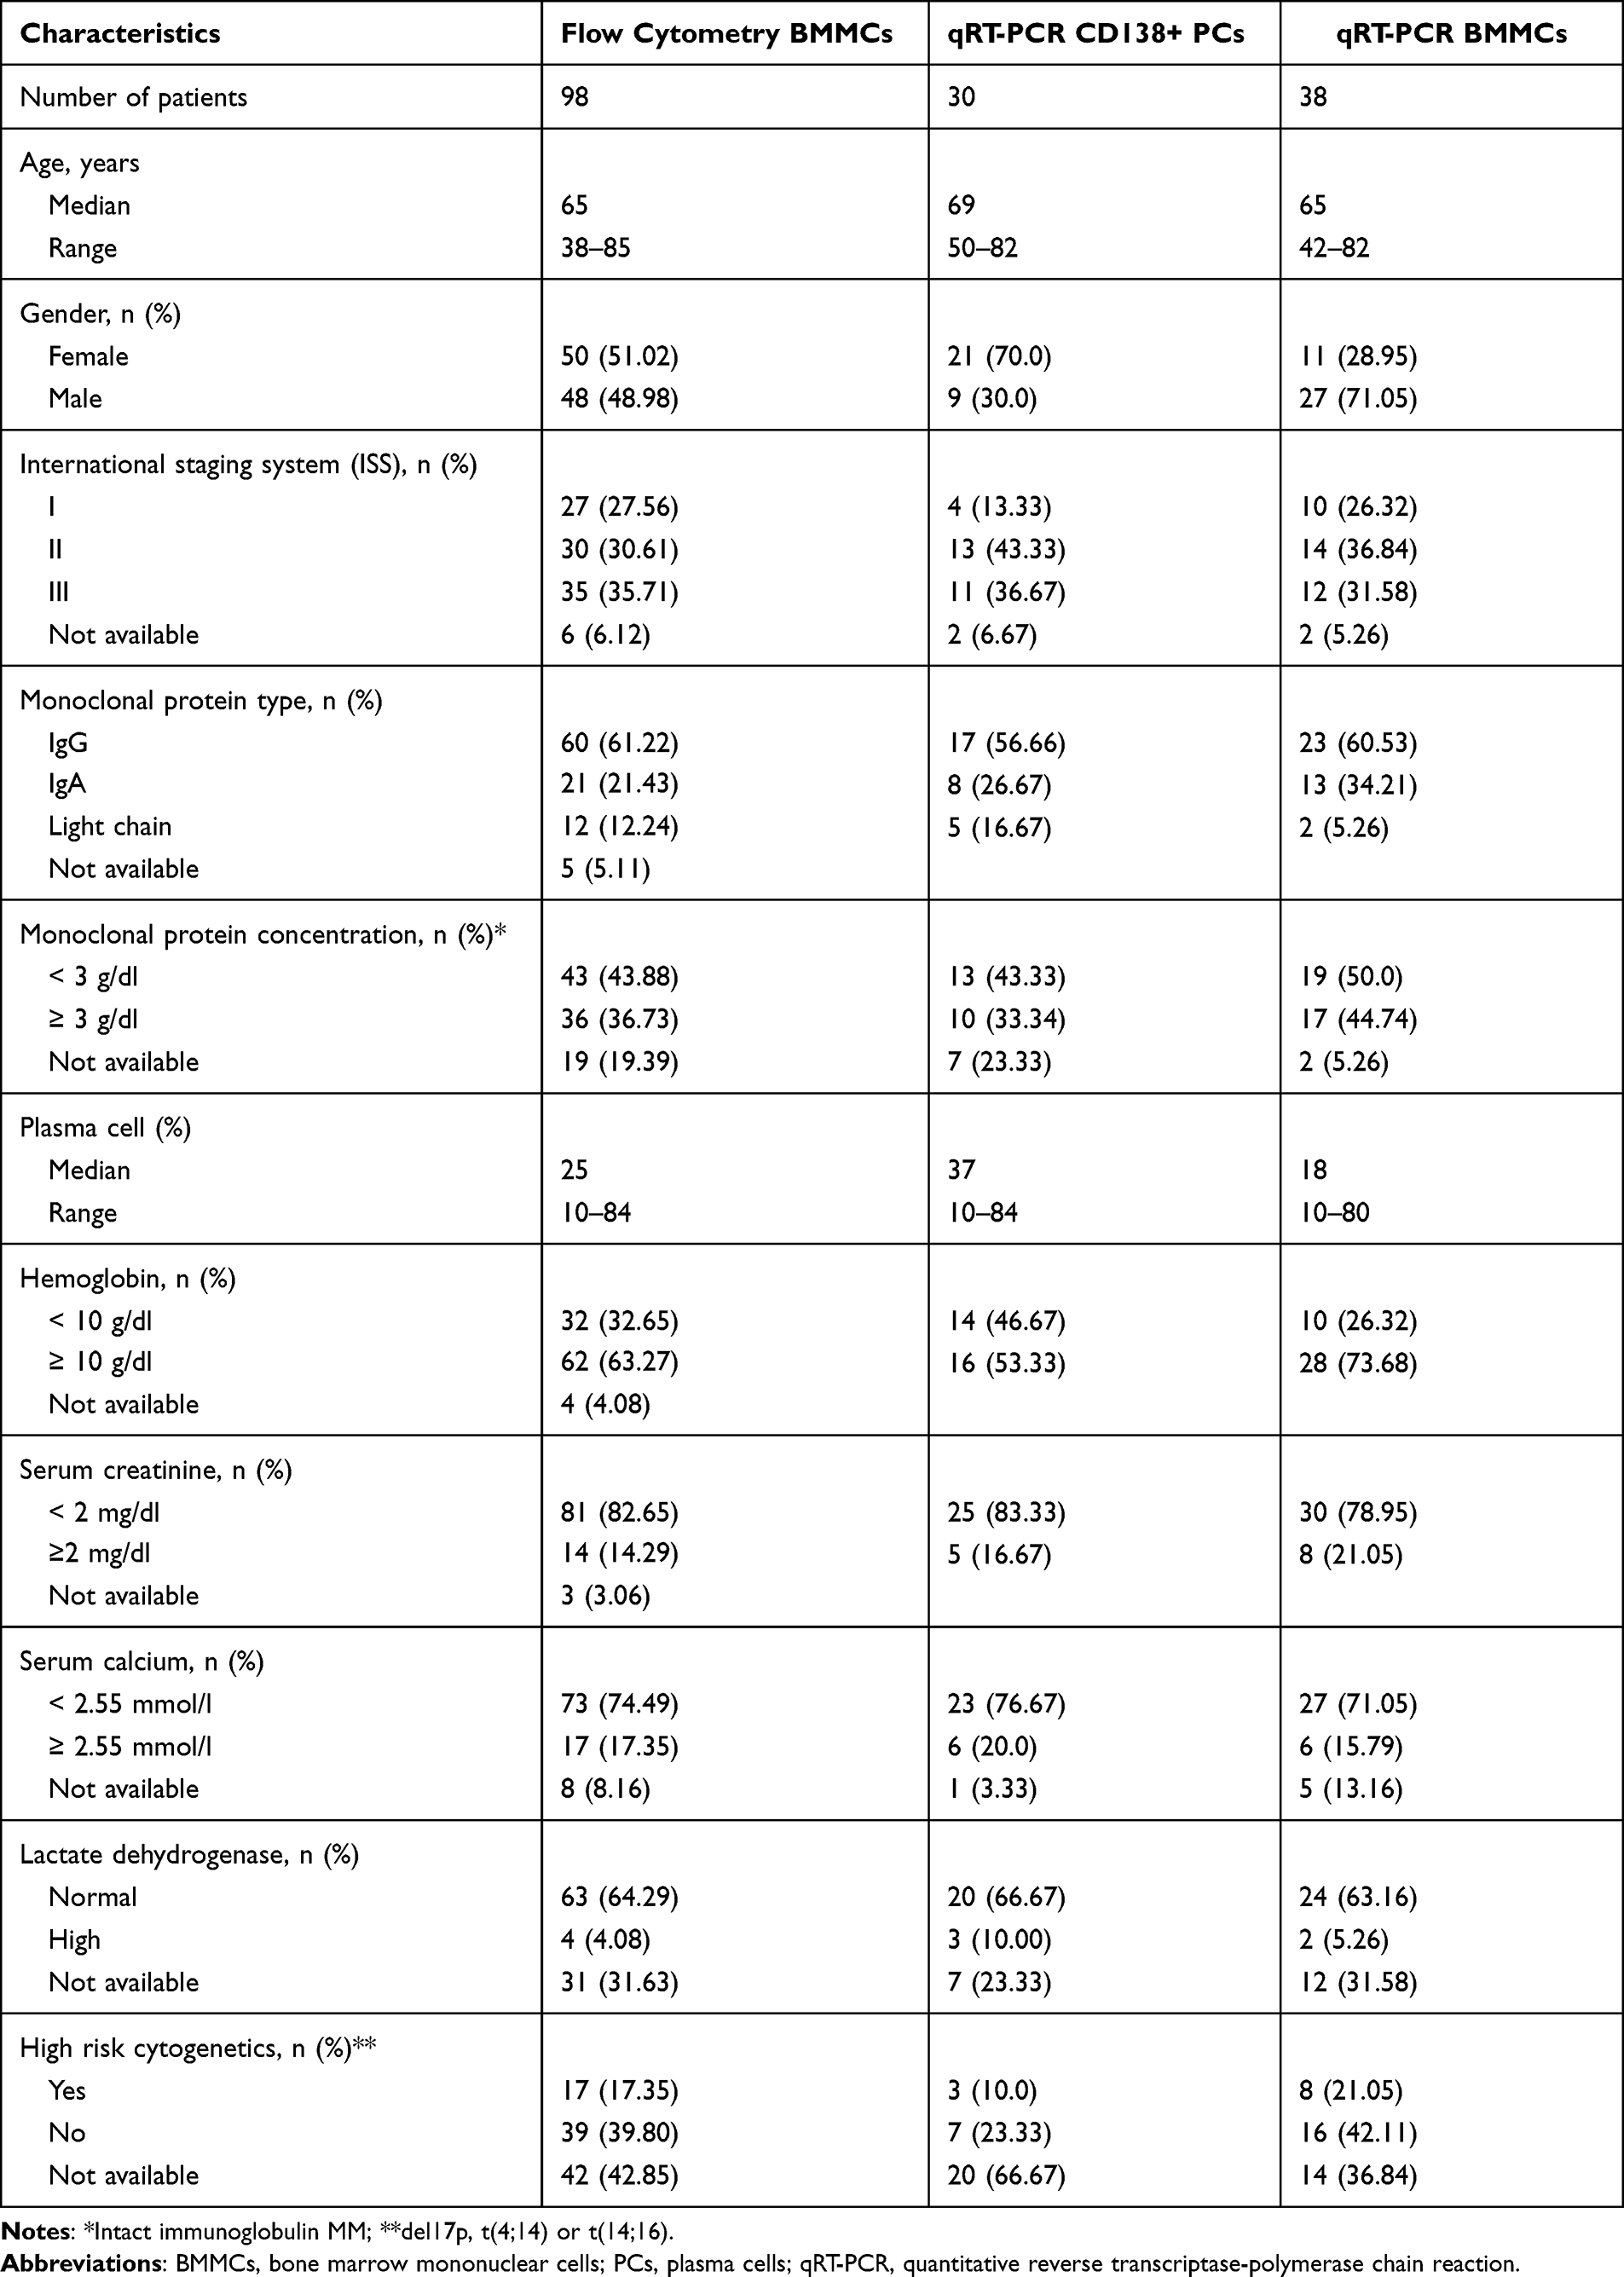 |
Table 1 Clinical Characteristics of the Studied Groups |
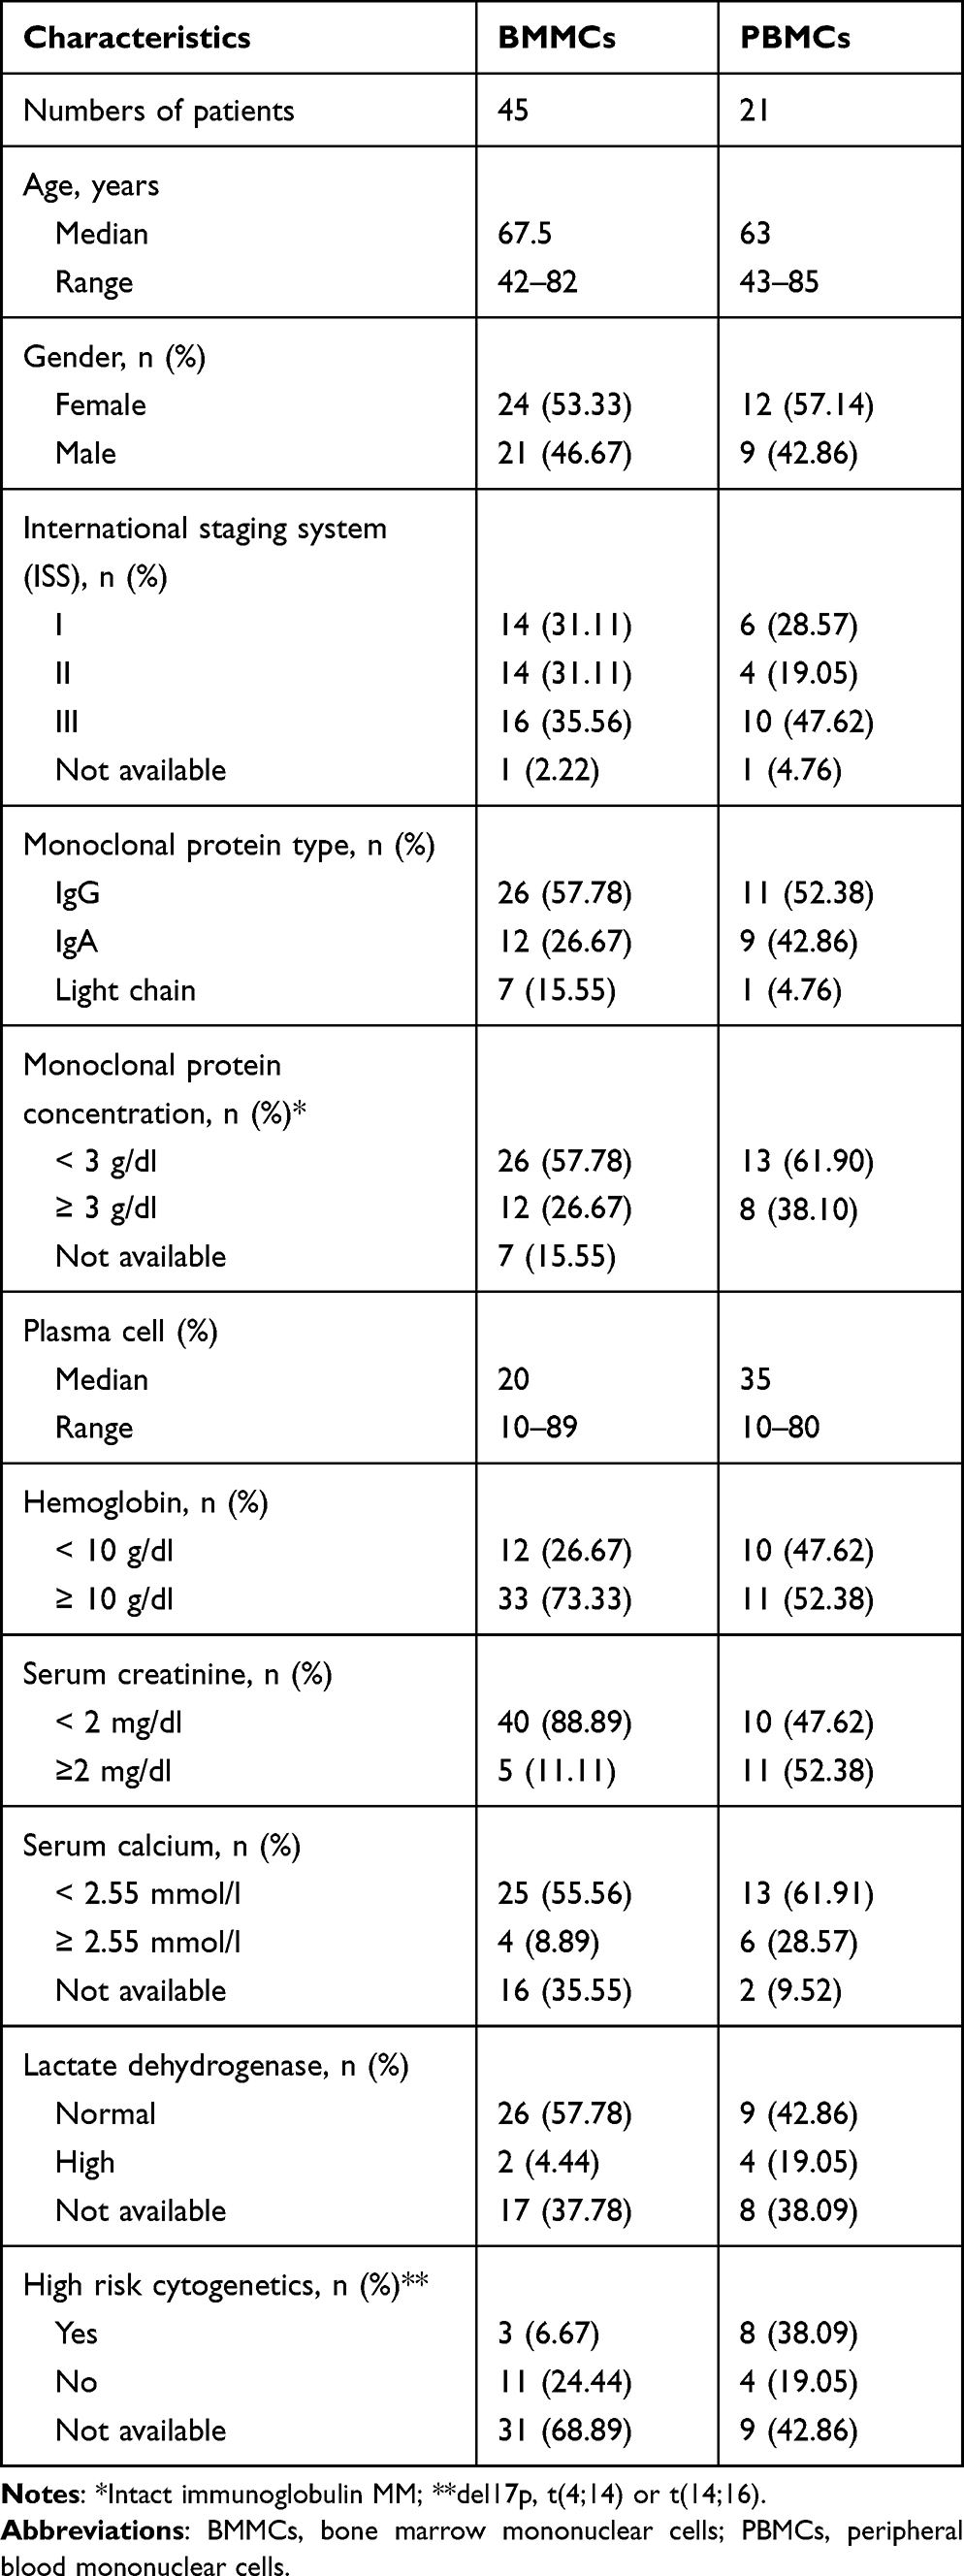 |
Table 2 Clinical Characteristics of the Groups Analyzed for PD-1 and PD-1L Expression on CD4+ and CD8+ Cells |
PB samples were also collected from 15 relapsed/refractory MM (RRMM) patients 11 female and 4 male, median age=59 (range: 47–82 years) patients before and after daratumumab monotherapy. Patients received daratumumab at a dose of 16 mg/kg, intravenously, once weekly for 8 weeks, next, once every 2 weeks for 16 weeks, and then once every 4 weeks thereafter until unacceptable toxicity or the progression of the disease. Samples were collected before treatment and after 5 cycles of daratumumab monotherapy.
As the controls, PB samples collected from 40 healthy volunteers (HVs) were used.
Isolation of PBMCs and BMMCs
Peripheral blood mononuclear cells (PBMCs) and bone marrow mononuclear cells (BMMCs) were separated using Biocoll (Biochrom AG, Berlin, Germany) density gradient centrifugation. The trypan blue dye exclusion test (SigmaAldrich Co., St. Louis, MO, USA) was used to determine the viability of obtained cells. The viable cells were quantified in a Neubauer chamber (Zeiss, Oberkochen, Germany) and stored at −80°C until the time of analysis.
mRNA Preparation and Reverse Transcription
Total RNA was extracted from BMMCs (n=38) and plasma cells (n=30) of patients with MM using QIAamp RNA Blood Mini Kit (Qiagen, Venlo, the Netherlands). From BMMCs, CD138+ plasma cells were separated by positive selection in a magnetic field using MACS Separation Technology and anti-human CD138 MicroBeads as per manufacturer’s protocol (Miltenyi Biotec, Bergisch Gladbach, Germany). Purified CD138+ cells were used for RNA isolation. The concentration and purity of isolated RNA were determined using BioSpec-nano Micro-volume UV-V spectrophotometer (Shimadzu, Kyoto, Japan). One μg of mRNA was transcribed to cDNA using a QuantiTect Reverse Transcription Kit (Qiagen, Venlo, the Netherlands) according to the manufacturer’s instruction.
Quantitative Reverse Transcriptase-Polymerase Chain Reaction (qRT-PCR) for PDCD1, PDCD1LG1, PDCD1LG2, and Their Splicing Variants
For quantitative measurements of the mRNA expression of PDCD1, CD724 (PDCD1LG1), PDCD1LG2, and their splicing variants, qRT-PCR was performed using the Light Cycler SYBR Green I technology according to the manufacturer’s protocol (Roche Diagnostics, Mannheim, Germany). For qRT-PCR, 1 μL of the cDNA of each sample was used. The sequence of primers for PDCD1 (NM_005018), PDCD1LG1 (NM_014143), and PDCD1LG2 (NM_025239) and their respective splicing variants used in qRT-PCR are described in Table 3. As a negative control, the distilled water was used. The glyceraldehyde-3-phosphate dehydrogenase (GAPDH) was used as a reference gene. The thermocycling program was run for 40 cycles of 15 sec at 95°C, 1 min at 60°C with an initial denaturation step at 95°C for 10 min on the 7500 Fast Dx Real-Time PCR instrument (Thermo Fisher Scientific). Expression levels were calculated as an inverse ratio of the difference in cycle threshold (ΔCt) method. ΔCt is the difference between the Ct value of the target gene and the Ct value of reference gene (GAPDH).
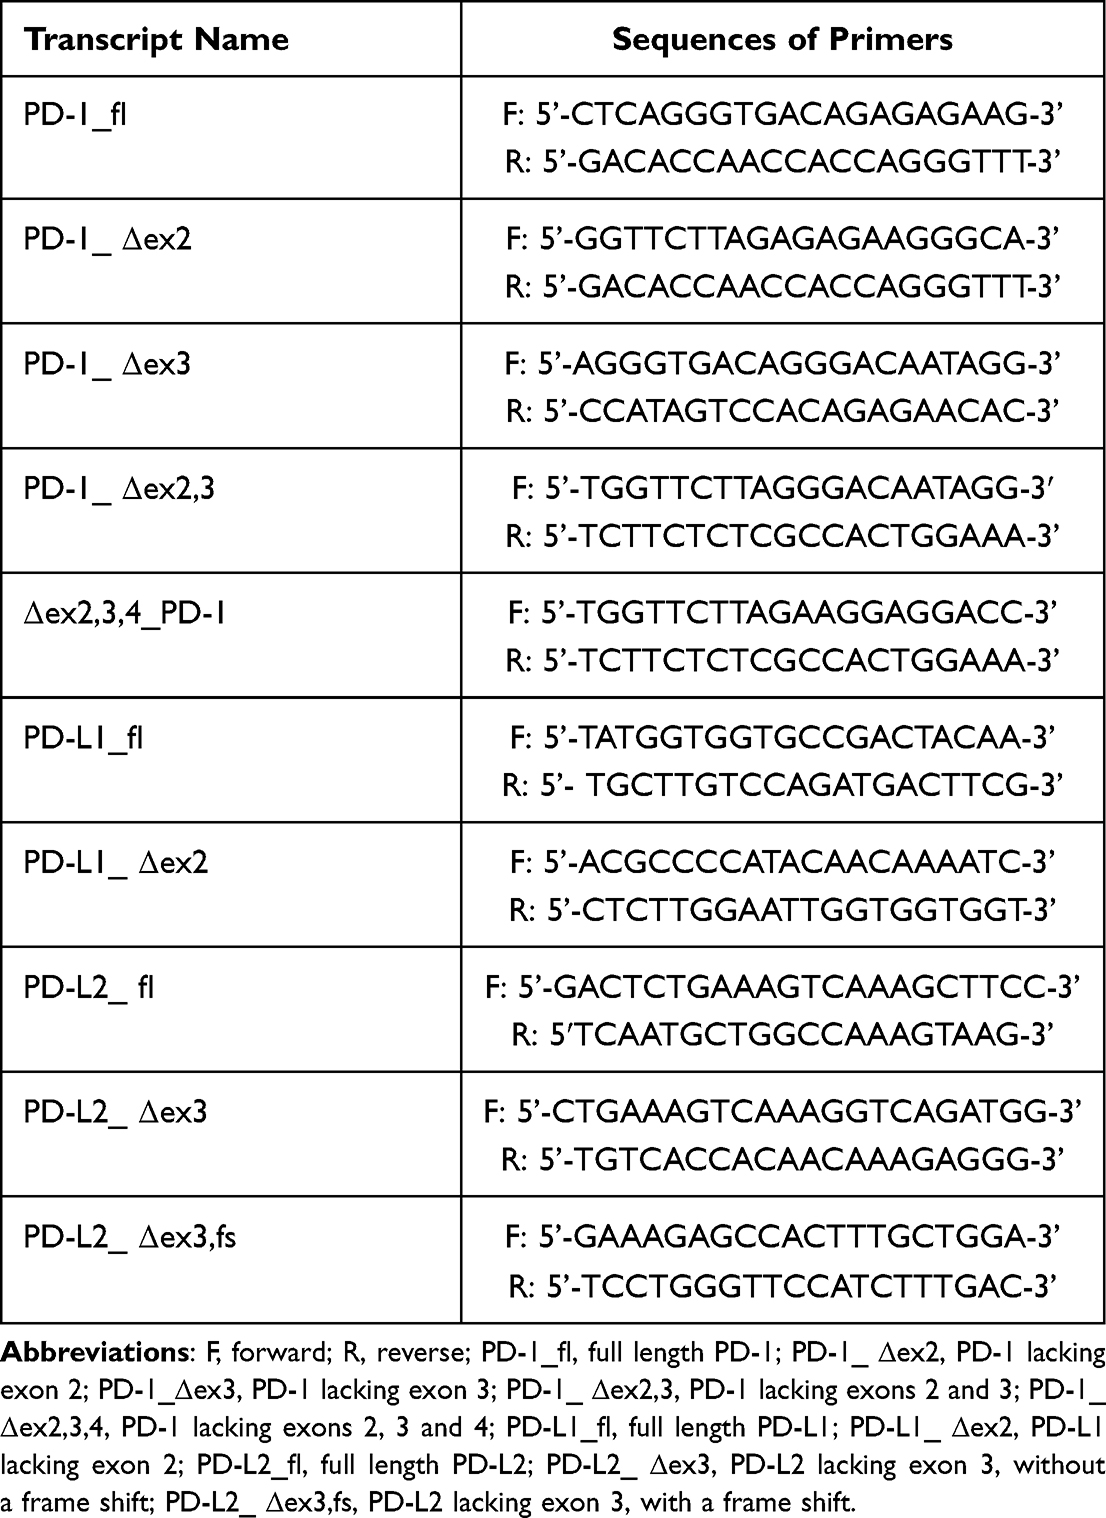 |
Table 3 Primers Sequences |
Flow Cytometric Analysis
The analysis of PD-1, PD-L1, and PD-L2 surface expression on plasma cells as well as B cells was performed on BMMCs of 98 patients. The combination of fluorescent-labeled monoclonal antibodies (Mabs) was used as follows: anti-PD-1-allophycocyanin (APC) (BD Biosciences, San Jose, CA, USA), anti-PD-L1-APC (BD Biosciences, San Jose, CA, USA), anti-PD-L2-APC (BD Biosciences, San Jose, CA, USA), anti-CD45-brilliant violet 421 (BV421) (BD Biosciences, San Jose, CA, USA), anti-CD56-BV510 (BD Biosciences, San Jose, CA, USA), anti-CD19-peridinin-chlorophyll proteins (PerCP)-Cy5.5 (BD Biosciences, San Jose, CA, USA), anti-CD138-fluorescein isothiocyanate (FITC) (BD Biosciences, San Jose, CA, USA), and anti-CD38-phycoerythrin (PE) (BD Biosciences, San Jose, CA, USA).
The expression of PD-1 and PD-L1 on CD4+ and CD8+ T cells was examined on BMMCs of 45 MM patients and PBMCs of 21 patients with MM and 30 HVs. Cells were labeled with Mabs: anti-CD3-PerCP (BD Biosciences, San Jose, CA, USA), anti-CD4-FITC (BD Biosciences, San Jose, CA, USA), anti-CD8-PE (BD Biosciences, San Jose, CA, USA), anti-PD-1-APC (BD Biosciences, San Jose, CA, USA) and anti-PD-L1-APC (BD Biosciences, San Jose, CA, USA).
After 20 min of incubation in the dark at room temperature (RT), unbound antibodies were washed off with phosphate-buffered saline (PBS) solution (Biochrom AG, Berlin, Germany), spinning cells for 5 min at 700×g. As a negative control, the unstained cells were used (for each patient). Samples were measured using FACSCanto II (BD Biosciences) flow cytometer. A minimum of 100,000 cells was acquired and analyzed. Data were analyzed using the FACSDiva 8.0 software (BD Biosciences).
Statistical Analysis
Statistical analysis was calculated with Statistica 13 PL software (StatSoft, Cracow, Poland).The data are presented as the median values with range. To evaluate the differences between subgroups of patients, the Mann-Whitney U-test was used. Correlations analyses were performed the Spearman’s rank correlation coefficient. To evaluate the differences in values before and after drug treatment, Wilcoxon matched-pairs signed-rank test was implemented. Differences were considered statistically significant if the p-value was 0.05 or less.
Results
mRNA Expression of PDCD1 and Its Splicing Variants in Patients with MM
We analyzed the mRNA levels of PDCD1 and its splicing variants by qRT-PCR using mRNA extracted from BMMCs (n=38) and plasma cells isolated from the BM (n=30) of patients with MM using 1/ΔCt analysis of the studied gene. We found that plasma cells displayed significantly lower expression of PDCD1 mRNA (PD-1_ fl) compared to BMMCs (p=0.0006). Similarly, the levels of mRNAs splicing variants lacking exon 2 (PD-1_ Δex2) and exon 3 (PD-1_Δex3) were significantly lower in plasma cells than in BMMCs (p=0.0001, p=0.0002, respectively). Also, the expression of both mRNAs splicing variants lacking exons 2, 3 (PD-1_Δex2,3) and exons 2, 3, and 4 (PD-1_ Δex2,3,4) was significantly lower in plasma cells compared to BMMCs (p=0.0013, p=0.0185, respectively). The median expression of PDCD1 and its splicing variants is presented in Table 4.
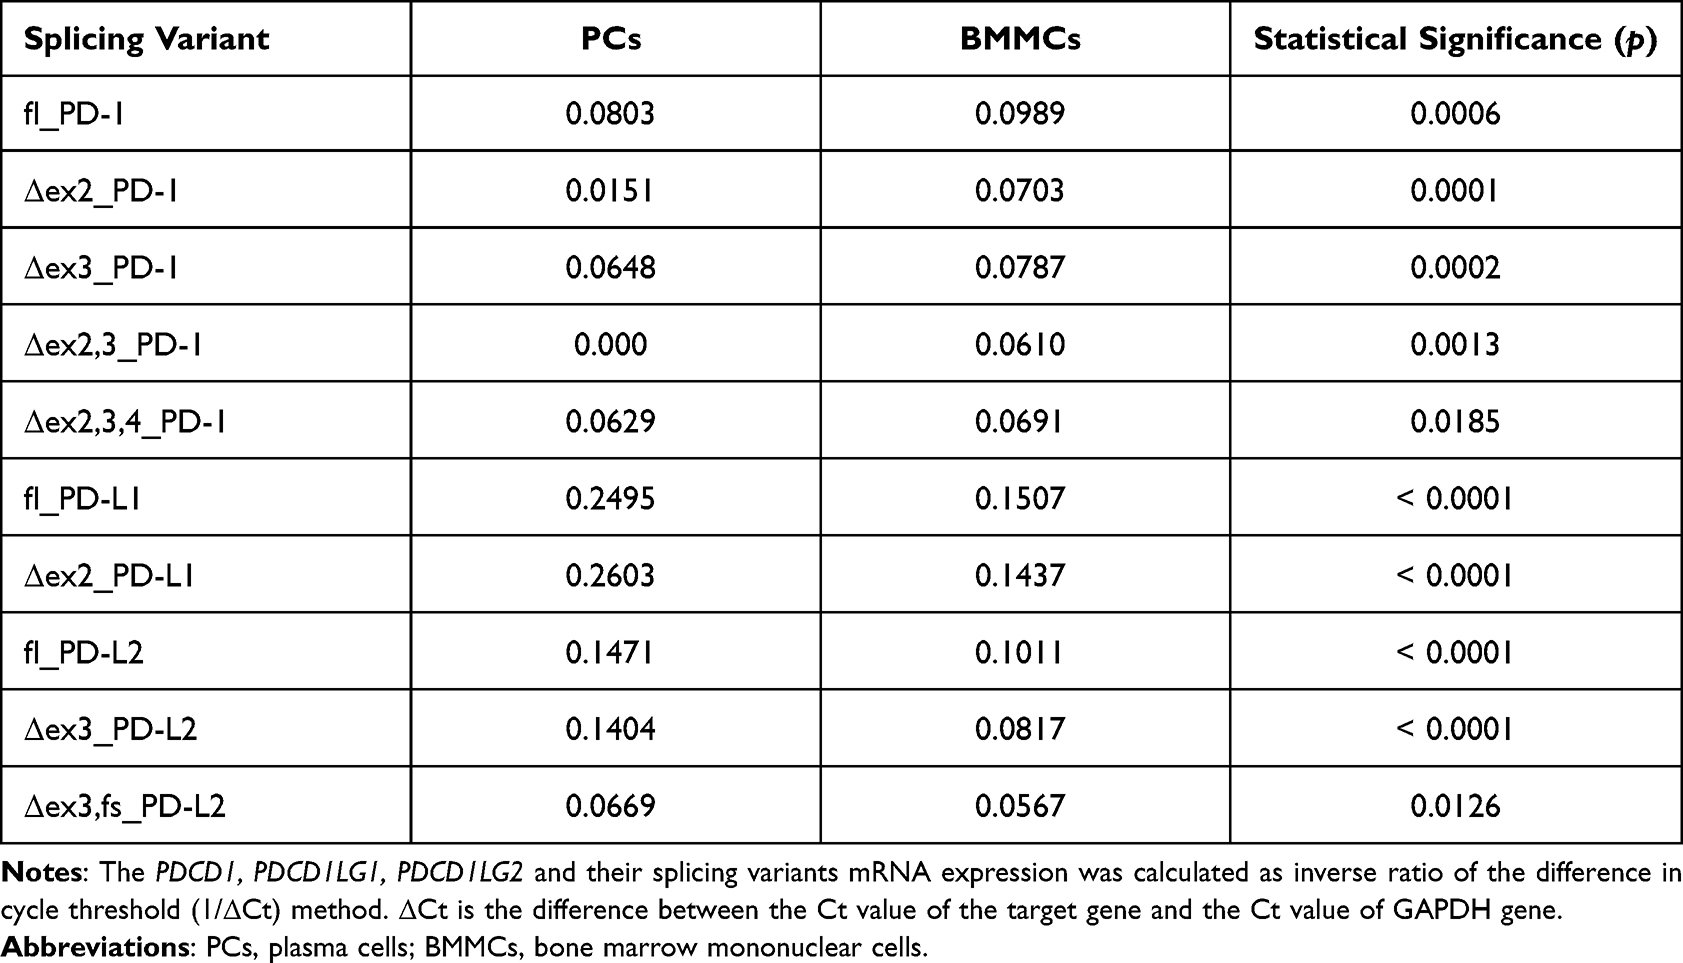 |
Table 4 Median Expression of PDCD1, PDCD1LG1, PDCD1LG2 and Their Splicing Variants |
No differences in mRNA expression of PDCD1 and its splicing variants depending on stage of disease according to the International Staging System (ISS), sex, age, serum lactate dehydrogenase level, serum β2- microglobulin level, serum monoclonal protein level, monoclonal protein type, serum creatinine level as well as plasma cell counts in BM were detected. We also did not observe differences between subgroups of patients characterized by different chromosomal aberrations.
Increased mRNA Expression of PDCD1LG1, PDCD1LG2 and Their Splicing Variants in Plasma Cells from MM Patients
The expression of the PDCD1LG1, PDCD1LG2 and their splicing variants was also analyzed in isolated plasma cells (n=30) and BMMCs (n=38). The expression of PDCD1LG1 mRNA (PD-L1_fl) in plasma cells was found to be higher as compared to BMMCs (p<0.0001). Also, the PD-L1 transcript lacking exon 2 (PD-L1_Δex2) was highly expressed in plasma cells in comparison to BMMCs (p<0.0001). The expression of PDCD1LG2 mRNA (PD-L2_fl) was significantly higher in plasma cells than in BMMCs in MM patients (p<0.0001). Similarly, the levels of mRNAs splicing variants lacking exon 3 (PD-L2_Δex3) and exon 3 leading to a frameshift (PD-L2_ Δex3,fs) were significantly higher in plasma cells compared to BMMCs (p<0.0001, p=0.0126, respectively).
The median expression of PDCD1LG1, PDCD1LG2, and their splicing variants is presented in Table 4.
Statistical analysis did not show any associations between mRNA expression of PDCD1LG, PDCD1LG2 and their splicing in plasma cells and clinical parameters, including ISS stage, serum lactate dehydrogenase level, serum monoclonal protein level, monoclonal protein type, serum creatinine level, plasma cell counts in BM as well as cytogenetic aberrations and sex. We showed a positive correlation between PD-L2_Δex3 expression in plasma cells and serum β2-microglobulin level (r=0.4389, p=0.0465) and age of MM patients (r=0.3770, p=0.0399).
The Surface Expression of PD-1 on Plasma Cells in Patients with MM
To determine the expression of PD-1 on cells surface the flow cytometry was used. BM plasma cells as well as B-cells from 98 MM patients and PB B-cells from 10 HVs were assessed. There was no significant difference between the percentage of plasma cells expressing PD-1 (=11.19%; range=0.10–58.00%) and B cells expressing PD-1 (median=8.91%; range=0.77%–74.61%, p=0.4015) in BM of MM patients (Figure 1). The percentage of PD-1-expressing B-cells derived from PB of HVs (median=2.82%; range=0.26–4.52%) was significantly lower when compared to B-cells (p=0.0003, Figure 1) and plasma cells (p=0.0003, Figure 1) of MM patients. We did not observe differences in PD-1-expressing plasma cells depending on the stage of disease according to the International Staging System (ISS) (p=0.2848), serum β2-microglobulin level (p=0.0664), serum creatinine level (p=0.6949), serum monoclonal protein (p=0.7887) nor monoclonal protein type (p=0.2877).
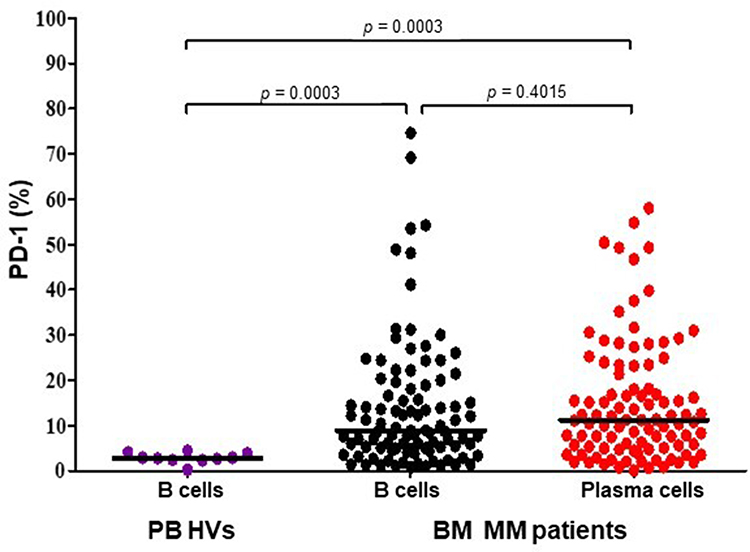 |
Figure 1 The surface expression of PD-1 on plasma cells and B cells in BM (N=98) of MM patients and B cells derived from PB of HVs (N=10). The central line shows the median. Abbreviations: PD-1, programmed death-1; PB, peripheral blood; BM, bone marrow; MM, multiple myeloma; HVs, healthy volunteers. |
Differential Protein Expression of PD-L1 and PD-L2 on Plasma Cells and B-Cells in Patients with MM
We assessed the surface expression of PD-L1 and PD-L2 on plasma cells as well as B cells from the isolated BMMCs of 98 patients with MM. The median percentage of plasma cells that expressed PD-L1 (median=18.13%; range=0.13%–97.10) was significantly higher than B cells in BM of MM patients (median=6.34%, range=0.33%–69.77%, p<0.0001, Figure 2). Statistical analyses demonstrated a positive correlation of the percentage of PD-L1-expressing plasma cells with hemoglobin (r=0.2087, p=0.0445) and age of patients (r=0.2413, p=0.0185). We also observed a positive correlation between the proportion of plasma cells expressing PD-1 and PD-L1 (r=0.475410, p=0.0001).
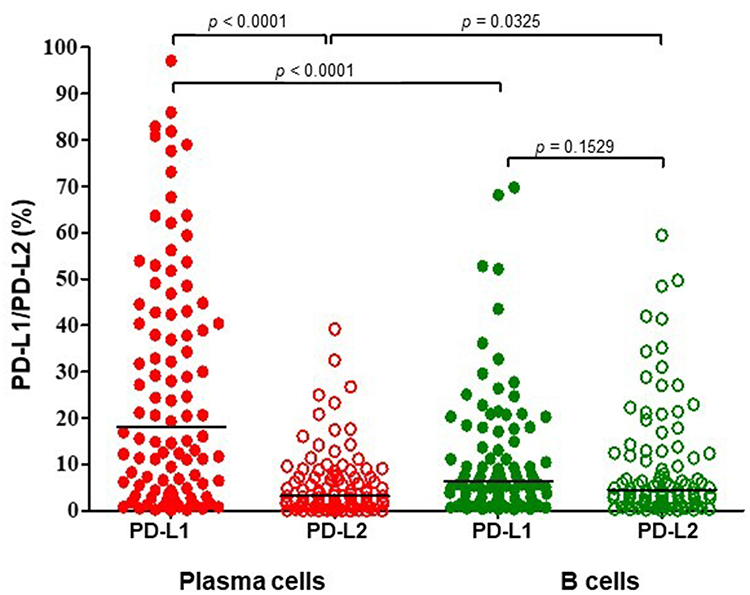 |
Figure 2 The proportion of PD-L1- and PD-L2-expressing plasma cells and B cells in the bone marrow of patients with multiple myeloma. The central line shows the median. Abbreviations: PD-L1, programmed death-1 ligand-1; PD-L2, programmed death-1 ligand-2. |
The proportion of plasma cells expressing PD-L2 was significantly lower: the median=3.19% (range=0.00–39.23%) as compared to B-cells: median=4.53% (range=0.00%–59.45%, p=0.0325, Figure 2). Statistical analysis showed an inverse correlation of the percentage of PD-L2-expressing plasma cells with plasma cell counts in BM (r=−0.2875, p=0.0088). We also observed a positive correlation of the proportion of plasma cells expressing PD-L2 with the age of MM patients (r=0.2029, p=0.0485).
Interestingly, the percentage of plasma cells expressing PD-L1 was significantly higher than plasma cells expressing PD-L2 in BM (p<0.0001), these differences were not observed on B-cells of MM patients (p=0.1529).
Increased Expression of PD-1 on BM CD8+ T Cells from MM Patients
We assessed the surface expression of PD-1 and PD-L1 on CD4+ and CD8+ T cells from BM of 45 patients with MM and from PB of 21 MM patients and 30 HVs using flow cytometry analysis. The results showed that the percentage of CD8+ cells expressing PD-1 was significantly higher than CD4+PD-1+ T cells in BM of MM patients (p<0.0001, Figure 3A). These differences were not observed in PB of MM patients (p=0.0760, Figure 3B).
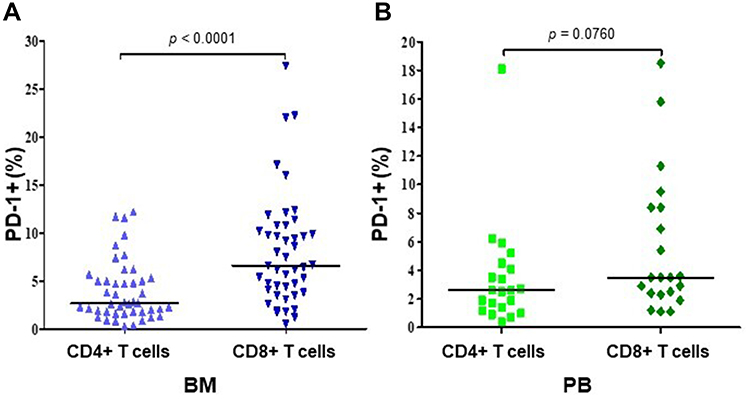 |
Figure 3 The comparison of PD-1 expression on CD4+ and CD8+ T cells in BM (N=45) (B) and PB (N=21) (A) of MM patients. The central line shows the median. Abbreviations: PD-1, programmed death-1; BM, bone marrow; PB, peripheral blood; MM, multiple myeloma. |
We found significantly higher percentage of CD8+ T cells expressing PD-1 in BM (median=6.60%, range=0.50–27.40%) in comparison with PB (median=3.50%, range=1.10%–18.50%, p=0.0334) of MM patients and HVs (median=4.48%, range=1.30%–13.38%, p=0.0152, Figure 4A). Statistical analysis showed a positive correlation of the percentage of PD-1-expressing CD8+ T cells in BM with plasma cell counts (r=0.3, p=0.0471). The proportion of CD4+ T cells with PD-1 expression in BM (median=2.70%, range=0.30–12.20%) was not significantly different in comparison with PB (median=2.60%, range=0.40%–18.10%, p=0.3634) of patients with MM as well as HVs (median=2.22%, range=0.32%–8.74%, p=0.125) (Figure 4B). In addition, our results have shown the negligible expression of PD-L1 on CD4+ and CD8+ T in BM and PB of MM patients (data not shown).
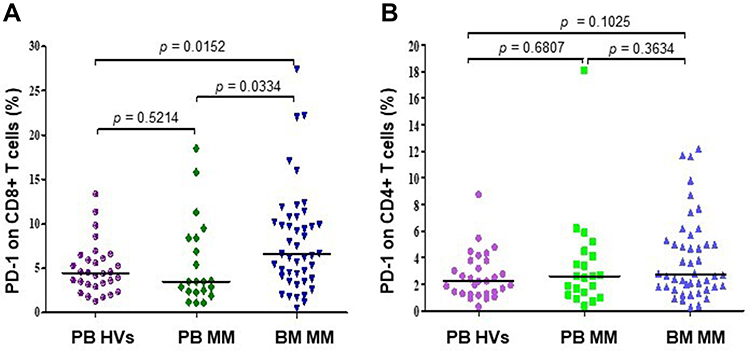 |
Figure 4 The surface expression of PD-1 on CD8+ (A) and CD4+ (B) T cells in PB (N=21) and BM (n=45) of MM patients and HVs (N=30). The central line shows the median. Abbreviations: PD-1, programmed death-1; BM, bone marrow; PB, peripheral blood; MM, multiple myeloma; HVs, healthy volunteers. |
The Surface Expression of PD-1 on CD4+ and CD8+ T Cells in Patients with RRMM After Daratumumab Treatment
The surface expression of PD-1 on CD4+ and CD8+ T cells in 15 patients with RRMM was assessed by flow cytometry before and after 5 cycles of daratumumab treatment. In the experiment, PD-1 expression on CD4+ and CD8+ T cells was displayed as the mean fluorescence intensity (MFI). In our analyses, the MFI of PD-1 on CD4+ cells in RRMM samples after the daratumumab treatment (median=197.00, range=87.00–492.00) was not significantly different in comparison with samples before the treatment (median=229.50, range=95.00–621.00, Figure 5). This difference was not statistically significant (p=0.5135). The MFI assessment of PD-1-expressing CD8 T cells in RRMM patients showed no significant difference between samples obtained before the daratumumab treatment: median=182.00 (range=101.00–392.00) and after 5 cycles of therapy: median=200.00 (range=83.00–388.00, p=0.8452, Figure 5).
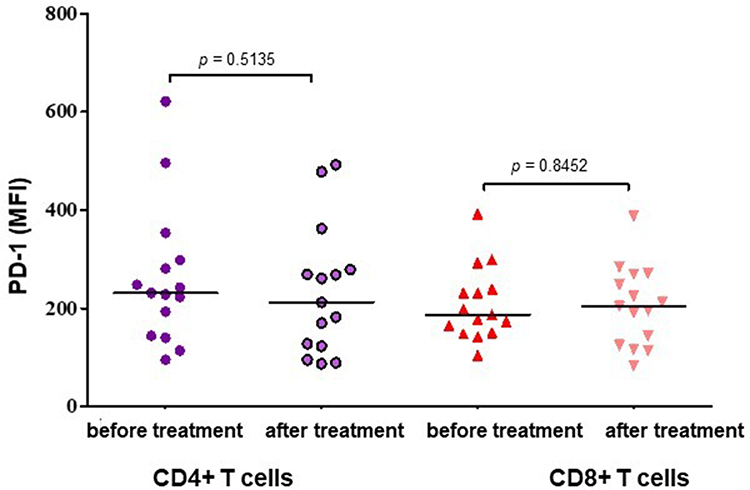 |
Figure 5 The comparison of PD-1-expression T cells determined by mean fluorescence intensity (MFI) in peripheral blood of RRMM patients before and after 5 cycles of daratumumab treatment. The central line shows the median. |
Discussion
Programmed death-1 (PD-1) and its ligands are the major regulators of the immune response in normal and pathologic conditions and have emerged as important immune-targeting strategies for the treatment of cancer. The role of PD-L1/PD-1 pathway in MM is still debated by research groups concerning especially the expression of PD-1 and PD-L1 molecules on malignant plasma cells or the immune effector cells.
Yamamoto et al18 detected increased PD-1 expression on tumor-infiltrating T cells of Hodgkin lymphoma (HL) patients and PD-1 expression on T cells in PB of HL patients were higher in comparison with those of B cell non-Hodgkin lymphoma (B-NHL) patients and HVs. Some authors observed that the circulating T cells from chronic lymphocytic leukemia (CLL) patients have elevated PD-1 expression levels compared with those from HVs.19,20 Ramsay et al21 reported that PD-1 expression on circulating T cells was significantly higher in CLL/SLL samples compared with reactive lymph node samples and linked to poor prognosis. Furthermore, in addition to the expression of PD-1 on reactive T cells, PD-1 expression was also reported on the neoplastic cells in a limited number of diffuse large B-cell (DLBCLs) lymphomas and in a more significant number of CLL/SLL.22–24 In previous studies, we found higher PD-1 expression on both the transcript and the protein level in CLL in comparison to control cells.24 Here we did not find differences between the percentage of plasma cells expressing PD-1 and B cells expressing PD-1 in BM of MM patients (11.19% vs 8.91%). Also, we observed that the expression of PDCD1 mRNA was lower in plasma cells than in BMMCs in MM patients. Nielsen et al25 described four alternatively spliced PDCD-1 mRNA transcripts: PD-1_Δex2, PD-1_Δex3, PD-1_Δex2,3 and PD-1_Δex2,3,4. PD-1_Δex2, PD-1_Δex2,3 and PD-1_Δex2,3,4 lost the ability to bind ligands due to the lack of exon 2. We found that plasma cells displayed a lower level of each PD-1 transcript compared to BMMCs. In contrast to transcripts, which do not play a crucial biological functions, PD-1_Δexon3 splice variant encodes the soluble isoform of PD-1 (sPD-1).25 sPD-1 could block the interaction between PD-1 and PD-L1 or PD-L2, and enhance the cytotoxicity of tumor-specific cytotoxic T cells (CTLs).26 sPD-1 has been detected in patients with chronic infections, autoimmune diseases and cancers and elevated levels might be associated with disease progression. The higher sPD-1 levels have been shown in HBV-related hepatocellular carcinoma (HCC) patients and was associated with worse prognosis.27 In the study of Bian et al,28 the high sPD-1 levels in patients with pancreatic adenocarcinoma were associated with the shorter survival.
Several groups have described that PD-L1 expression is present in PCs from patients with MM, but is absent on those from HVs.13,14,29,30 Liu et al31 observed the PD-L1 expression on CD138+ cells isolated from MM patients (median=23%, range=0–92%) but not in MGUS patients (median=2.05%, range=0–48%) and not on CD138+ cells from HVs (median=1%, range=0.1–2.7%). In the study of Lee et al32 found that the expression of PD-L1 in PCs evaluated by the quantitative immunofluorescence (QIF) method in combination with the clinical parameters such as age, cytogenetics, and lactate dehydrogenase effectively predicted poor prognosis in newly diagnosed MM (NDMM). A correlation between PD-L1 expression on MM cells and plasma cell counts in the bone marrow and high serum LDH levels have been reported by Tamura et al.11 However, the same authors also noticed that PD-L1 level was higher in RRMM patients and its expression correlated with drug resistance. In clinical studies, Dhodapkar et al33 reported that high PD-L1 expression on PCs of patients with MGUS or SMM has been associated with an increased risk of progression to symptomatic MM. Furthermore, Paiva et al12 found that the clonal PCs expressed higher levels of PD-L1 in patients with minimal residual disease (MRD) compared with those at diagnosis, suggesting that residual PD-L1-expressing PCs could have an increased ability to escape from immune surveillance. In our study, we found that the percentage of plasma cells expressing PD-L1 was significantly higher compared to that of B cells in BM in MM patients. In the present study, PD-L1_fl transcript was detected to be significantly elevated in plasma cells than in BMMCs of patients with MM. PD-L1_Δexon2 mRNA variant, which encodes an isoform lacking IgV domain is likely neither secreted nor functional.34
PD-L2 plays an important role in the modulation of T cell activity and might play a role in escape the surveillance of the immune system by tumor cells. In the analysis of over 400 archival tumor samples, the expression of PD-L2 protein was observed in seven tumor types and was associated with longer median survival times for both progression-free survival (PFS) and overall survival (OS).35 The results were consistent with a paper published by Wang et al36 which found a significant association between PD-L2 overexpression in tumor cells and short survival of patients with colorectal cancer. In myeloma cell line RPMI 8226, a high level of PD-L2 expression was detected, and its blocking on plasma cells significantly improved the natural killer (NK) cells cytotoxicity against myeloma cells.37 Conversely, Sponaas et al38 showed that none of the MM patients expressed PD-L2, but PD-L1 was found on plasma cells in BM of MM patients. In our study, we found a lower percentage of plasma cells that expressed PD-L2 compared to B cells in BM of MM patients. In another study, Hoffmann et al39 observed an association between PD-L2 methylation and mRNA expression levels in melanoma tissues. The high PD-L2 mRNA expression and low PD-L2 DNA methylation predicted longer progression-free survival. In our study, we found that the expression of PDCD1LG2 mRNA and its splice variants were significantly higher in plasma cells compared to BMMCs. PD-L2_ Δexon3 transcript loses Ig constant (IgC)-like domain encoded by an exon 3 and is shorter in the extracellular region. Meanwhile, PD-L2_ Δexon3,fs variant is generated through splicing out exon 3 and has a frame shift. This protein product lacks the transmembrane domain, suggesting that it might be secreted in a soluble form. Both splice variants should be able to bind PD-1 due to the presence of IgV-like domain.40 Little is known about the role and function of sPD-L2 in oncologic diseases. Interestingly, in several tumor cases, sPD-L2 levels were significantly lower than HVs.41,42 It is well established that in MM immune abnormalities not only in the B cells but also in other immune cells are observed, including the natural killer, T cells, and DCs.43 Rosenblatt et al44 reported that PD-1 expression on CD4+ and CD8+ T cells was higher in patients with advanced MM in comparison with HVs. Gorgun et al13 in their group of NDMM and RRMM patients, detected a significantly higher proportion of CD8+ T cells expressing PD-1 compared with HVs and no difference in PD-1 expression on CD4+ T cell. Our study has shown a significantly higher percentage of CD8+PD-1+ T cells in BM in comparison with PB in MM patients and HVs, while there were no significant differences in CD4+PD-1+ T cells. Conversely, Paiva et al12 showed a similar proportion of T cells that expressed PD-1 between NDMM, MGUS and HVs. However, the authors observed a significantly elevated PD-1 expression among CD4+ and CD8+ T cells in BM samples from MRD-positive and relapsing MM patients. In another study, by Chang et al45 showed that PD-1 positive T cells in BM of RRMM patients were significantly higher than those in the NDMM and partial/complete remission patients and controls. Moreover, they observed a positive correlation between PD-1+ T cells in RRMM patients and myeloma cell counts in BM and clinical stages.
The introduction of novel therapeutic agents, such as immunomodulatory drugs (IMiDs) and proteasome inhibitors have contributed to the improvement in survival in patients with MM, but most patients relapse after remission or become refractory to therapy.46,47 MM remains an incurable disease and immune checkpoint inhibitors such as anti-PD-1 or anti-PD-L1/L2 blocking antibodies could be an attractive therapeutic approach for MM patients. In vitro studies on primary cells from RRMM, described by Gorgun et al13 and Fujiwara et al48 revealed described a significant reduction of PD-1 surface expression on CD4+ and CD8+ T cells, and NK cells after treatment with both lenalidomide and pomalidomide. Interestingly, it has been described that the treatment with the daratumumab, inhibits the increase of PD-L1 expression on APCs in MM patients.49 In our study, daratumumab does not affect PD-1 expression on effect T cells, what might indicate that addition of anti-PD-1 drug to daratumumab would be beneficial. Currently, there are no clinical data on such combination but in the phase Ib trial, Skarbnik et al50 observed that combined therapy with anti-CTL-4 (ipilimumab) and nivolumab as a consolidation strategy after ASCT may increase the depth of response in patients with high-risk MM. PFS and OS at 18 months after ASCT were 85.7% and 100% for refractory DLBCL, 28.6% and 57.1% for relapsed DLBCL, 25% and 75% for relapsed TCL, 57.1% and 87% for high-risk MM, and 40% and 100% for MM relapsed after first ASCT. The combination of immunotoxin anti-CD30 (brentuximab vedotin) with anti-PD-1 (nivolumab) demonstrated the objective response rate (ORR) of 89% and complete responses (CR) rate of 50% in relapsed or refractory HL in the ECOG-ACRIN E4412 trial.51 In in vitro experiments, Verkleij et al52 noticed the nivolumab combined with immunomodulatory effects of daratumumab may lead to increased CD8+ T-cell numbers, and thereby augmented anti-tumor cytotoxicity. In another study, Chen et al53 observed that co-blockade of CD38 and PD-1 improves the antitumor immune response in lung cancer mouse models. Interestingly, this effect might be also observed in MM patients as in a previous study, we demonstrated that the percentage of CD19+CD24highCD38high Breg cells in PBMCs was significantly lower after daratumumab treatment (p<0.0003).54 Another way to improve efficacy of therapy with anti-PD-1/PD-1L might be to modulate expression of targetable molecules. It has been shown that oncolytic virus therapy can increase PD-L1 and CTLA-4 expression on tumour cells and in turn result in escape from immune surveillance. Zhang et al55 showed that the combination of anti-PD-L1 and anti-CTLA-4 with oncolytic adenoviruses can significantly inhibit tumour growth and prolong survival in a mammary tumour cell lines. This is in agreement with the studies of Wang et al56 who observed that engineered oncolytic virus is able to secrete the PD-L1 inhibitor that binds and inhibits PD-L1 on tumor cells and immune cells.
Conclusion
In conclusion, we characterized the expression of PD-1 and its ligands both on RNA and protein levels in MM patients. Our results show that the percentage of plasma cells expressing PD-1 was lower compared to B cells in the bone marrow. Furthermore, we found a high proportion of PD-L1-expressing plasma cells but a lower expression of PD-L2 on the surface of plasma cells. The expression of PD-L1 on plasma cells and a higher proportion of CD8+PD-1+ might modulate the BM immunosuppressive microenvironment in MM patients. In accordance, the PD-1 and its ligands might represent an interesting target for MM immunotherapy, as one would target both malignant plasma cells as well as the immune cells that play a key role in tumor escape mechanisms.
Data Sharing Statement
The datasets used and analyzed during the current study are available from the corresponding author on reasonable request.
Ethics Approval and Informed Consent
The study was conducted according to the guidelines of the Declaration of Helsinki, and approved by the Local Ethics Committee of the Medical University of Lublin (No.KE-0254/26/2016). Informed consent was obtained from all subjects involved in the study.
Acknowledgments
The authors would like to thank to Michał Chojnacki and Joanna Zaleska for laboratory support and Norbert Grzaśko, Marta Morawska, Paweł Kiciński, Adam Walter-Croneck, Lidia Usnarska-Zubkiewicz, Patrycja Zielińska, Krzysztof Jamroziak, Jan Maciej Zaucha, Dariusz Woszczyk, Marcin Wójtowicz, Władysława Kosmala-Niewiadomska, Justyna Kozińska, Olga Czabak and Anna Pasternak for patients recruitment and provide clinical data.
Author Contributions
All authors contributed to data analysis, drafting or revising the article, have agreed on the journal to which the article will be submitted, gave final approval of the version to be published, and agree to be accountable for all aspects of the work.
Funding
This research was funded by a grant from the Polish National Science Center UMO-2014/13/B/NZ6/02141 and Medical University of Lublin (DS462).
Disclosure
The authors report no conflicts of interest in this work.
References
1. Palumbo A, Anderson K. Multiple myeloma. N Engl J Med. 2011;364(11):1046–1060. doi:10.1056/NEJMra1011442
2. Zhang X, Schwartz J-CD, Guo X, et al. Structural and functional analysis of the costimulatory receptor programmed death-1. Immunity. 2004;20(3):337–347. doi:10.1016/s1074-7613(04)00051-2
3. Agata Y, Kawasaki A, Nishimura H, et al. Expression of the PD-1 antigen on the surface of stimulated mouse T and B lymphocytes. Int Immunol. 1996;8(5):765–772. doi:10.1093/intimm/8.5.765
4. Dai S, Jia R, Zhang X, Fang Q, Huang L. The PD-1/PD-Ls pathway and autoimmune diseases. Cell Immunol. 2014;290(1):72–79. doi:10.1016/j.cellimm.2014.05.006
5. Latchman Y, Wood CR, Chernova T, et al. PD-L2 is a second ligand for PD-1 and inhibits T cell activation. Nat Immunol. 2001;2(3):261–268. doi:10.1038/85330
6. Messal N, Serriari NE, Pastor S, Nunès JA, Olive D. PD-L2 is expressed on activated human T cells and regulates their function. Mol Immunol. 2011;48(16):2214–2219. doi:10.1016/j.molimm.2011.06.436
7. Butte MJ, Keir ME, Phamduy TB, Sharpe AH, Freeman GJ. PD-L1 interacts specifically with B7-1 to inhibit T cell proliferation. Immunity. 2009;27(1):111–122. doi:10.1016/j.immuni.2007.05.016
8. Muenst S, Schaerli AR, Gao F, et al. Expression of programmed death ligand 1 (PD-L1) is associated with poor prognosis in human breast cancer. Breast Cancer Res Treat. 2014;146(1):15–24. doi:10.1007/s10549-014-2988-5
9. Nomi T, Sho M, Akahori T, et al. Clinical significance and therapeutic potential of the programmed death-1 ligand/programmed death-1 pathway in human pancreatic cancer. Clin Cancer Res. 2007;13(7):2151–2157. doi:10.1158/1078-0432.CCR-06-2746
10. Thompson RH, Kuntz SM, Leibovich BC, et al. Tumor B7-H1 is associated with poor prognosis in renal cell carcinoma patients with long-term follow-up. Cancer Res. 2006;66(7):3381–3385. doi:10.1158/0008-5472.CAN-05-4303
11. Tamura H, Ishibashi M, Yamashita T, et al. Marrow stromal cells induce B7-H1 expression on myeloma cells, generating aggressive characteristics in multiple myeloma. Leukemia. 2013;27(2):464–472. doi:10.1038/leu.2012.213
12. Paiva B, Azpilikueta A, Puig N, et al. PD-L1/PD-1 presence in the tumor microenvironment and activity of PD-1 blockade in multiple myeloma. Leukemia. 2015;29(10):2110–2113. doi:10.1038/leu.2015.79
13. Görgün G, Samur MK, Cowens KB, et al. Lenalidomide enhances immune checkpoint blockade-induced immune response in multiple myeloma. Clin Cancer Res. 2015;21(20):4607–4618. doi:10.1158/1078-0432.CCR-15-0200
14. Benson DM, Bakan CE, Mishra A, et al. The PD-1/PD-L1 axis modulates the natural killer cell versus multiple myeloma effect: a therapeutic target for CT-011, a novel monoclonal anti-PD-1 antibody. Blood. 2010;116(13):2286–2294. doi:10.1182/blood-2010-02-271874
15. Lesokhin AM, Ansell SM, Armand P, et al. Nivolumab in patients with relapsed or refractory hematologic malignancy: preliminary results of a phase Ib study. J Clin Oncol. 2016;34(23):2698–2704. doi:10.1200/JCO.2015.65.9789
16. Chen L, Diao L, Yang Y, et al. CD38-mediated immunosuppression as a mechanism of tumor cell escape from PD-1/PD-l1 blockade. Cancer Discov. 2018;8(9):1156–1175. doi:10.1158/2159-8290.CD-17-1033
17. Morandi F, Morandi B, Horenstein AL, et al. A non-canonical adenosinergic pathway led by CD38 in human melanoma cells induces suppression of T cell proliferation. Oncotarget. 2015;6(28):25602–25618. doi:10.18632/oncotarget.4693
18. Yamamoto R, Nishikori M, Kitawaki T, et al. PD-1–PD-1 ligand interaction contributes to immunosuppressive microenvironment of Hodgkin lymphoma. Blood. 2008;111(6):3220–3224. doi:10.1182/blood-2007-05-085159
19. Brusa D, Serra S, Coscia M, et al. The PD-1/PD-L1 axis contributes to T-cell dysfunction in chronic lymphocytic leukemia. Haematologica. 2013;98(6):953–963. doi:10.3324/haematol.2012.077537
20. Riches JC, Davies JK, McClanahan F, et al. T cells from CLL patients exhibit features of T-cell exhaustion but retain capacity for cytokine production. Blood. 2013;121(9):1612–1621. doi:10.1182/blood-2012-09-457531
21. Ramsay AG, Clear AJ, Fatah R, Gribben JG. Multiple inhibitory ligands induce impaired T-cell immunologic synapse function in chronic lymphocytic leukemia that can be blocked with lenalidomide: establishing a reversible immune evasion mechanism in human cancer. Blood. 2012;120(7):1412–1421. doi:10.1182/blood-2012-02-411678
22. Laurent C, Charmpi K, Gravelle P, et al. Several immune escape patterns in non-Hodgkin’s lymphomas. Oncoimmunology. 2015;4(8):e1026530. doi:10.1080/2162402X.2015.1026530
23. Xerri L, Chetaille B, Seriari N, et al. Programmed death 1 is a marker of angioimmunoblastic T-cell lymphoma and B-cell small lymphocytic lymphoma/chronic lymphocytic leukemia. Hum Pathol. 2008;39(7):1050–1058. doi:10.1016/j.humpath.2007.11.012
24. Grzywnowicz M, Zaleska J, Mertens D, et al. Programmed death-1 and its ligand are novel immunotolerant molecules expressed on leukemic B cells in chronic lymphocytic leukemia. PLoS One. 2012;7(4):e35178. doi:10.1371/journal.pone.0035178
25. Nielsen C, Ohm-Laursen L, Barington T, Husby S, Lillevang ST. Alternative splice variants of the human PD-1 gene. Cell Immunol. 2005;235(2):109–116. doi:10.1016/j.cellimm.2005.07.007
26. He Y-F, Zhang G-M, Wang X-H, et al. Blocking programmed death-1 ligand-PD-1 interactions by local gene therapy results in enhancement of antitumor effect of secondary lymphoid tissue chemokine. J Immunol. 2004;173(8):4919–4928. doi:10.4049/jimmunol.173.8.4919
27. Li N, Zhou Z, Li F, et al. Circulating soluble programmed death-1 levels may differentiate immune-tolerant phase from other phases and hepatocellular carcinoma from other clinical diseases in chronic hepatitis B virus infection. Oncotarget. 2017;8(28):46020–46033. doi:10.18632/oncotarget.17546
28. Bian B, Fanale D, Dusetti N, et al. Prognostic significance of circulating PD-1, PD-L1, pan-BTN3As, BTN3A1 and BTLA in patients with pancreatic adenocarcinoma. Oncoimmunology. 2019;8(4):e1561120. doi:10.1080/2162402X.2018.1561120
29. Hallett WHD, Jing W, Drobyski WR, Johnson BD. Immunosuppressive effects of multiple myeloma are overcome by PD-L1 blockade. Biol Blood Marrow Transplant. 2011;17(8):1133–1145. doi:10.1016/j.bbmt.2011.03.011
30. Ray A, Das DS, Song Y, et al. Targeting PD1-PDL1 immune checkpoint in plasmacytoid dendritic cell interactions with T cells, natural killer cells and multiple myeloma cells. Leukemia. 2015;29(6):1441–1444. doi:10.1038/leu.2015.11
31. Liu J, Hamrouni A, Wolowiec D, et al. Plasma cells from multiple myeloma patients express B7-H1 (PD-L1) and increase expression after stimulation with IFN-γ and TLR ligands via a MyD88-, TRAF6-, and MEK-dependent pathway. Blood. 2007;110(1):296–304. doi:10.1182/blood-2006-10-051482
32. Lee BH, Park Y, Kim JH, et al. PD-L1 expression in bone marrow plasma cells as a biomarker to predict multiple myeloma prognosis: developing a nomogram-based prognostic model. Sci Rep. 2020;10(1):12641. doi:10.1038/s41598-020-69616-5
33. Dhodapkar MV, Sexton R, Das R, et al. Prospective analysis of antigen-specific immunity, stem-cell antigens, and immune checkpoints in monoclonal gammopathy. Blood. 2015;126(22):2475–2478. doi:10.1182/blood-2015-03-632919
34. He XH, Xu LH, Liu Y. Identification of a novel splice variant of human PD-L1 mRNA encoding an isoform-lacking Igv-like domain. Acta Pharmacol Sin. 2005;26(4):462–468. doi:10.1111/j.1745-7254.2005.00086.x
35. Yearley JH, Gibson C, Yu N, et al. PD-L2 expression in human tumors: relevance to anti-PD-1 therapy in cancer. Clin Cancer Res. 2017;23(12):3158–3167. doi:10.1158/1078-0432.CCR-16-1761
36. Wang H, Yao H, Li C, et al. PD-L2 expression in colorectal cancer: independent prognostic effect and targetability by deglycosylation. Oncoimmunology. 2017;6(7):e1327494. doi:10.1080/2162402X.2017.1327494
37. Guo Y, Feng X, Jiang Y, et al. PD1 blockade enhances cytotoxicity of in vitro expanded natural killer cells towards myeloma cells. Oncotarget. 2016;7(30):48360–48374. doi:10.18632/oncotarget.10235
38. Sponaas AM, Moharrami NN, Feyzi E, et al. PDL1 expression on plasma and dendritic cells in myeloma bone marrow suggests benefit of targeted anti PD1-PDL1 therapy. PLoS One. 2015;10(10):e0139867. doi:10.1371/journal.pone.0139867
39. Hoffmann F, Zarbl R, Niebel D, et al. Prognostic and predictive value of PD-L2 DNA methylation and mRNA expression in melanoma. Clin Epigenetics. 2020;12(1):94. doi:10.1186/s13148-020-00883-9
40. He XH, Liu Y, Xu LH, Zeng YY. Cloning and identification of two novel splice variants of human PD-L2. Acta Biochim Biophys Sin. 2004;36(4):284–289. doi:10.1093/abbs/36.4.284
41. Buderath P, Schwich E, Jensen C, et al. Soluble programmed death receptor ligands sPD-L1 and sPD-L2 as liquid biopsy markers for prognosis and platinum response in epithelial ovarian cancer. Front Oncol. 2019;9:1015. doi:10.3389/fonc.2019.01015
42. Mortensen JB, Yoanna V, Monrad Hansen I, Bjerre M, d’Amore F. Characterization of soluble immune checkpoint protein PD-1, PD-L1 and PD-L2 levels in different types of lymphoid malignancies. Blood. 2018;132(Supplement 1):5306. doi:10.1182/blood-2018-99-114509
43. Romano A, Conticello C, Cavalli M, et al. Immunological dysregulation in multiple myeloma microenvironment. Biomed Res Int. 2014;2014:198539. doi:10.1155/2014/198539
44. Rosenblatt J, Glotzbecker B, Mills H, et al. PD-1 blockade by CT-011, anti-PD-1 antibody, enhances ex vivo T-cell responses to autologous dendritic cell/myeloma fusion vaccine. J Immunother. 2011;34(5):409–418. doi:10.1097/CJI.0b013e31821ca6ce
45. Chang Y, Jiang Y, Chen Y, et al. Bone marrow PD-1 positive T cells reflect tumor mass and prognosis in multiple myeloma. Int J Clin Exp Pathol. 2018;11(1):304–313.
46. Ravi P, Kumar SK, Cerhan JR, et al. Defining cure in multiple myeloma: a comparative study of outcomes of young individuals with myeloma and curable hematologic malignancies. Blood Cancer J. 2018;8(3):26. doi:10.1038/s41408-018-0065-8
47. Costa LJ, Brill IK, Omel J, Godby K, Kumar SK, Brown EE. Recent trends in multiple myeloma incidence and survival by age, race, and ethnicity in the United States. Blood Adv. 2017;1(4):282–287. doi:10.1182/bloodadvances.2016002493
48. Fujiwara Y, Sun Y, Torphy RJ, et al. Pomalidomide inhibits PD-L1 induction to promote antitumor immunity. Cancer Res. 2018;78(23):6655–6665. doi:10.1158/0008-5472.CAN-18-1781
49. Stocker N, Gaugler B, Ricard L, et al. Daratumumab prevents programmed death ligand-1 expression on antigen-presenting cells in de novo multiple myeloma. Cancer Med. 2020;9(6):2077–2084. doi:10.1002/cam4.2827
50. Skarbnik AP, Donato ML, Feinman R, et al. Safety and efficacy of consolidation therapy with ipilimumab plus nivolumab after autologous stem cell transplantation. Transplant Cell Ther. 2021;27(5):391–403. doi:10.1016/j.jtct.2020.12.026
51. Diefenbach CS, Hong F, David K, et al. Safety and efficacy of combination of brentuximab vedotin and nivolumab in relapsed/refractory Hodgkin lymphoma: a trial of the ECOG-ACRIN cancer research group (E4412). Hematol Oncol. 2017;35(S2):84–85. doi:10.1002/hon.2437_72
52. Verkleij CPM, Jhatakia A, Broekmans MEC, et al. Preclinical rationale for targeting the PD-1/PD-L1 axis in combination with a CD38 antibody in multiple myeloma and other CD38-positive malignancies. Cancers. 2020;12(12):3713. doi:10.3390/cancers12123713
53. Chen L, Diao L, Yang Y, et al. CD38-mediated immunosuppression as a mechanism of tumor cell escape from PD-1/PD-L1 blockade. Cancer Discov. 2018;8(9):1156–1175. doi:10.1158/2159-8290.CD-17-1033
54. Bartosinska J, Purkot J, Karczmarczyk A, et al. Differential function of a novel population of the CD19+CD24hiCD38hi Bregs in psoriasis and multiple myeloma. Cells. 2021;10(2):411. doi:10.3390/cells10020411
55. Zhang H, Xie W, Zhang Y, et al. Oncolytic adenoviruses synergistically enhance anti-PD-L1 and anti-CTLA-4 immunotherapy by modulating the tumour microenvironment in a 4T1 orthotopic mouse model. Cancer Gene Ther. 2021. doi:10.1038/s41417-021-00389-3
56. Wang G, Kang X, Chen KS, et al. An engineered oncolytic virus expressing PD-L1 inhibitors activates tumor neoantigen-specific T cell responses. Nat Commun. 2020;11(1):1395. doi:10.1038/s41467-020-15229-5
 © 2022 The Author(s). This work is published and licensed by Dove Medical Press Limited. The
full terms of this license are available at https://www.dovepress.com/terms
and incorporate the Creative Commons Attribution
- Non Commercial (unported, 3.0) License.
By accessing the work you hereby accept the Terms. Non-commercial uses of the work are permitted
without any further permission from Dove Medical Press Limited, provided the work is properly
attributed. For permission for commercial use of this work, please see paragraphs 4.2 and 5 of our Terms.
© 2022 The Author(s). This work is published and licensed by Dove Medical Press Limited. The
full terms of this license are available at https://www.dovepress.com/terms
and incorporate the Creative Commons Attribution
- Non Commercial (unported, 3.0) License.
By accessing the work you hereby accept the Terms. Non-commercial uses of the work are permitted
without any further permission from Dove Medical Press Limited, provided the work is properly
attributed. For permission for commercial use of this work, please see paragraphs 4.2 and 5 of our Terms.