Back to Journals » Therapeutics and Clinical Risk Management » Volume 16
Prognostic Values of Three Equations in Estimating Glomerular Filtration Rates of Patients Undergoing Off-Pump Coronary Artery Bypass Grafting
Authors Li Z ![]() , Ge W, Han C, Lv M
, Ge W, Han C, Lv M ![]() , He Y, Su J, Liu B, Zhang Y
, He Y, Su J, Liu B, Zhang Y ![]()
Received 7 February 2020
Accepted for publication 17 April 2020
Published 21 May 2020 Volume 2020:16 Pages 451—459
DOI https://doi.org/10.2147/TCRM.S248710
Checked for plagiarism Yes
Review by Single anonymous peer review
Peer reviewer comments 2
Editor who approved publication: Professor De Yun Wang
Zhi Li,1,* Wen Ge,2,* Chunyan Han,3,* Mengwei Lv,4,5,* Yanzhong He,5 Juntao Su,6 Ban Liu,3 Yangyang Zhang5
1Department of Cardiovascular Surgery, Jiangsu Province Hospital, The First Affiliated Hospital of Nanjing Medical University, Nanjing, People’s Republic of China; 2Department of Thoracic and Cardiovascular Surgery, Shuguang Hospital, Shanghai University of TCM, Shanghai, People’s Republic of China; 3Department of Cardiology, Shanghai Tenth People’s Hospital, Tongji University School of Medicine, Shanghai, People’s Republic of China; 4Shanghai East Hospital of Clinical Medicine College, Nanjing Medical University, Shanghai, People’s Republic of China; 5Department of Cardiovascular Surgery, Shanghai East Hospital, Tongji University School of Medicine, Shanghai, People’s Republic of China; 6Tongji University School of Medicine, Shanghai, People’s Republic of China
*These authors contributed equally to this work
Correspondence: Yangyang Zhang; Ban Liu Email [email protected]; [email protected]
Background: Renal dysfunction is independently associated with both short-term and long-term mortality after coronary artery bypass grafting (CABG). The estimated glomerular filtration rate (eGFR) is a convenient and effective indicator of renal function. However, the ability of eGFR calculated by various equations to predict the outcomes of patients undergoing off-pump CABG (OPCABG) is still unclear. This study was aimed to compare the predictive ability of in-hospital and long-term mortality in three equations of estimating renal functions after OPCABG.
Methods: Totally, 1362 patients undergoing OPCABG were retrospectively reviewed. Preoperative and postoperative serum creatinine (Scr) levels were detected. The renal function was evaluated by the Cockcroft-Gault (CG) equation, the Chronic Kidney Disease Epidemiology Collaboration (CKD-EPI) equation, and the full-age spectrum (FAS) equation. The endpoints were in-hospital and long-term all-cause mortality rates. Receiver operating characteristic curves, net reclassification index, decision curve analysis (DCA), multivariable logistic model, and Cox regression model were used for comparisons.
Results: The CG equation had the significantly highest discriminatory power to predict in-hospital mortality (area under the curve=0.815). Valuable clinical net benefits of the CG equation were greater than the other two equations regardless of before or after operation by DCA. Multivariable logistic and Cox regression analysis illustrated that the eGFR calculated by the CG equation was a significant independent risk factor of both in-hospital mortality (odds ratio=3.390) and long-term mortality (hazard ratio=1.553).
Conclusion: The CG equation outperformed the FAS and CKD-EPI equations in predicting the mortality of patients after OPCABG. Postoperative renal function was more efficiently predicted compared with the preoperative one.
Keywords: coronary artery bypass grafting, off-pump, estimated glomerular filtration rate, mortality
Introduction
The glomerular filtration rate (GFR) is an ideal indicator of renal function. Due to the complexity and economy of GFR measurement, various alternative formulas to calculate GFR have been recommended in clinical practice.1 Serum creatinine (Scr) is a very common clinical examination and GFR can be estimated by several Scr-based equations, such as the Chronic Kidney Disease Epidemiology Collaboration (CKD-EPI) equation and the full-age spectrum (FAS) equation. The serum creatinine clearance can be calculated by the Cockcroft-Gault (CG) equation.2–5 In clinical practice, serum creatinine clearance is often used to replace GFR.
Coronary heart disease (CAD) is a frequently-occurring disease that seriously threatens the life and health of humans. Coronary artery bypass grafting (CABG) is an effective treatment for severe CAD and off-pump CABG (OPCABG) is the common cardiac surgical procedure in China.6,7 Many reports focus on the accuracy of the equations above to estimate GFR.8–10 However, the higher accuracy of GFR does not necessarily mean the better predicting of postoperative outcomes. To the best of our knowledge, few studies have evaluated the prognosis ability of those estimated GFR (eGFR) equations in a cohort of patients undergoing OPCABG. The aim of this study was to assess and compare the predictive power of the CG, CKD-EPI, and FAS equations applied to patients undergoing OPCABG.
Methods
Patients
This retrospective observational study involved consecutive patients undergoing CABG in the Department of Cardiovascular Surgery between August 2005 and October 2018. The exclusion criteria were as follows:
(I) under 18 years old; (II) preoperative treatment with any type of renal replacement therapy; (III) any type of cardiac surgery preoperatively; (IV) CABG combined other cardiac surgery; (V) requiring cardiopulmonary bypass; (VI) incomplete medical records.
Finally, this study enrolled 1362 individuals. All clinical information was obtained from medical records and the hospital information system, and all data were de-identified. All patients were operated by the same group of surgeons. This study was approved by the respective Ethics Committee of Shanghai East Hospital (ID 2018101) and registered at www.chictr.org.cn (No.ChiCTR1800020130).
Measurements of eGFR
Preoperative Scr levels in µmol/L (within 48 hours before operation and more than 7 days prior to coronary angiography) of all patients were measured by standard techniques in the central laboratory of the hospital. The Scr levels of all patients on the first day after operation were also obtained and were used to determine the postoperative eGFR. The reference interval of Scr was 44 to 132 µmol/L. eGFR was calculated separately by three common equations: CG equation, CKD-EPI equation, and FAS equation. All those equations were adjusted with body surface area (BSA).
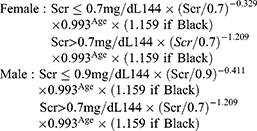
The CG equation is as follows:3

The CKD-EPI equation is as follows:4
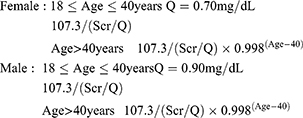
The FAS equation is as follows:5
The BSA was calculated as follows:11

According to the Kidney Disease Improving Global Outcomes (KDIGO) guideline 2012,1 renal function was defined by GFR (in mL/min/1.73 m2) as normal (GFR≥90), mild (60≤GFR<90), moderate (30≤GFR<60), severe (15≤GFR<30), and failure (GFR<15).
The three equations were used separately to calculate eGFR of each patient both before and after operation. According to the KDIGO2012 guideline, the patients were divided into groups I to IV, which corresponded to normal, mild, moderate, severe, and failed renal function, respectively.
Statistical Analysis
Continuous data were presented as mean±standard deviation (normally distributed) or median and interquartile ranges (not normally distributed). Comparisons among groups were performed using Student’s t test or Mann–Whitney U-test. Categorical variables were expressed as number and percentage and compared using Fisher’s exact test or Chi-square test.
Bland–Altman plots were drawn to evaluate mean differences and 95% limits of agreement of eGFR estimated by the three equations. The degree of categorical agreement with the KDIGO guideline was studied using weight kappa values. The kappa value<0.20, 0.21–0.40, 0.41–0.60, 0.61–0.80, and >0.81 indicated the categorical agreement was poor, fair, moderate, good, and excellent, respectively.12
Net reclassification index (NRI) was calculated to detect the consistency of the three equations in predicting mortality. According to the method described by Pencina et al,13 patients were divided into four groups based on eGFR. Both preoperative and postoperative eGFRs were calculated. A change into a higher eGFR group means upward movement (up), and a change into a lower eGFR group means downward movement (down). The NRI was calculated as follows:
NRI = P (up|event) -P (down|event) +P (down|nonevent) -P (up|nonevent)
Receiver operating characteristic (ROC) analysis was used to evaluate the ability of each equation to predict postoperative prognosis. The area under the ROC curve (AUC) was used to compare the diagnostic accuracy of each equation according to the Delong test. Decision curve analysis (DCA) was used to calculate the clinical practicability. The net benefits of the three equations were assessed after joining the baseline in the way of DCA weighed by the relative harm of a false-positive and false-negative result.14
Multivariable logistic regression and multivariable Cox regression analysis were employed to identify independent predictors of in-hospital mortality and long-term mortality. All variables with P<0.25 or clinically considered as risk factors were entered into the multivariable logistic regression model, including age, gender, weight, hyperlipemia, type of CAD, hypertension, cerebrovascular disease, left ventricular ejection fraction (LVEF), number of diseased coronary vessels, pulmonary hypertension, chronic obstructive pulmonary disease (COPD), and previous percutaneous coronary intervention (PCI). Multivariable Cox proportional hazards models were adjusted by relevant confounders, including age, gender, weight, New York Heart Association (NYHA) stage, hyperlipemia, type of CAD, hypertension, diabetes, cerebrovascular disease, LVEF, number of diseased coronary vessels, peripheral vascular disease, pulmonary hypertension, previous PCI, number of bypass graft, postoperative acute kidney injury (AKI) and COPD. These regression models were created to compare the CG, CKD-EPI, and FAS equations in predicting in-hospital mortality and long-term mortality. Odds ratio and hazard ratio were shown with 95% confidence intervals (CIs). The Kaplan–Meier method illustrated the cumulative incidence of the four groups. Differences among groups were assessed by a Log-rank test.
Statistical analysis was performed on SPSS22.0 for windows (IBM, Chicago, USA). Two-sided P≤0.05 was considered statistically significant. DCA was conducted on R software 3.4.0 (the F Foundation for Statistical Computing, Jersey, Austria) with package Decision curve.
Outcome
The primary outcome was in-hospital mortality, which was defined as death from any cause during hospitalization or within 30 days after operation. The secondary outcome was long-term mortality, including cardiac and renal mortality during the follow-up period.
Follow-Up
According to the follow-up criteria of the hospital, surviving discharged patients were revised in the outpatient clinic or through telephone consultation firstly at one and three months after discharge and then at an interval of six months. Survival rates and the cause of death were the main events analyzed.
Results
A total of 1362 patients undergoing OPCABG were enrolled, including 1059 males and 303 females with median age of 66 (60; 71) years. The median levels of preoperative and postoperative Scr were 77.60 (65.50; 91.00) and 69.63 (56.43; 88.09) µmol/L, respectively. Detailed demographics and clinical characteristics of the total cohort are revealed in Table 1. A total of 28 (2.1%) patients died in hospital after operation. According to the three equations, in-hospital mortality rates in group IV were 14.3%, 10.0%, and 10.5%, respectively, which were significantly higher than in other groups (Table S1). The mortality increased with the degree of renal insufficiency and the trends were consistent among the equations (Figure 1).
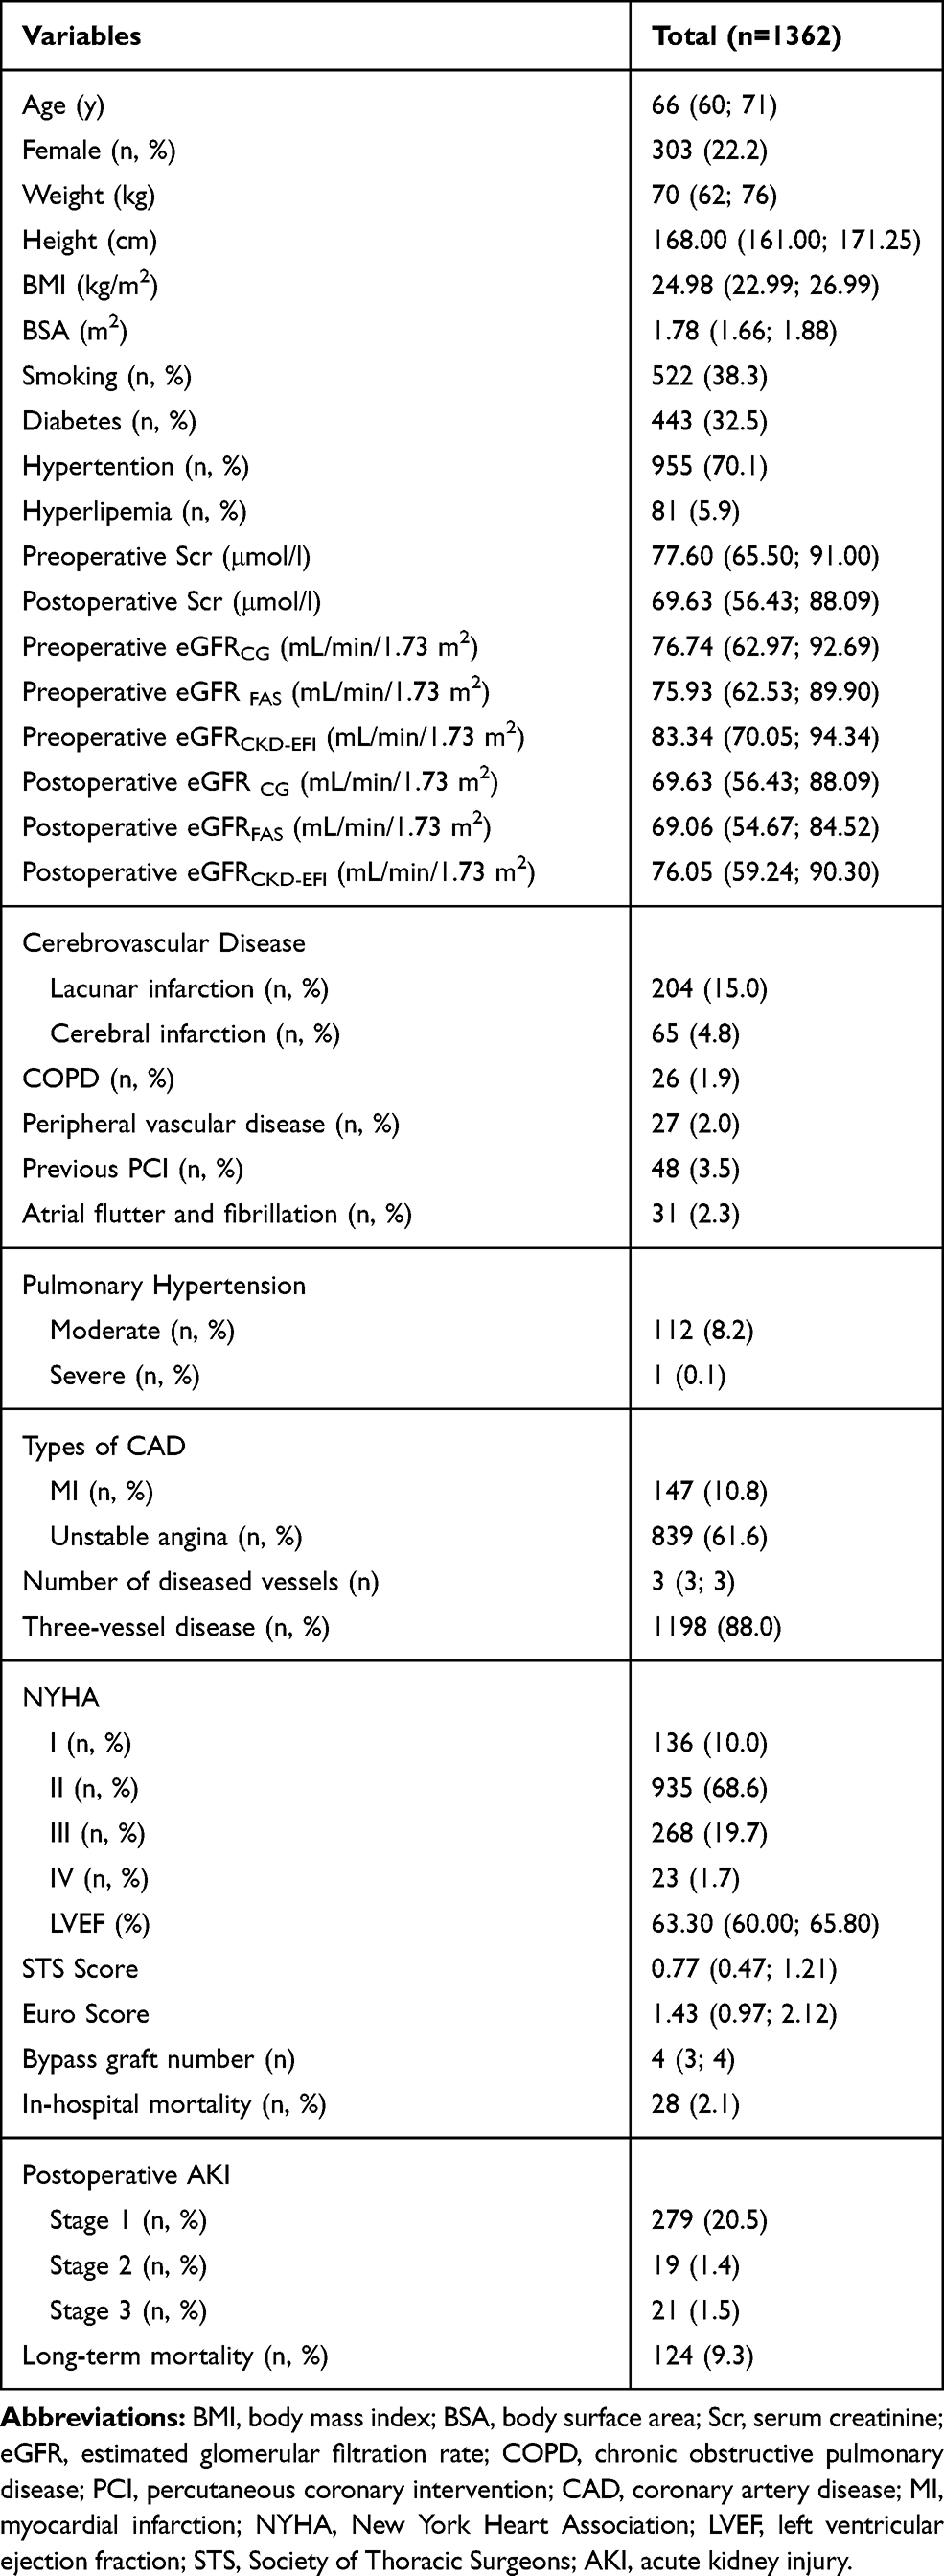 |
Table 1 Demographics and Clinical Characteristics of Total Cohort |
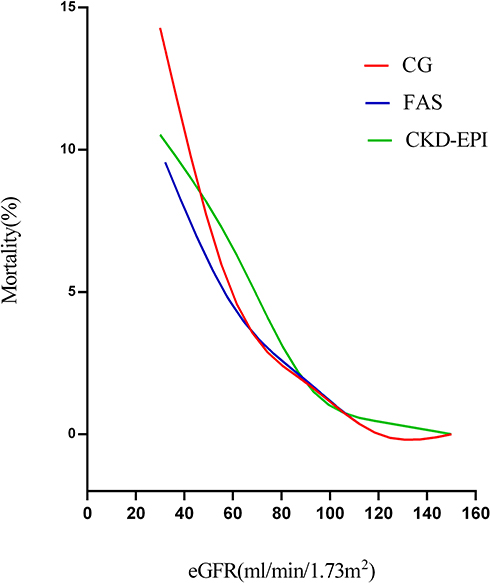 |
Figure 1 Fitting curve for the mortality increased with the degree of renal insufficiency by 3 eGFR equations: CG, FAS, and CKD-EPI. |
Bland–Altman plot showed that the agreements of the three equations were satisfactory (Figure 2). The CG equation showed good agreements in the range of eGFR < 60 mL/min/1.73m2, but the CKD-EPI and FAS equations displayed good consistency at eGFR<100 mL/min/1.73 m2.
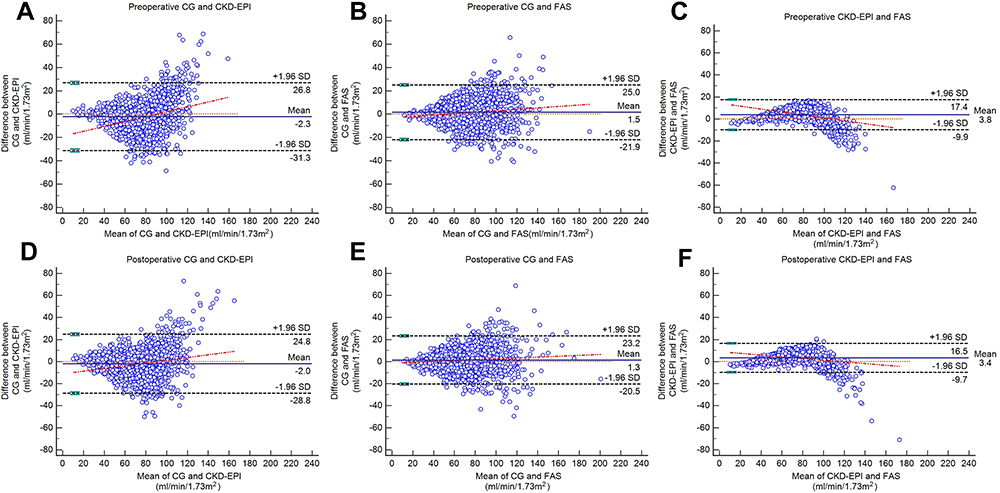 |
Figure 2 Bland–Altman plots for the difference between 3 eGFR equations. Preoperative and postoperative eGFR were calculated and analyzed, respectively. (A) The Bland–Altman plot determined by preoperative CG and CKD-EPI; (B) the Bland–Altman plot determined by preoperative CG and FAS; (C) the Bland–Altman plot determined by preoperative CKD-EPI and FAS; (D) the Bland–Altman plot determined by postoperative CG and CKD-EPI; (E) the Bland–Altman plot determined by postoperative CG and FAS; (F) the Bland–Altman plot determined by postoperative CKD-EPI and FAS. |
Preoperative eGFR and postoperative eGFR as the only variables in ROC analysis were used to evaluate and compare the ability to predict in-hospital mortality. The preoperative and postoperative AUCs are shown in Table 2. The CG equation had the highest prediction ability for both preoperative eGFR and postoperative eGFR, compared with the other equations (preoperative AUC, 0.815; 95% CI 0.756-0.874 P<0.001 and postoperative AUC, 0.857; 95% CI 0.809-0.905, P<0.001).
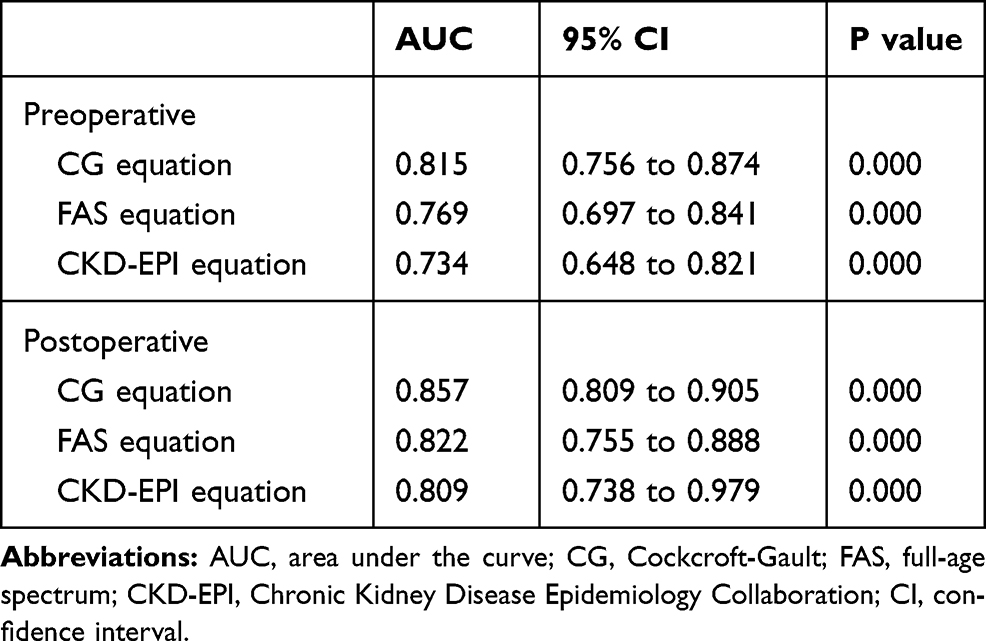 |
Table 2 Comparison of AUC for CG, FAS, and CKD-EPI Equations |
Based on the preoperative eGFR, no significant differences in NRI were found among the three equations. However, it was better for the CG equation compared to the other two equations. According to the postoperative eGFR, there was a better NRI for the CG equation compared to the FAS equation (P<0.0158). No significant NRI was found in CG versus CKD-EPI or FAS versus CKD-EPI. It was also a tendency that it was better NRI for CG compared to CKD-EPI (Table 3).
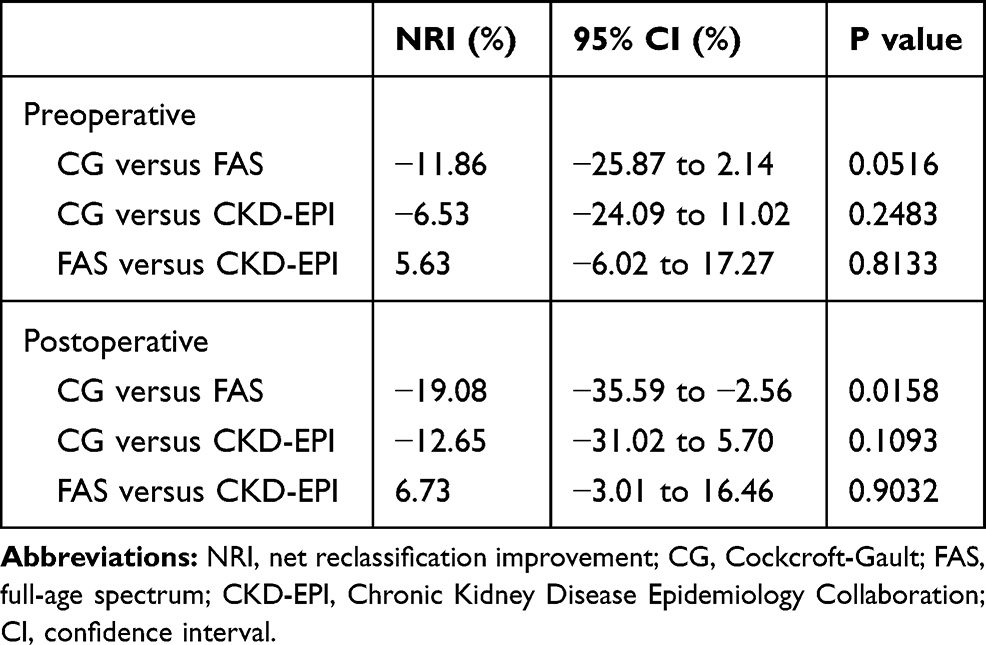 |
Table 3 Comparison of NRI for CG, FAS, and CKD-EPI Equations |
The clinical benefits of preoperative eGFR and postoperative eGFR calculated by the three equations in predicting in-hospital mortality were analyzed by DCA. The preoperative eGFRs of the FAS and CKD-EPI equations were close to the decision curves, and their net benefits were significantly smaller than the eGFR of the CG equation between 1.5% and 4.8% (Figure 3A). The net benefit of postoperative eGFR estimated by the CG equation was also greater than the other two equations between 0% and 3.2% (Figure 3B).
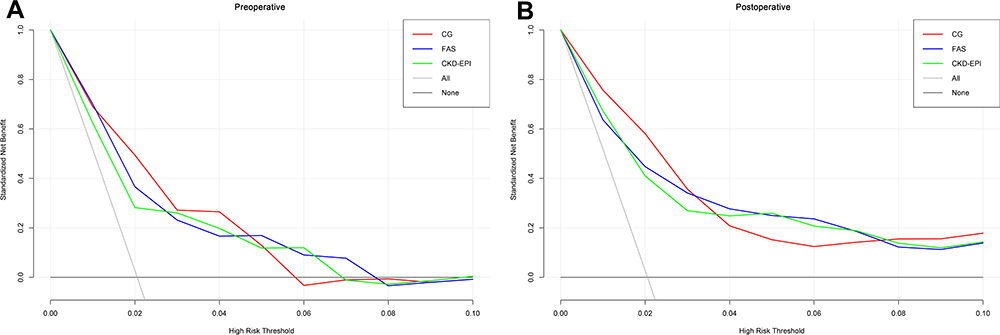 |
Figure 3 Decision curve analysis for the in-hospital death by 3 eGFR equations: CG, FAS, and CKD-EPI. (A) The decision curves determined by preoperative eGFR; (B) the decision curves determined by postoperative eGFR. |
Multivariate logistic regression models were used to identify independent risk factors of in-hospital mortality. Regardless of the eGFR equations, renal insufficiency as low eGFR was a significant risk factor for postoperative mortality. Preoperative eGFR calculated by the CG equation had the maximum OR of 3.390 in predicting in-hospital mortality, followed by the CKD-EPI equation (3.186) and the FAS equation (2.930). The same comparisons in postoperative eGFR showed the CG equation still had the best predictive power with OR of 8.041 (Table 4).
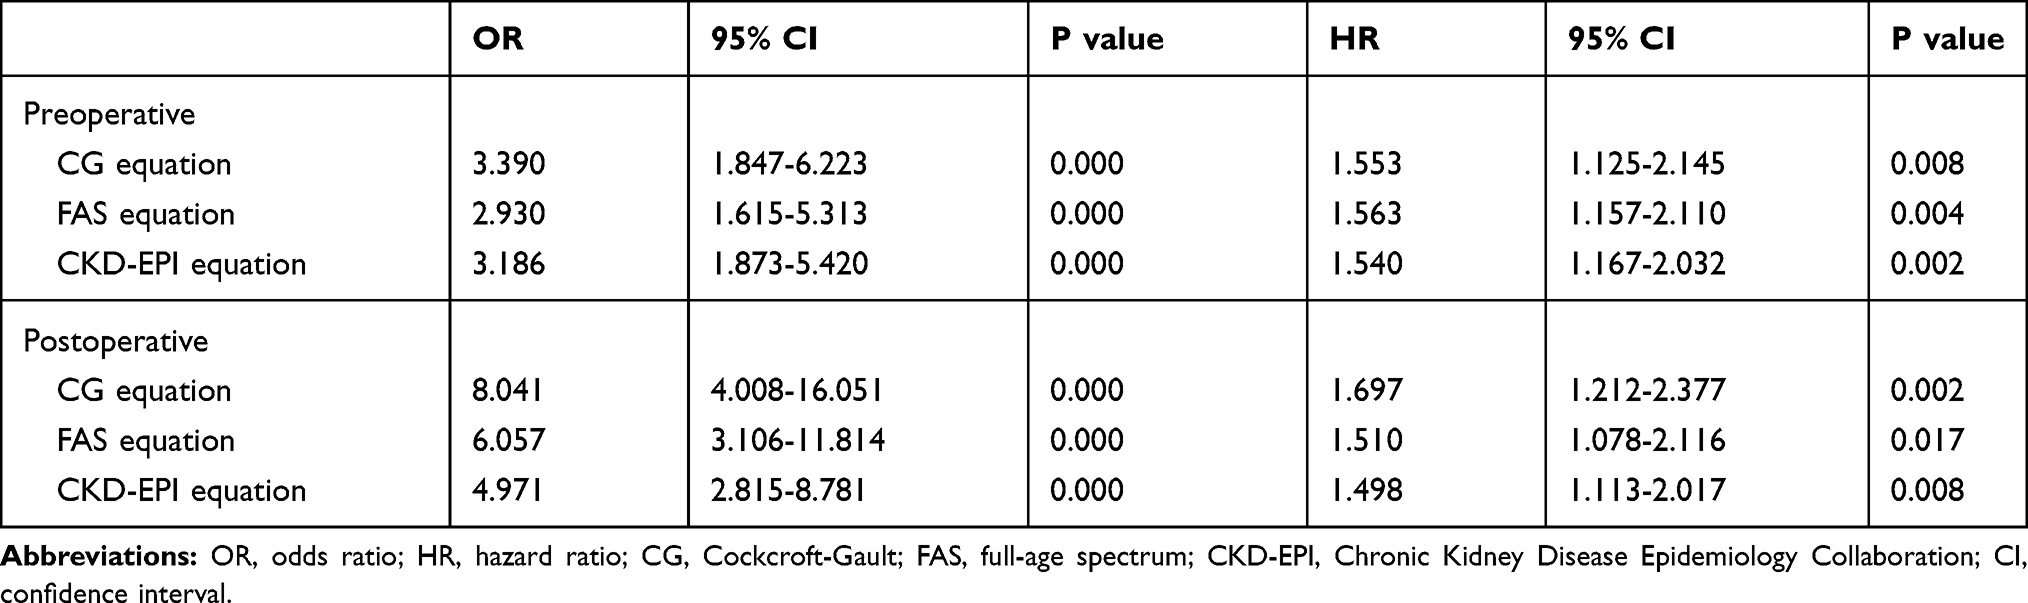 |
Table 4 Multivariate Logistic Regression Models for In-Hospital Mortality and Multivariable Cox Proportional Hazards Models for Long-Term Mortality |
Multivariable Cox regression analysis showed that decreasing preoperative and postoperative eGFR was related to higher long-term all-cause mortality (HR: 1.553, 95% CI 1.125-2.145 for CG; HR 1.563, 95% CI 1.157-2.110 for FAS; HR: 1.540, 95% CI 1.167-2.032 for CKD-EPI). The postoperative decrease of eGFR was more closely related to long-term mortality (Table 4).
Patients who died after operation were excluded from the long-term survival analysis in order to better assess the impact of eGFR estimated by different equations. During the 50.17±35.96 months of follow-up, the long-term all-cause mortality was 8.17% (n=109) in the total cohort. The demographics and clinical characteristics were compared between patients who died and survived in the followed-up. No matter which equations were used to evaluate renal function, the renal function of the dead patients was worse than that of the living patients (Table S2). Kaplan–Meier curves showed group IV had significantly poor survival regardless of the equations used to compute eGFR (Figure 4).
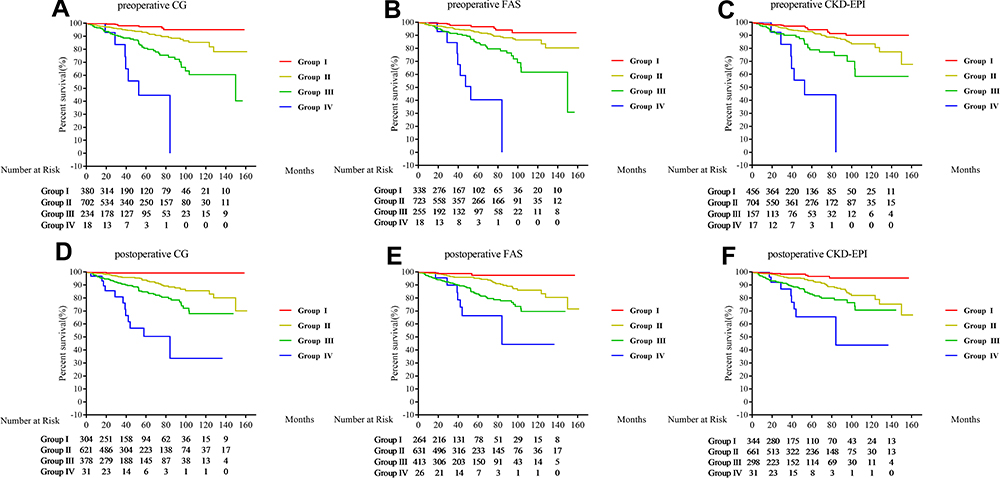 |
Figure 4 Kaplan–Meier curves for the survival rate of 4 renal function grades determined by 3 eGFR equations. Preoperative and postoperative renal function grades were calculated and analyzed, respectively. (A) Kaplan–Meier curves determined by preoperative CG; (B) Kaplan–Meier curves determined by preoperative FAS; (C) Kaplan–Meier curves determined by preoperative CKD-EPI; (D) Kaplan–Meier curves determined by postoperative CG; (E) Kaplan–Meier curves determined by postoperative FAS; (F) Kaplan–Meier curves determined by postoperative CKD-EPI. |
Discussion
After an extensive literature review, we find this is the first study to compare the efficiency of different creatinine-based equations for predicting short-term and long-term mortality after OPCABG in China. Renal function measured by the CG equation demonstrated the best ability of predicting in-hospital mortality among the three commonly used equations. Regardless of different equations, low eGFR was a significant risk factor for long-term mortality. There were quite amount of researches supporting that CG formula was confirmed the best in terms of discrimination and calibration in patients undergoing PCI, but few researches about its value in OPCABG.15–20 Our study aimed to explore this problem and found that the CG equation performed better in predicting long-term outcome, which confirms the findings in previous studies.15–20 The discriminatory power of postoperative eGFR measured by the three equations was higher than preoperative eGFR.
GFR estimation, as the gold standard to estimate renal function, is complicated and time-consuming. Therefore, some practical creatinine-based equations to estimate GFR are widely used in clinical practice, including the CG, FAS, and CKD-EPI equations. These equations were not specifically developed for patients with cardiac disease, and most of the relevant studies focused on comparing the accuracy between eGFR and measured GFR.8–10 Even for the same population, the eGFR assessments from different equations are remarkably different.21 There is little literature on the predictive efficiency of different equations applied to patients undergoing OPCABG. Although a higher eGFR is related to the better prognosis after OPCABG, they are not the same thing. The CG, FAS, and CKD-EPI equations, which are mostly based on the data of Western populations, should be well validated before clinical application into Chinese patients.
As reported, renal insufficiency is a common co-morbidity and a clear risk factor among patients undergoing cardiac surgery worldwide. In the present study, the in-hospital and long-term mortality rates were both significantly higher in group IV.
The CG equation was the first creatinine clearance estimating equation in the world and performed well in clinical applications.3,15-20 With deeper understanding into the clinical significance of GFR, many new GFR estimation equations have been developed. The CKD-EPI equation published in 2009 was recommended for adults in the KDIGO 2012 guideline.1,4,22 The FAS equation was recently developed and validated by Caucasian populations in 2016.5 At present, many studies focus on comparing and validating the accuracy of different equations in estimating the GFR of patients with specific diseases. Due to different reasons (eg, race, disease, age, data size), each equation has its characteristics, and none of the equations for estimating GFR has an absolute advantage. In addition, some clinical researchers have studied the ability of different equations to predict mortality or other end-point. Most studies show that the CG equation is superior over other new equations for patients with cardiologic diseases.15–20 The results are consistent with a cohort study involving 5559 CABG patients in China,15 which demonstrate that the CG equation outperforms other equations in predicting in-hospital mortality. The same conclusion was reached in the study of 9987 CABG patients in the Netherlands.18
This study suggests that the CG equation is better than the FAS and CKD-EPI equations in predicting in-hospital and long-term mortality. One possible reason is that the CG equation includes the basic and important parameters of body weight, while the FAS and CKD-EPI equations lack these parameters. In the pre-experiment, when all data were unadjusted by BSA, the results were not ideal, which implies the importance of height and weight of patients. Body mass index is considered as an independent factor for in-hospital mortality after CABG, especially in Chinese patients.23,24
Interestingly, the ability of the CG equation to predict adverse outcomes has been clearly reported, while its performance to evaluate GFR is less good than other new equations.2,4,5 Thus, there seems to be a delicate balance in overall ability. All the three equations indicate that the predictive efficiency of postoperative eGFR is higher than preoperative eGFR. This is because postoperative renal function is affected by both preoperative renal function and the trauma of operation. To some extent, it reflects the situation and effect of surgical operation. Logically, postoperative renal dysfunction is closely related to short-term and long-term outcomes.
Long-term survival analysis suggests that postoperative renal function is more sensitive than the preoperative one. Because the weight of preoperative renal function is significantly reduced after surgical intervention, preoperative renal function is not a meaningful predictor of long-term outcomes, as confirmed by this cohort study too.
Limitation
This retrospective observational design was based on a single institution. Although neither the detection method nor the standard of serum creatinine changed, the surgical practice, anesthesia, and postoperative care all changed over the study period, which can lead to selection bias. The non-randomized study population was small and no standard measured GFR was available in the cohort study. Furthermore, eGFR was estimated by a single serum creatinine before and after operation.
Conclusions
The three equations show the similar trend that short-term and long-term mortality rates increase with the degree of renal insufficiency. Postoperative eGFR is strongly predictive of short-term and long-term mortality compared with preoperative eGFR. The CG equation is better than FAS and CKD-EPI equations in predicting mortality in Chinese patients after OPCABG.
Data Sharing Statement
We are pleased to share data. The data involved in our research are available from the corresponding author. We will respond in 7 days on reasonable request.
Funding
This research received no grant from any funding agency in the public, commercial, or not-for-profit sectors.
Disclosure
The authors declare that there is no conflict of interest.
References
1. Kidney Disease: Improving Global Outcomes (KDIGO) CKD Work Group. KDIGO 2012 clinical practice guideline for the evaluation and management of chronic kidney disease. Kidney Int Suppl. 2013;3:1–150.
2. Levey AS, Bosch JP, Lewis JB, Greene T, Rogers N, Roth D. A more accurate method to estimate glomerular filtration rate from serum creatinine: a new prediction equation. Modification of Diet in Renal Disease Study Group. Ann Intern Med. 1999;130(6):461–470. doi:10.7326/0003-4819-130-6-199903160-00002
3. Cockcroft DW, Gault MH. Prediction of creatinine clearance from serum creatinine. Nephron. 1976;16(1):31–41. doi:10.1159/000180580
4. Levey AS, Stevens LA, Schmid CH, et al. A new equation to estimate glomerular filtration rate. Ann Intern Med. 2009;150(9):604–612. doi:10.7326/0003-4819-150-9-200905050-00006
5. Pottel H, Hoste L, Dubourg L, et al. An estimated glomerular filtration rate equation for the full age spectrum. Nephrol Dial Transplant. 2016;31(5):798–806. doi:10.1093/ndt/gfv454
6. Ge W, Gu C, Chen C, et al. High-sensitivity troponin T release profile in off-pump coronary artery bypass grafting patients with normal postoperative course. BMC Cardiovasc Disord. 2018;18(1):157. doi:10.1186/s12872-018-0893-2
7. Shan L, Ge W, Pu Y, et al. Assessment of three risk evaluation systems for patients aged >/=70 in East China: performance of SinoSCORE, EuroSCORE II and the STS risk evaluation system. PeerJ. 2018;6:e4413. doi:10.7717/peerj.4413
8. Madero M, Sarnak MJ. Creatinine-based formulae for estimating glomerular filtration rate: is it time to change to chronic kidney disease epidemiology collaboration equation? Curr Opin Nephrol Hypertens. 2011;20(6):622–630. doi:10.1097/MNH.0b013e32834ba210
9. O’Callaghan CA, Shine B, Lasserson DS. Chronic kidney disease: a large-scale population-based study of the effects of introducing the CKD-EPI formula for eGFR reporting. BMJ Open. 2011;1(2):e000308.
10. Abouchacra S, Chaaban A, Gebran N, et al. GFR estimation in the morbidly obese pre- and postbariatric surgery: one size does not fit all. Int Urol Nephrol. 2013;45(1):157–162. doi:10.1007/s11255-012-0131-2
11. Du Bois D, Du Bois EF. A formula to estimate the approximate surface area if height and weight be known. 1916. Nutrition. 1989;5(5):
12. Altman DG. Practical Statistics for Medical Research. CRC press; 1990.
13. Pencina MJ, D’Agostino RB
14. Vickers AJ, Elkin EB. Decision curve analysis: a novel method for evaluating prediction models. Med Decis Making. 2006;26(6):565–574. doi:10.1177/0272989X06295361
15. Lin Y, Zheng Z, Li Y, et al. Impact of renal dysfunction on longterm survival after isolated coronary artery bypass surgery. Ann Thorac Surg. 2009;87:1079–1084. doi:10.1016/j.athoracsur.2009.01.065
16. Abu-Assi E, Lear P, Cabanas-Grandio P, et al. A comparison of the CKD-EPI, MDRD-4, and Cockcroft-Gault equations to assess renal function in predicting all-cause mortality in acute coronary syndrome patients. Int J Cardiol. 2013;167(5):2325–2326. doi:10.1016/j.ijcard.2012.11.014
17. Szummer K, Lundman P, Jacobson SH, et al. Cockcroft-Gault is better than the Modification of Diet in Renal Disease study formula at predicting outcome after a myocardial infarction: data from the Swedish Web-system for Enhancement and Development of Evidence-based care in Heart disease Evaluated According to Recommended Therapies (SWEDEHEART). Am Heart J. 2010;159(6):979–986. doi:10.1016/j.ahj.2010.03.028
18. van Straten AH, Soliman Hamad MA, Koene BM, et al. Which method of estimating renal function is the best predictor of mortality after coronary artery bypass grafting? Neth Heart J. 2011;19(11):464–469. doi:10.1007/s12471-011-0184-3
19. Parsh J, Seth M, Aronow H, et al. Choice of Estimated Glomerular Filtration Rate Equation Impacts Drug-Dosing Recommendations and Risk Stratification in Patients With Chronic Kidney Disease Undergoing Percutaneous Coronary Interventions. J Am Coll Cardiol. 2015;65(25):2714–2723. doi:10.1016/j.jacc.2015.04.037
20. Tomaszuk-Kazberuk A, Kozuch M, Malyszko J, Bachorzewska-Gajewska H, Dobrzycki S, Musial WJ. Which method of GFR estimation has the best prognostic value in patients treated with primary PCI: cockcroft-Gault formula, MDRD, or CKD-EPI equation?–A 6-year follow-up. Ren Fail. 2011;33(10):983–989. doi:10.3109/0886022X.2011.618922
21. Ji M, Lee YH, Hur M, et al. Comparing Results of Five Glomerular Filtration Rate-Estimating Equations in the Korean General Population: MDRD Study, Revised Lund-Malmo, and Three CKD-EPI Equations. Ann Lab Med. 2016;36(6):521–528. doi:10.3343/alm.2016.36.6.521
22. Ohsawa M, Tanno K, Itai K, et al. Concordance of CKD stages in estimation by the CKD-EPI equation and estimation by the MDRD equation in the Japanese general population: the Iwate KENCO Study. Int J Cardiol. 2013;165(2):377–379. doi:10.1016/j.ijcard.2012.08.025
23. Wagner BD, Grunwald GK, Rumsfeld JS, et al. Relationship of body mass index with outcomes after coronary artery bypass graft surgery. Ann Thorac Surg. 2007;84(1):10–16. doi:10.1016/j.athoracsur.2007.03.017
24. He J, Gu D, Wu X, et al. Major causes of death among men and women in China. N Engl J Med. 2005;353(11):1124–1134. doi:10.1056/NEJMsa050467
 © 2020 The Author(s). This work is published and licensed by Dove Medical Press Limited. The
full terms of this license are available at https://www.dovepress.com/terms
and incorporate the Creative Commons Attribution
- Non Commercial (unported, 3.0) License.
By accessing the work you hereby accept the Terms. Non-commercial uses of the work are permitted
without any further permission from Dove Medical Press Limited, provided the work is properly
attributed. For permission for commercial use of this work, please see paragraphs 4.2 and 5 of our Terms.
© 2020 The Author(s). This work is published and licensed by Dove Medical Press Limited. The
full terms of this license are available at https://www.dovepress.com/terms
and incorporate the Creative Commons Attribution
- Non Commercial (unported, 3.0) License.
By accessing the work you hereby accept the Terms. Non-commercial uses of the work are permitted
without any further permission from Dove Medical Press Limited, provided the work is properly
attributed. For permission for commercial use of this work, please see paragraphs 4.2 and 5 of our Terms.